Will Gold Hold?
Gold bulls have had a rough go.
I've been skeptical on this space for some time.
See the latest charts and outlook.
Gold (NYSEARCA:GLD) bulls have had a rough go of it for a few years now. I've shared my skepticism on this market in a variety of articles here at Seeking Alpha since early 2017.
Over a year later, I continue to stress the concept of deciphering where we are the overall cycle. Although this sounds simple, I frankly don't see this done that often (outside of what appears to be a consensus assumption of a new bull market).
As someone who thrived during the real gold (GLD) bull in 2004-2011, I continue to find modern day gold bulla arguments (both technical and fundamental) fairly flimsy.
Today my focus will be primarily technical and behavioral.
The cycle
The following chart (although now over 1 year old), continues to hold from a larger cycle perspective. Admittedly when I put it together, I would have expected a fail by now (if the model were correct). From that standpoint gold has been resilient at what 'could' have been considered the ultimate 'return to hope' moment.
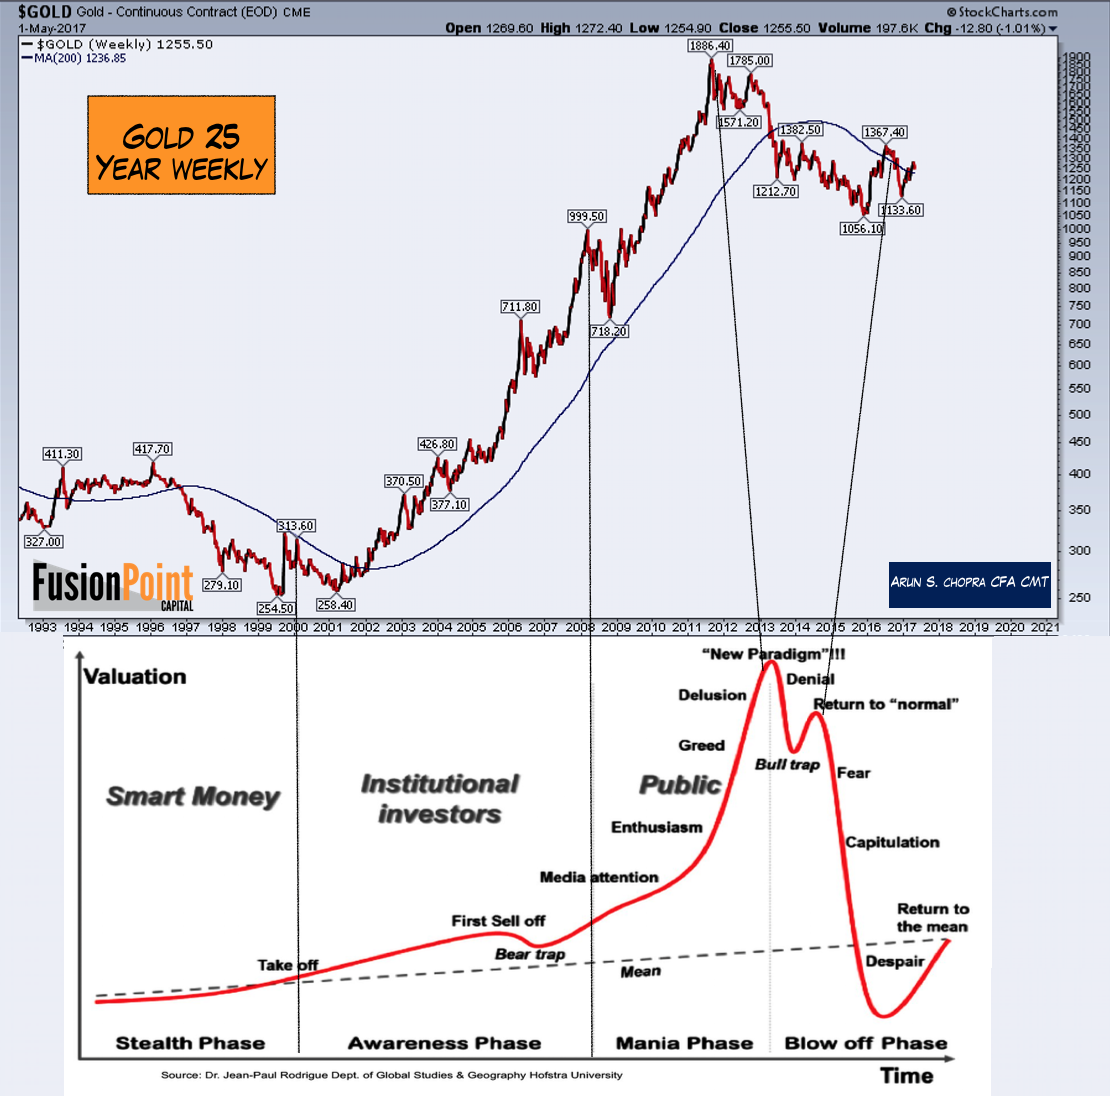
On the other hand, the above chart is not simply some overused common template. It's a behavioral issue. The real question continues to be was 2016 a 'return to hope' moment, even if price has held up relatively well ever since?
The first step is to define what a 'return to hope' moment looks like. Behaviorally speaking its a combination of a bounce post a blowoff top (keeping bulls in the market) but also a sharp enough move to get all those who watched the market rally without them (during the bull market), chase price assuming there are new highs coming. It's a combination of keeping bulls in, but creating a large fear of missing out moment as well.
2016 Return to Hope?
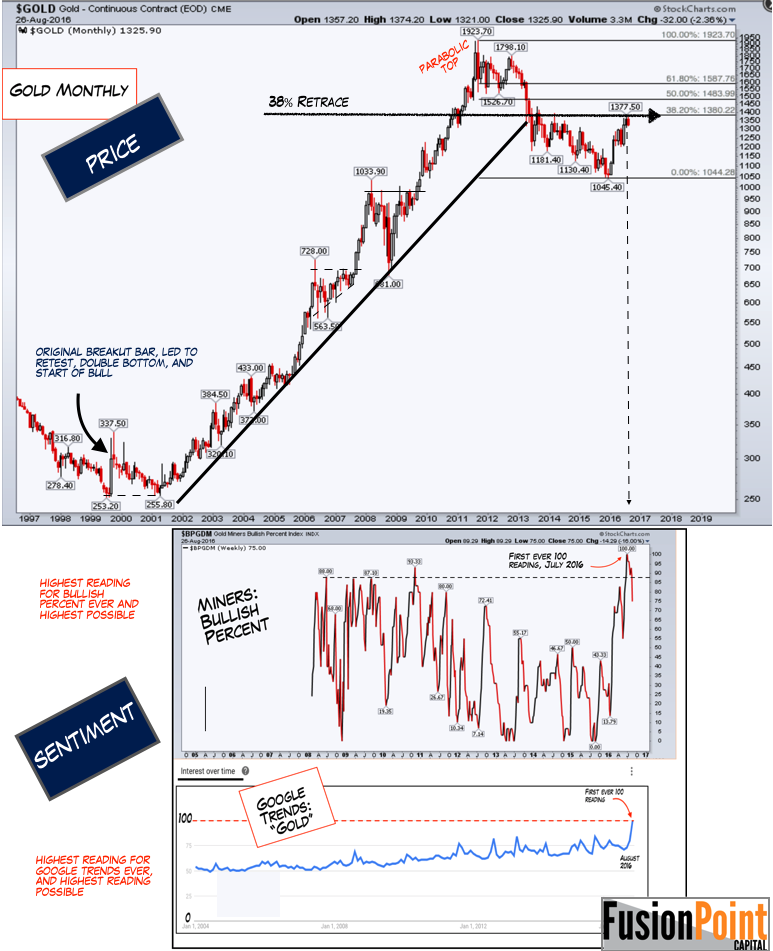
With the above in mind I present two charts from that time that speak to this concern.
The first chart below looks back at this moment and comparing two forms of sentiment, bullish percent readings, and google trends data. The bottom two panels both registered off the record readings in 2016. This suggests significant fear of missing out even though the top at 1900+ was well in place.
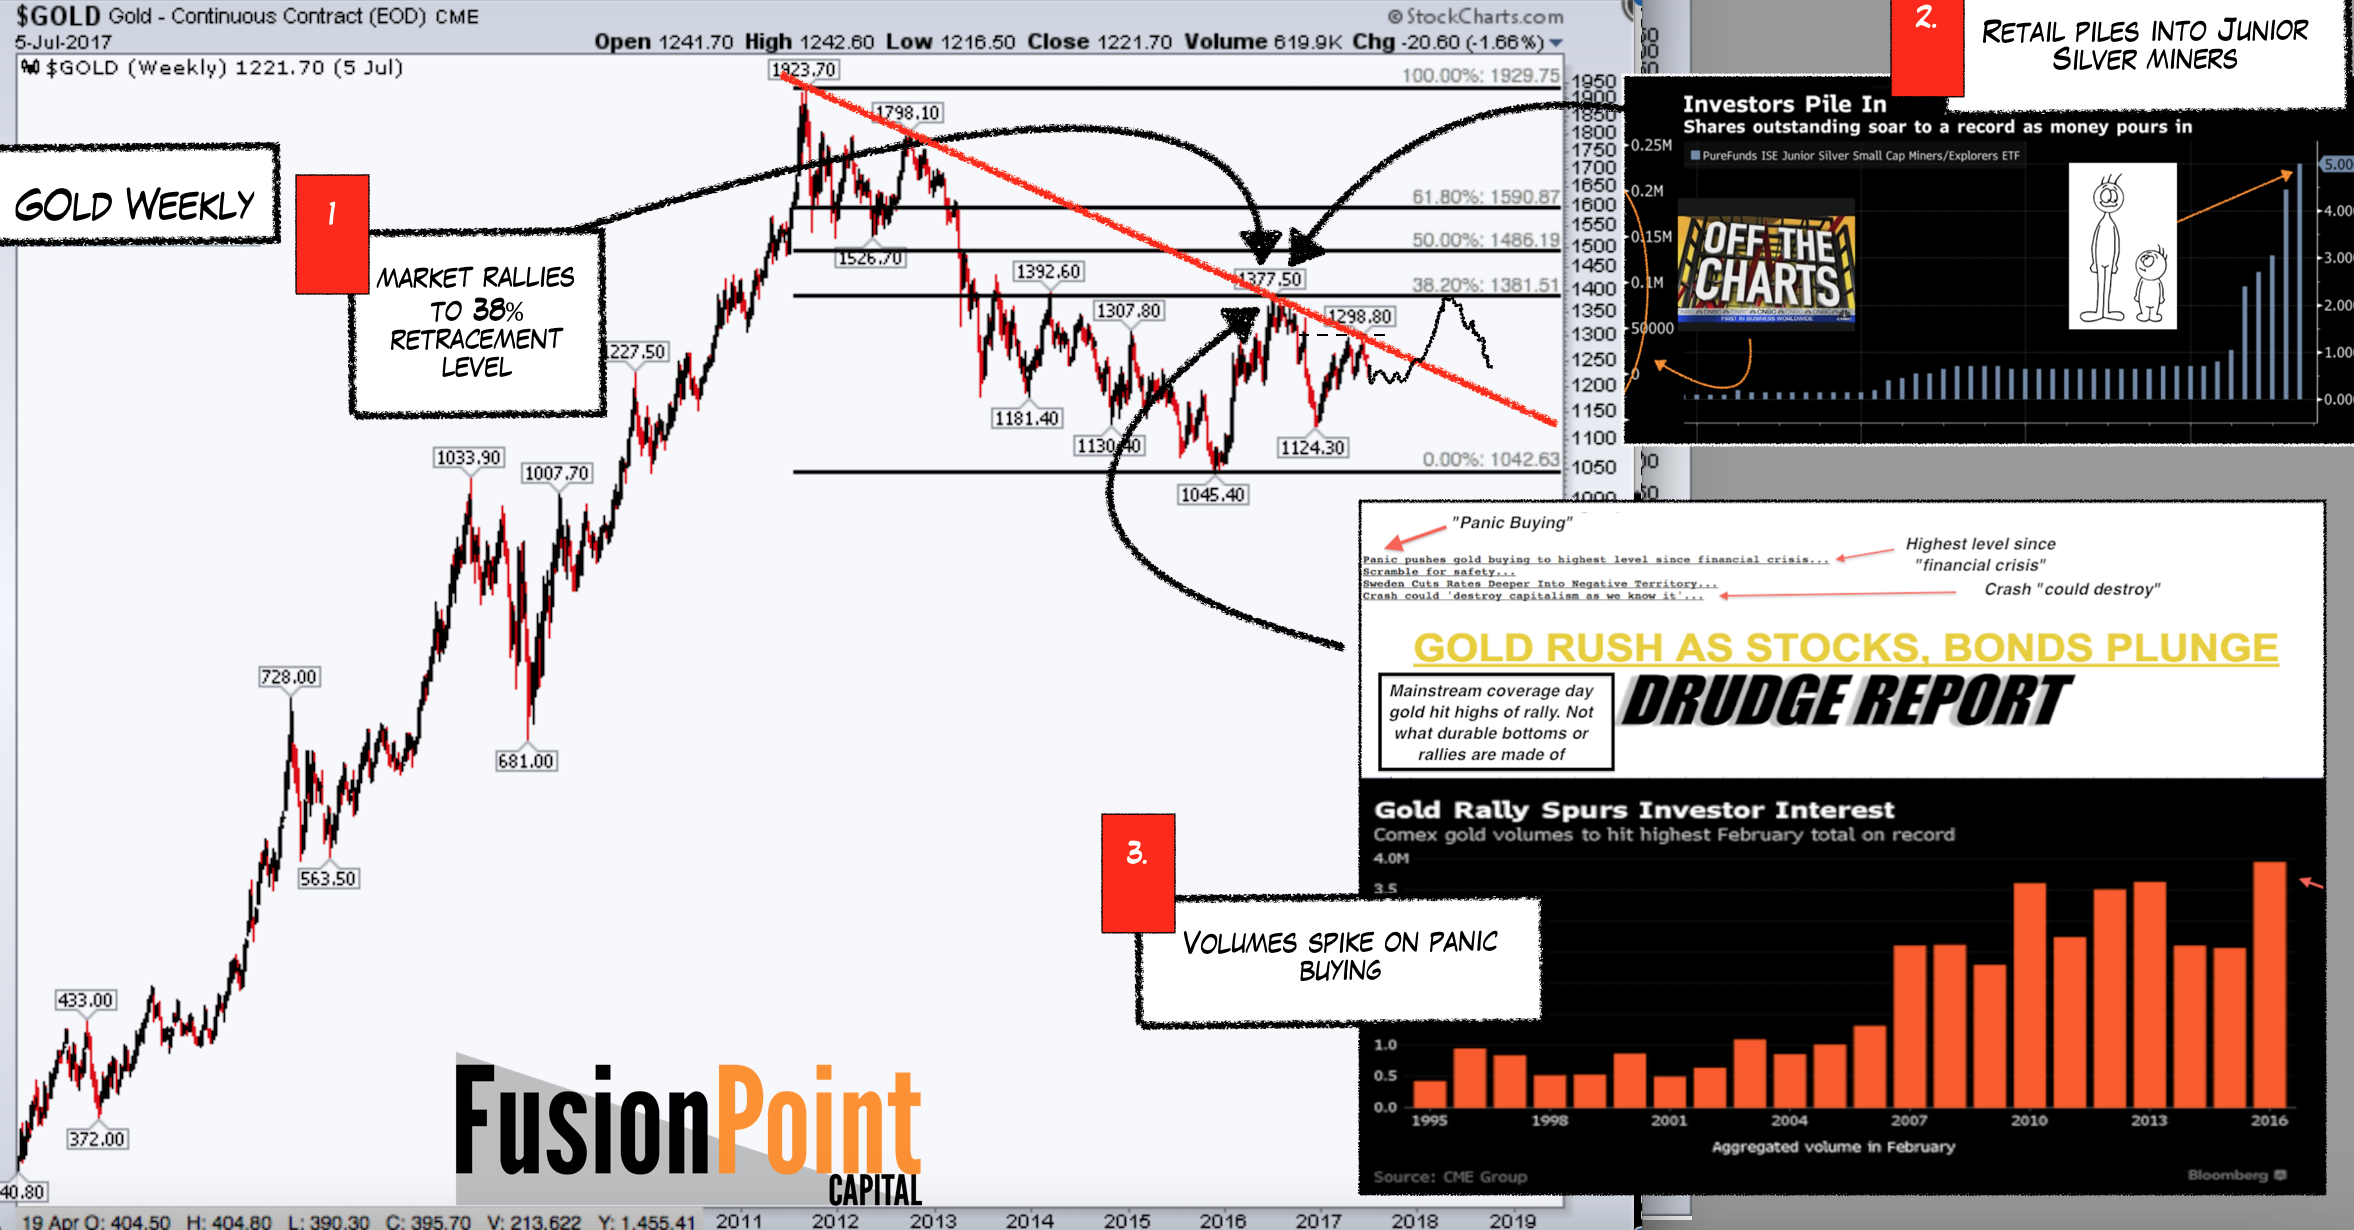
The following chart is a bit messy, but it shows more data from gold in 2016. Of importance for our sentiment discussion are points 2 and 3. Here we see volume spikes and the largest buying of silver miners in the entire cycle right as price peaked. Keep in mind silver (SLV) is the most speculative part of the market, suggesting a significant amount of fear of missing out type behavior.
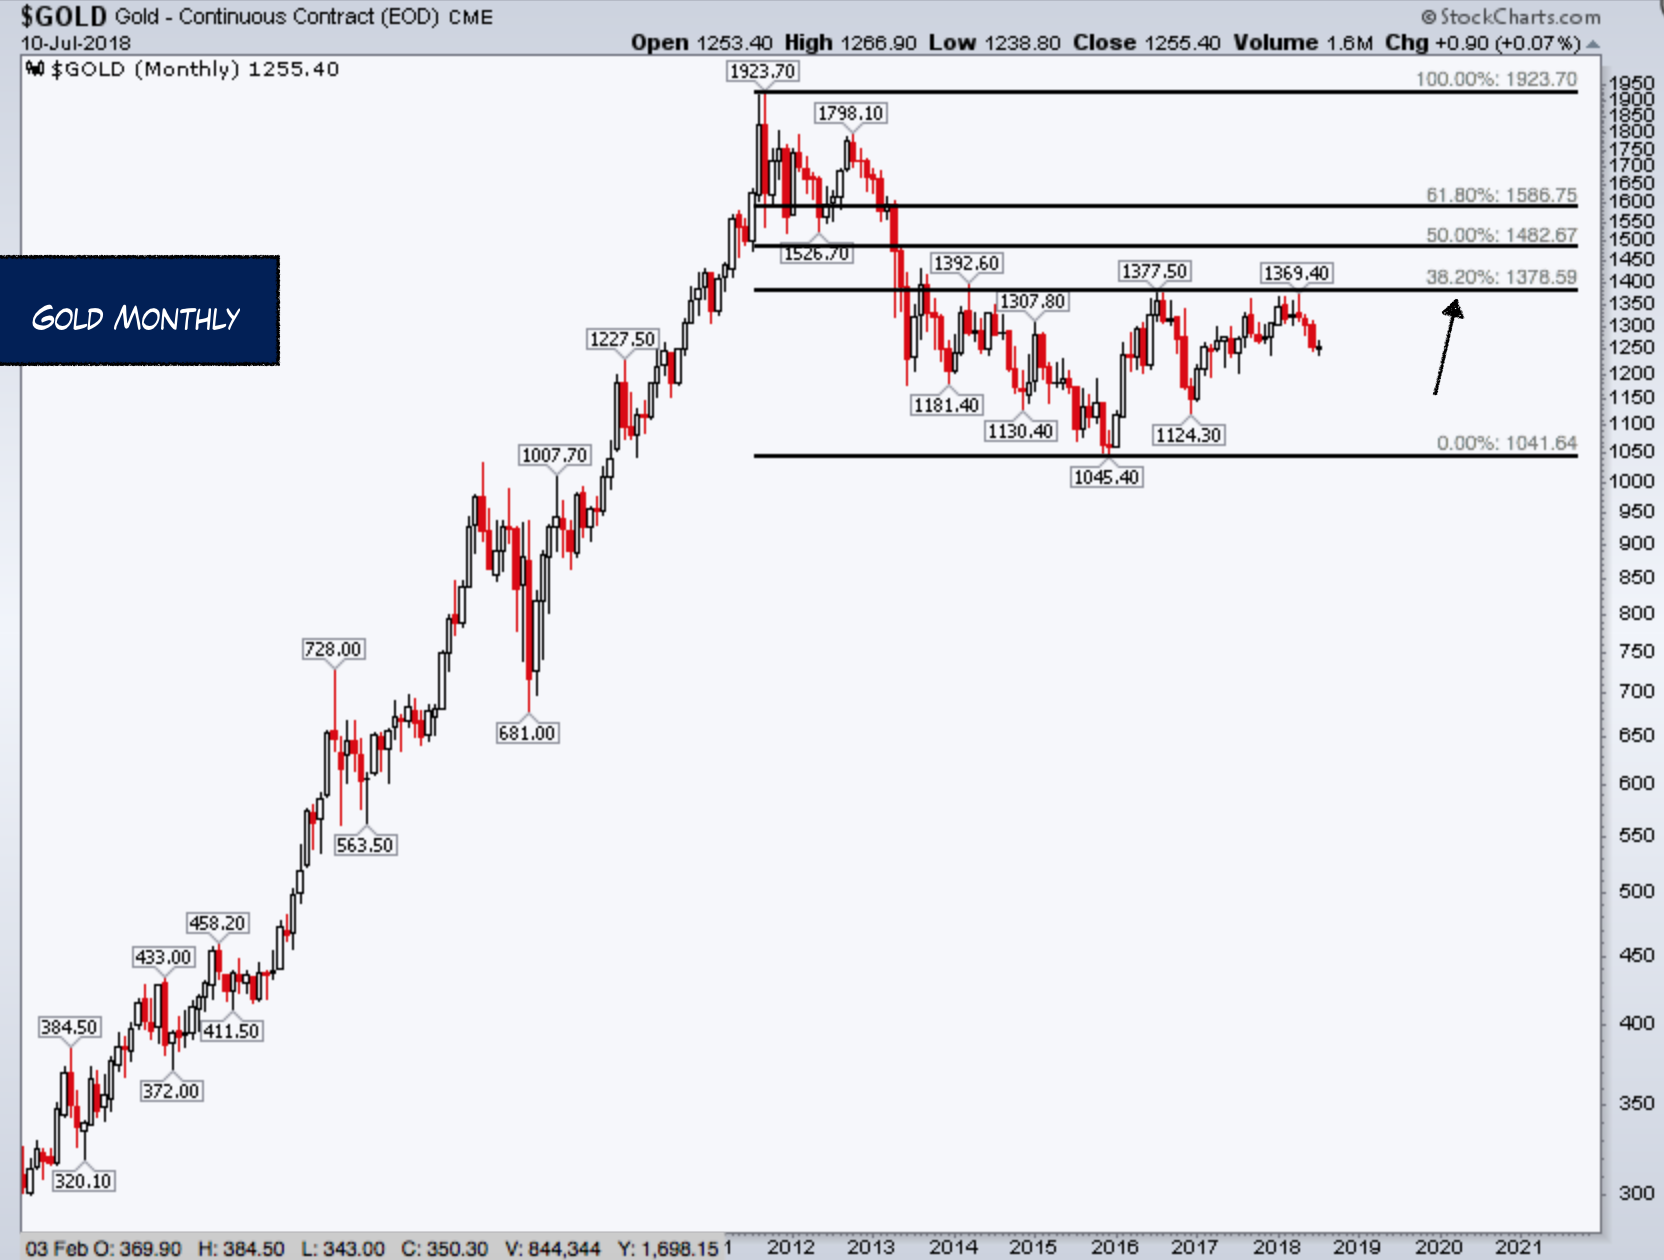
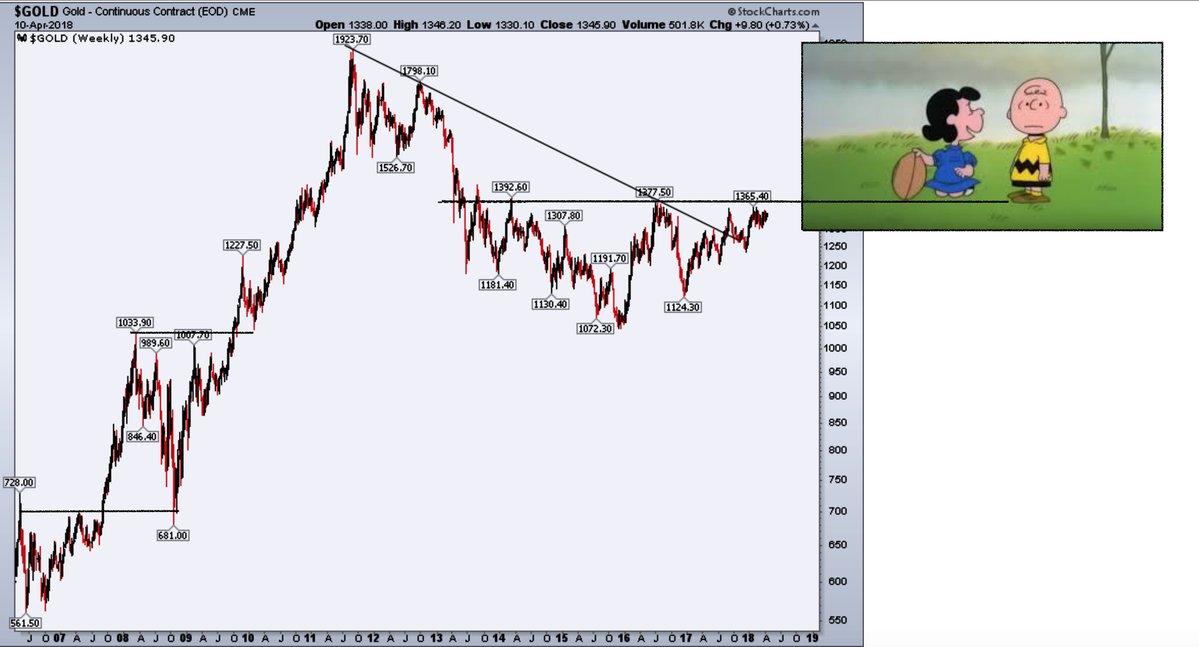
Todays Market
Moving a bit forward to today's market, a year later we see those highs still holding as resistance. Further the 38% retrace from the 1923 high to the 1045 low is acting as resistance. Although I am not a huge fan of fib retracements, used on the right markets in the proper time frames and contexts is useful.
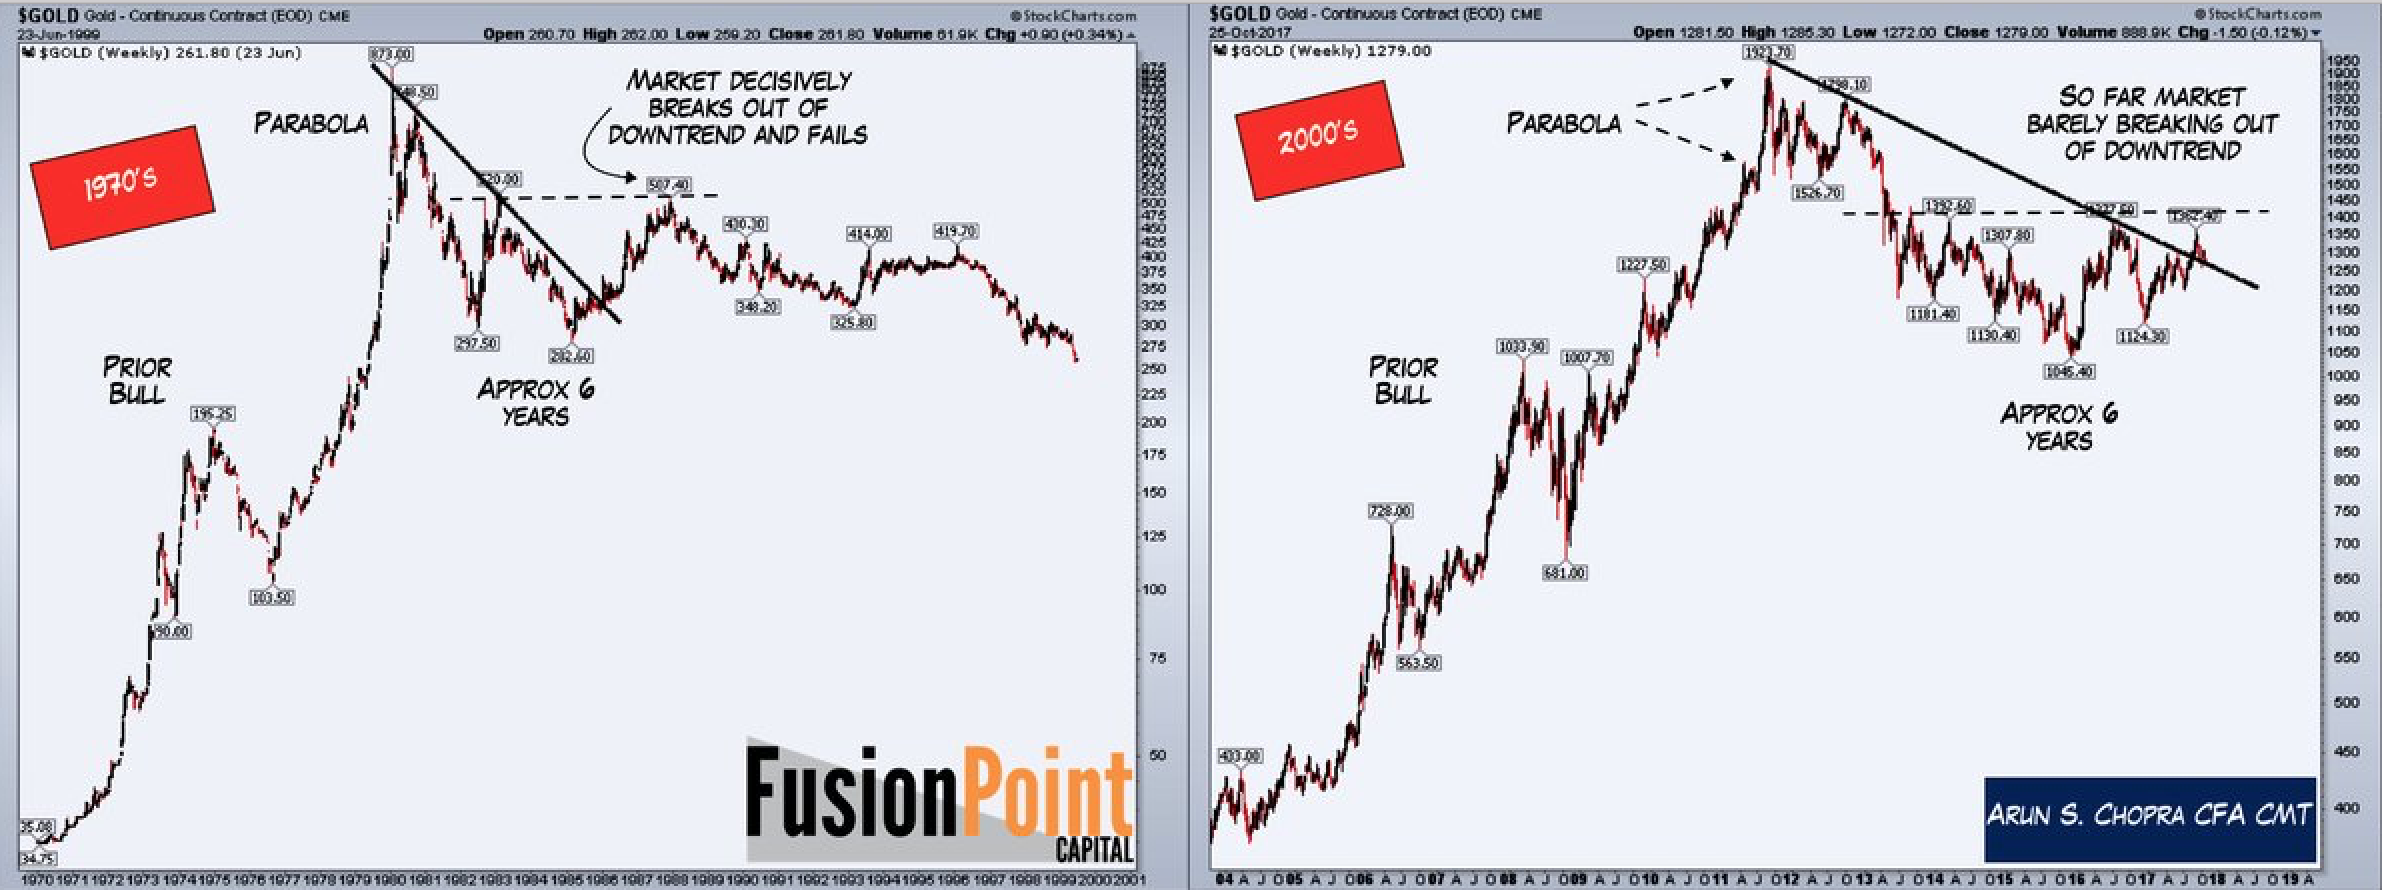
From a long term trend perspective, the following chart shows the big picture uptrend is also under threat.  Lastly with respect to gold (GLD) and the long term. There was much speculation that the breakout of the multi-year downtrend from the 1923 highs as the start of a bull. Below I show the 1970's market and now. Of importance is the concept that the 70's market also broke it's downtrend, only to rollover again.
Miners
A big mistake I've seen gold (GLD) bulls make more recently is ignoring inter-market analysis, specifically policy coming out of the BOJ. The chart below shows the Japanese 10 year yield vs gold miners. You can clearly see the relationship between rates and miners ever since the BOJ capped their long bond. Essentially this policy has put a cap on the gold miners (GDX) as well.
This below makes sense when you think about interest rate parity and currency values between the Yen (FXY) and the dollar (UUP).

Conclusion
Ultimately time will tell on this market, but to me it's clear the only thing that matters is, is it a new bull, or is it a continued bear. The answer to me can be found in that 2016 data.
Furthermore my sense is there is still a large contingency that believes this is 'obviously the start of a new bull market', something I simply haven't seen any real evidence of for quite some time.
Thanks for reading..
Disclosure: I am/we are short NEM.
I wrote this article myself, and it expresses my own opinions. I am not receiving compensation for it (other than from Seeking Alpha). I have no business relationship with any company whose stock is mentioned in this article.
Follow Arun Chopra CMT, CFA and get email alerts