The 2nd Massive Downwave IS ALMOST UPON US...
By Clive Maund / May 04, 2020 / news.goldseek.com / Article Link
Notwithstanding the Fed's seemingly limitless ability to create money to throw at the stockmarket, which has caused it to rally in recent weeks in the face of a dead economy and apocalyptic jobs data and earnings etc., all the charts we are going to look at here point to another severe downleg soon.
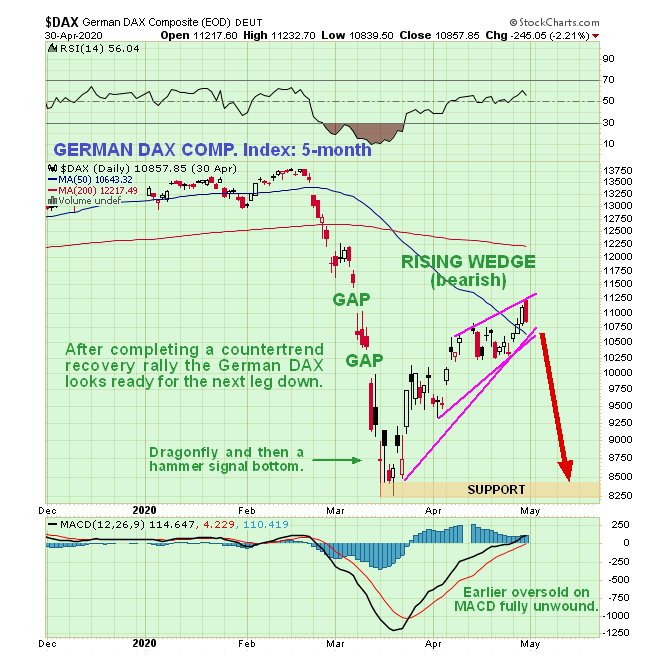
My attention was drawn to a bearish Rising Wedge completing in the London FTSE index by a colleague in England. So I took a look at it, and sure enough it is. So, I thought I'd take a look at a couple of other European indices, the CAC 40 in France and the German DAX Composite, which showed a very similar picture. Their charts are shown below and as you will see, they are both very bearish, and point to a break lower soon leading to a severe decline.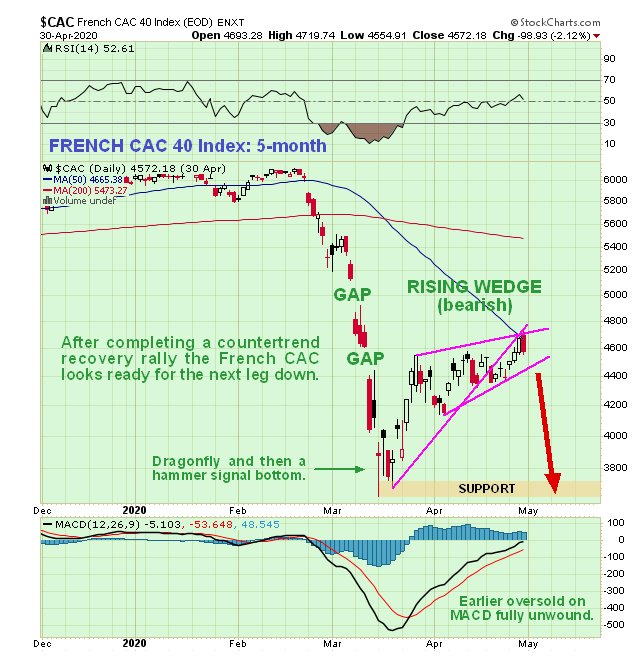
 You will recall that we were thrown somewhat a week or two ago, when the main US indices, the Dow Jones Industrials and the S&P500 index, broke down from their bearish Rising Wedges but then didn't follow through, and instead rose to new highs for the rally from the March lows, which caused us to dump our Puts and then bide our time to see what transpired. The sharp drop at the end of the month - this past Friday - jolted me into action and prompted me to hunt around in a quest for greater clarity regarding what is going on, and it has turned out to be a rewarding search.While it's not exactly clear what is going on with the main US indices, the picture becomes much clearer when we look at the broader but much less used Wilshire 5000 index. Take a look at this first of all - it's a 5-month chart for the Wilshire 5000 which reveals that it didn't break down from its Rising Wedge about 10 days ago, unlike the Dow Industrials and the S&P500 index, but it did last Friday, which happened to be the end of the month, by a significant margin. This is regarded as an ominous development that probably marks the start of the 2nd major downleg of this bearmarket. We can also see that the countertrend rally got stopped by the important resistance level shown.
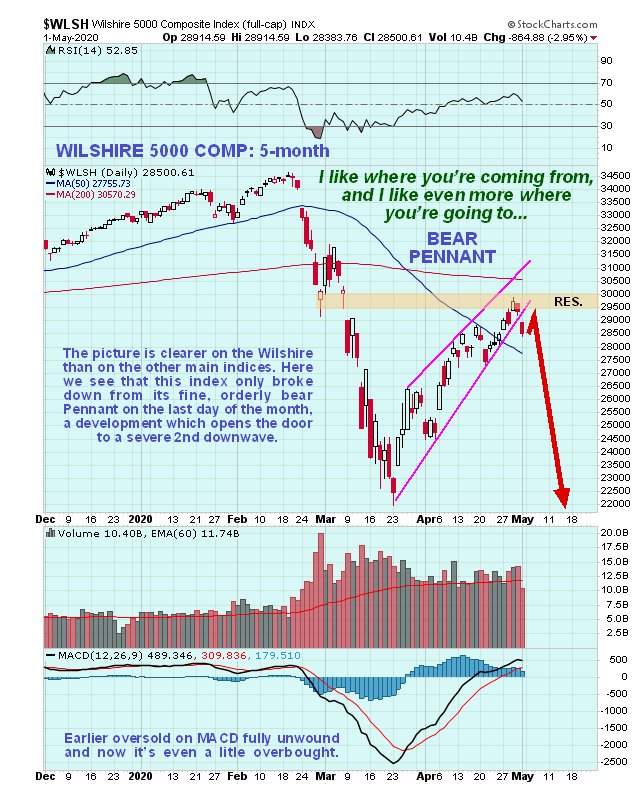 Now take a look at this. The following chart shows that the breakdown from the Wedge happened just 2 days after the Wilshire 5000 had arrived at an upper range Fibonacci target at a retracement level of 61.8% of the preceding 1st leg down of the bearmarket. This is normally as far as a retracement following the 1st leg down of a bearmarket gets, and the same happened following the Tech bubble peak in 2000 and the start of the 2007 - 2008 meltdown.
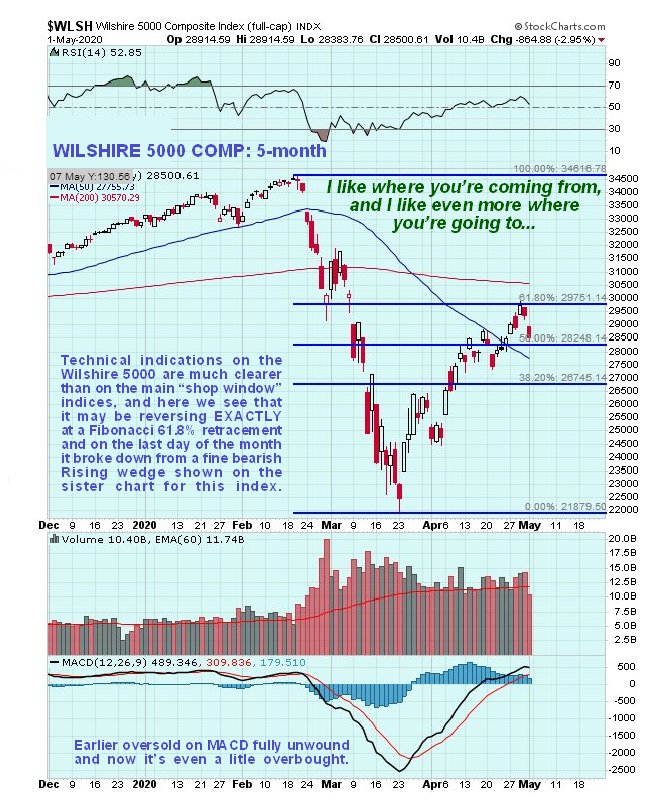 If we now compare the Wilshire charts above with the S&P500 index chart we realize that the breakdown by the latter about 10 days ago was a false breakdown, inasmuch as, as we have just seen, the Wilshire did not break down at that time...
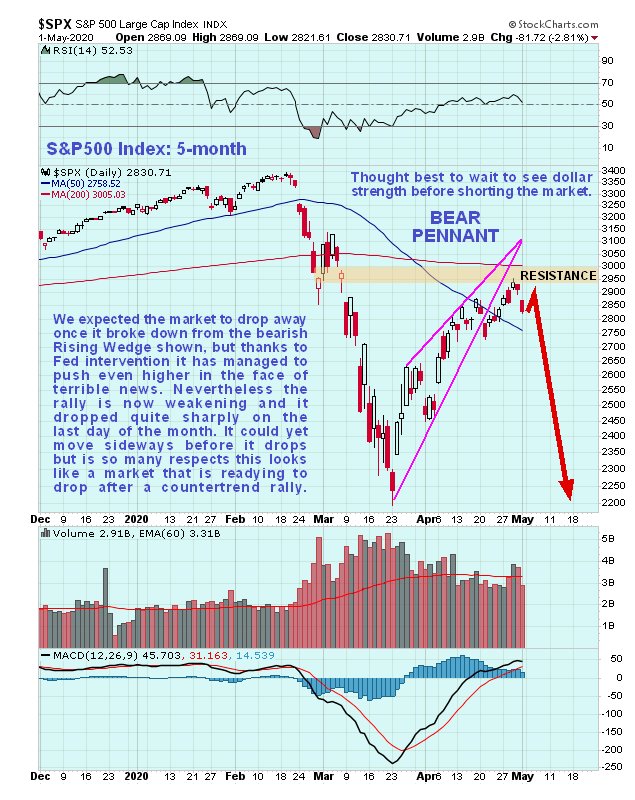 If we see another heavy drop in the broad stockmarket shortly, it is of course reasonable to presume that it will coincide with a strong rally in the dollar, so how does that look now? On the following 5-month chart for the dollar index, which has the S&P500 index placed above and gold below for direct comparison, there are several very important points to observe. The first is that when the market tanked into mid-March, the dollar soared just as we would expect it to and as happened in 2008. Then it dropped back sharply later in March as the market rebounded, but it has since been tracking sideways in a trading range marking time as the stockmarket continued to ascend to complete its relief rally. Right now it is at the support at the bottom of this range where a doji candle formed on Friday suggesting that it is about to start higher again. If the market now proceeds to tank in a 2nd major downwave then we can expect the dollar to soar again, bust out of the top of the current range and probably exceed its mid-March highs.
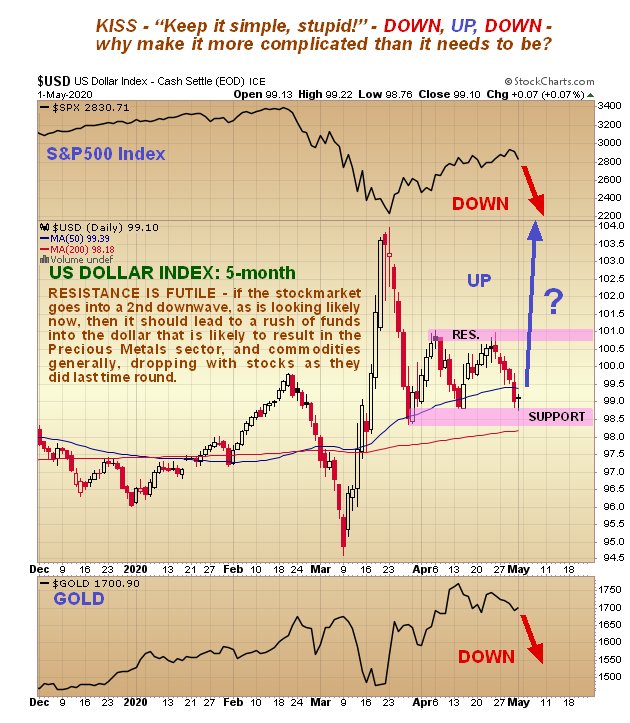 If the dollar soars then commodities are likely to take another broadside, just as in the 1st half of March, and just as in 2008, and gold and silver are unlikely to be spared - the Gold Miners Bullish Percent Index is now at an extreme reading of 92% bullish. Copper in particular looks like it will get crushed by another downwave that should take it to new bearmarket lows by a wide margin...
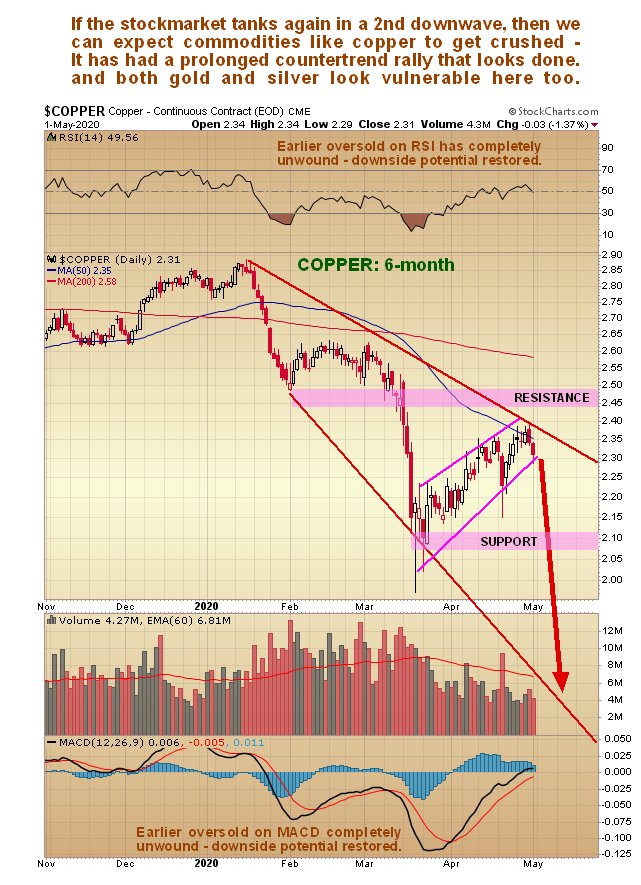
In a follow up article we will be reviewing ways to play the expected move using inverse ETFs and options, both in the broad stockmarket and Precious Metals sector.
End of update.Posted at 4.35 pm EDT on 2nd May 20.
Recent News
Silver outperformance driven by weak supply growth
July 29, 2024 / www.canadianminingreport.com
Supply data still points to major silver deficit this year
July 29, 2024 / www.canadianminingreport.com
Canada second most significant player in global mining M&A
July 22, 2024 / www.canadianminingreport.com
Plenty of potential for continued rotation out of tech
July 22, 2024 / www.canadianminingreport.com
Platinum to palladium ratio low, platinum to gold high, versus history
July 15, 2024 / www.canadianminingreport.com