Silver Refuses To Follow Gold, So Far
Gold falls to a new low in 2018; silver does not.
Silver's range has been narrowing.
A big move can follow a tightening range.
Silver loves to shock.
The ratio tells us that silver is still too cheap.
Gold and silver have been closely linked for over five thousand years. In around 3000 BC, the first Egyptian Pharaoh Menes stated that two and one-half parts silver equal one-part gold. The statement in ancient times was the first time the metals that are the longest standing means of exchange in the world would be linked. Gold and silver have a dual role. As metals, they are both commodities, but also have a history as financial assets. Both precious metals have industrial uses because of the physical characteristics. They are also adornments that symbolize wealth and beauty.
Central banks still hold gold as part of their foreign exchange reserves. Approximately 20% of all the gold ever mined in the history of the earth is the property of governments, central banks, and monetary authorities around the world. Both gold and silver were once held as backing for currencies. These days, fiat currencies only have the backing of the full faith and credit of the countries that print paper legal tender. While most still hold gold as part of their reserves, silver has taken a backseat to the yellow metal on the central bank scene. However, both are still precious metals, and they tend to move higher or lower together over time.
Gold falls to a new low in 2018; silver does not
Until May 15, the low in gold for 2018 stood at $1302.30 per ounce, and the $1300 level stood as a critical psychological support barrier for the yellow metal. However, the weight of a recovering dollar and higher interest rates proved too heavy for the yellow metal, and it declined through the $1300 level to a low of $1281.20 on May 21. 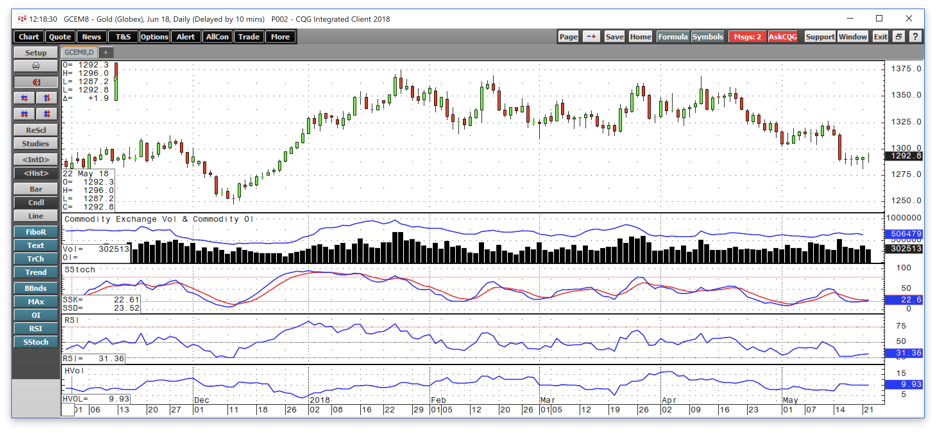
Source: CQG
As the daily chart highlights, gold has stabilized near the recent lows over the past week. The price momentum indicator, the slow stochastic, has declined into oversold territory and open interest has remained stable at between the 500,000 and 510,000 contract level. The relative strength indicator also moved down to an oversold reading as gold fell below the $1300 per ounce level. Gold has not been able to lead silver lower which could be a sign that the yellow metal is near a bottom.
Silver's range has been narrowing
The low in silver so far in 2018 is at $16.07 per ounce on the July COMEX futures contract and $16.00 on the continuous contract. Since the beginning of 2016, the trading range in the silver futures market has narrowed. 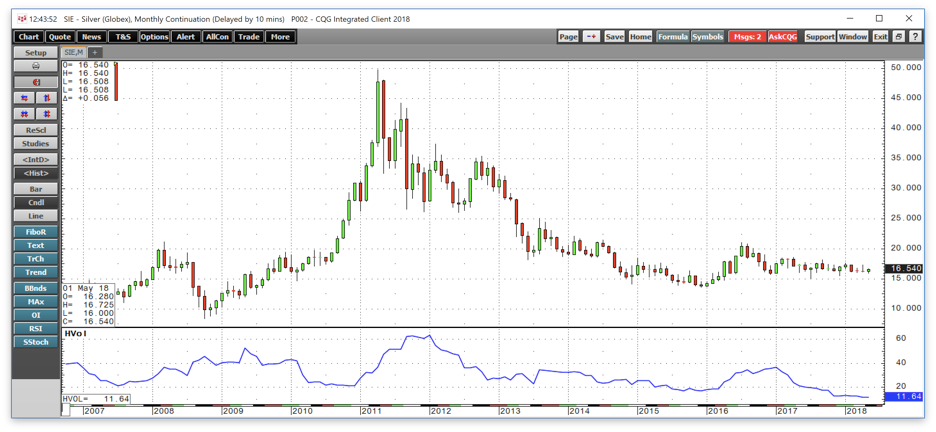
Source: CQG
As the monthly chart highlights, in 2016 silver traded from lows of $13.73 to highs of $21.095, a range of $7.365. In 2017, the range narrowed to $15.15 on the bottom to $18.655 on the top or $3.505 over half the band seen the previous year. So far in 2018, $16 to $17.705 or $1.705 has defined the range which is again, half the trading band of the prior year.
A big move can follow a tightening range
A wedge has formed in the silver market, and over the past three years, the lows have been higher and the highs lower. The price action in silver reminds me of a rubber band that is stretching more and more each day, week, and month since reaching a critical low at the area of technical support at the December 2015 low of $13.635 per ounce. One can only stretch a rubber band so much until it snaps. In the silver market that snap will amount to a move outside the trading range that has sent historical volatility to the lowest level at 11.64% since 2001 when the price of the precious metal was at just over the $4 per ounce level.
The supply and demand fundamentals for silver are always challenging. While there is some primary production of silver, the vast majority of global output for the metal is as a byproduct of many other ores such as copper, lead, zinc, and other minerals. Therefore, the production cost for silver is not as significant a factor when it comes to its price as in other commodities. There are growing demand verticals for the silver market as technological advances in computers, cell phones, and other devices require the metal. At the same time, solar panels contain silver and the growth in popularity of alternatives to traditional forms of power generation has increased the demand for the metal. Each year, the path of least resistance for both silver and gold is often a function of investment demand. Silver's penchant for price volatility has caused many speculators, and trend-following traders have flocked to the silver market as its wide price variance provided lots of opportunities for those looking to buy low and sell high in the market. However, the ascent of digital currencies in 2017 may have drained some liquidity from the silver market as Bitcoin, and its crypto-cousins offered market participants unprecedented price volatility and a trend that was nothing short of astonishing. Digital currencies have gone to sleep over recent months as the prices have declined appreciably from the December 2017 highs and the market cap of the asset class has dropped to half its value over the past six months. Those who bought too late in the rally are likely still licking financial wounds. The narrowing range in silver and its fortitude in the face of the recent decline in the price of gold could drive some buying to the silver market if gold can hold and move back above the $1300 per ounce level.
Silver loves to shock
Silver can be a wild commodity at times when it comes to price volatility. 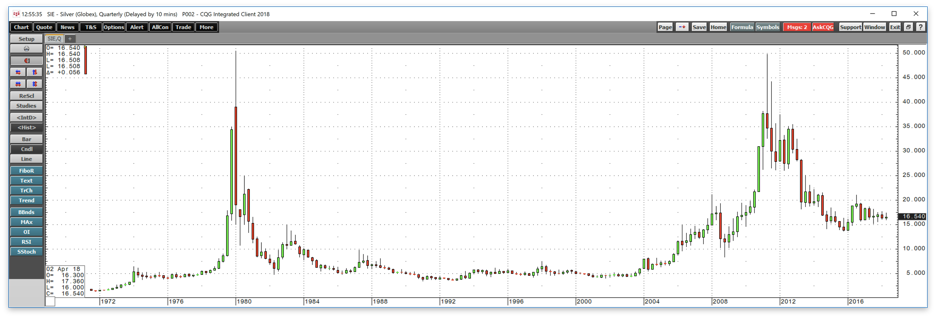
Source: CQG
As the quarterly chart illustrates, in 1979 the price of silver traded at lows of $5.9230, and in 1980 it found its all-time top at $50.36 per ounce, an increase of around eight-and-one-half fold. In 2008, silver found a bottom at $8.40, which was the last time the precious metal traded below the $10 per ounce level. By 2011, the price moved to a peak of $49.82 per ounce, as it appreciated almost six-fold. The price action on the up and downside in silver can be dramatic. In 1981, the metal declined from its all-time acme to reach a low of under $8.00. After the 2011 peak, the price moved steadily lower reaching its most recent bottom in December 2015 at $13.625 per ounce. Silver always has the potential to shock market participants and these days; one metric is telling us that on a historical basis the odds favor a move to the upside when the metal eventually decides to break its narrowing trading range.
The ratio tells us that silver is still too cheap
While the first Egyptian Pharaoh Menes proclaimed the level of the silver-gold rate and under 3:1, in modern times and over the past four decades the median for the price relationship has been much higher. 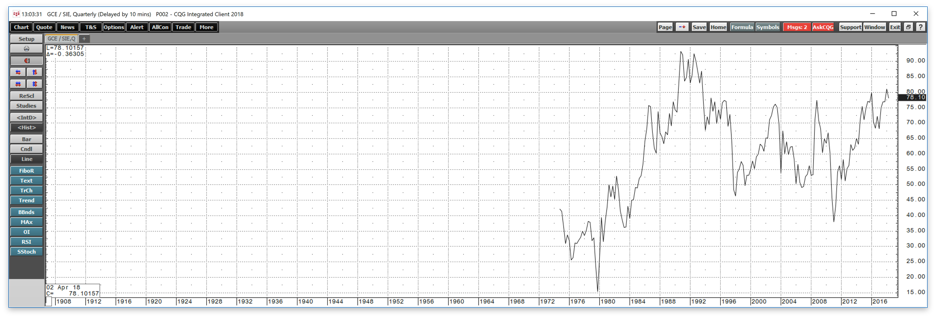
Source: CQG
The quarterly chart dating back to 1974 shows the range in the silver-gold ratio which is the price of gold divided by the price of silver. The relationship traded at its modern-day low in 1979 at 15.47:1, and its high in 1990 at 93.18:1. The average of the low and high is at 54.325:1. The chart shows that the 55:1 or 55 ounces of silver value in each ounce of gold value, stands as a median for the relationship. Since 2012, silver has been above that median which tells us that on a historical basis, silver has become less expensive compared to the price of gold over the past six years and silver offers more value at its current price if history is a guide for the future.
Time will tell if silver is sending the market a signal by its refusal to move to a new low for 2018 at a time when gold has slipped to its lowest level of the year. I believe that the dollar will eventually run out of upside steam and gold will recover above the $1300 per ounce level sooner, rather than later. Silver could be poised for a significant move on the upside as the range has narrowed to a point where a technical breakout could attract hordes of buyers looking to hop on a propel a trend to the upside. 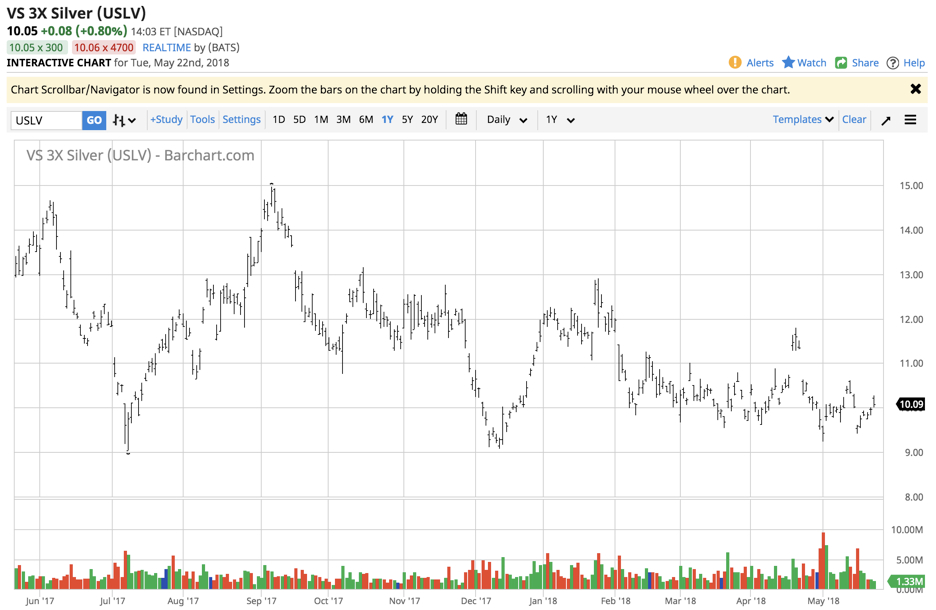
Source: Barchart
I continue to favor the triple-leveraged silver ETN instrument USLV at its current price around the $10.05 per share level. With net assets of nearly $270 million and an average of almost three million shares changing hands each day, USLV is a highly liquid trading instrument.
Silver has refused to follow gold to the downside, which is a sign of strength. If silver does decline below the $16 per ounce level, I will reconsider my bullish opinion of USLV. Critical technical support levels stand at $15.15, the 2017 low, and $13.635 the December 2015 bottom. Given the upside potential for the precious metal, I believe that risk-reward favors the upside and USLV could be an excellent instrument for those who avoid the volatile waters of the futures arena.
The Hecht Commodity Report is one of the most comprehensive commodities reports available today from the #2 ranked author in both commodities and precious metals. My weekly report covers the market movements of 20 different commodities and provides bullish, bearish and neutral calls; directional trading recommendations, and actionable ideas for traders. More than 120 subscribers are deriving real value from the Hecht Commodity Report.
Disclosure: I/we have no positions in any stocks mentioned, and no plans to initiate any positions within the next 72 hours.
I wrote this article myself, and it expresses my own opinions. I am not receiving compensation for it (other than from Seeking Alpha). I have no business relationship with any company whose stock is mentioned in this article.
Additional disclosure: The author always has positions in commodities markets in futures, options, ETF/ETN products, and commodity equities. These long and short positions tend to change on an intraday basis.
Follow Andrew Hecht and get email alerts