Record-Long Economic Expansion and Gold / Commodities / Gold & Silver 2019

 Ladies and Gentlemen, it has finally happened! Thecurrent expansion already goes on for 121 months, becoming the longest economicboom in the US history. Should we celebrate now? Or should we worry, as all good things come to an end, and whatever lasts long,ends up even faster? We invite you to read our today’s article, which assessesthe vitality of the current expansion, and find out whether the U.S. economy in a good shape or on the edge ofcollapse, and what all of this implies for the gold market.
Ladies and Gentlemen, it has finally happened! Thecurrent expansion already goes on for 121 months, which means that the previousrecord of 120 months is now history. Thus, it has become the longest economic boom in the U.S. history. Should wecelebrate now? Or should we worry, as allgood things come to an end, and whatever lasts long, ends up even faster? Isthe U.S. economy in a good shape or on the edge of collapse? Let’s make anassessment!
Firstof all, the GDP growth is at a robust pace of 3 percent, while the unemployment rate is at 3.6 percent, a 50-year low, as one can seein the chart below. It does not looklike any replay of the Great Recession, does it? Actually, the rate of employment growth is exceptionallyrich, much stronger that the mere GDP growth would predict.
Chart1: The real GDP growth (red line, left axis, in % y-o-y) and the unemploymentrate (green line, right axis, U3, in%) from Q1 2007 to Q1 2019.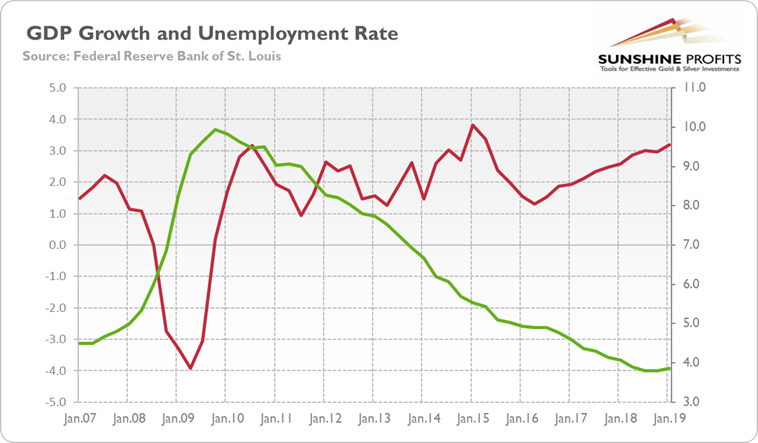
Moreover, inflation is slightly below 2 percent, which is definitelynot a problem for the economy, while the stock market is up by more than 50 percent since 2016, as thechart below shows. Actually, solid GDPgrowth and low inflation constitute Goldilocks economy, which is welcomed bythe Wall Street (we have analyzed the Goldilocks economy in the Juneedition of the Market Overview).
Chart 2: TheCPI annual rate (red line, left axis, in %) and the S&P 500 Index (greenline, right axis) from July 2009 to May 2019. 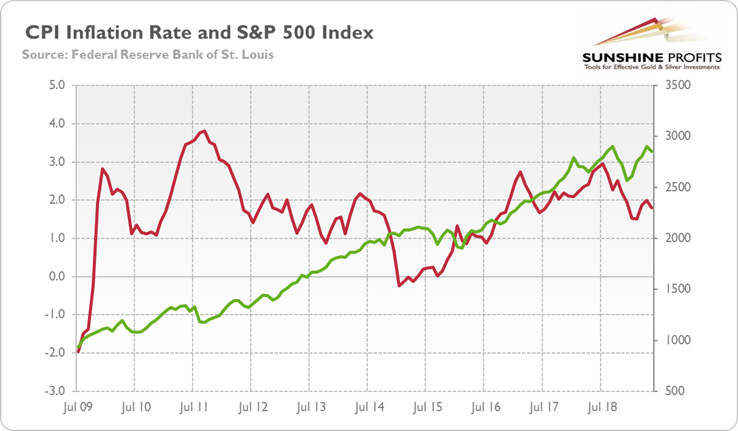
Last but not least, retail sales rebounded in May, while industrial production remains solid (see the June 18 edition of the Gold News Monitor). As we have examined in the March edition of the Market Overview, most of the recessionary indicators do not fleshred. Hence, we remain rather optimistic about the outlook for U.S. economy. Nodoubt that it appears in a much better shape than Japan or the Eurozone. Buteven according to the absolute criteria, there is no immediate danger on thehorizon.
Doesit mean that we do not see any threats? Of course not! There are three mainrisks. First, the inversion of the yield curve. Although the yield curve could indeed lose someof its predictive power, this is something what the pundits used to say before eachfinancial crisis. “This time is different”, they announced recklessly just tobe surprised by the good old crash. Therefore, we take the recent inversion of the yield curve seriously, but we arefar from panicking.
Why?It is because we do not see acorresponding tightening in credit conditions. Historically, the yieldcurve inverted because of the liquidity shortage. That happens when theindebted entrepreneurs begin to sustain losses and turn so desperate for a loan to finish theirinvestment projects that they are willing to pay more for a short-term loansthan for a long-term obligation. However, as the chart below shows, the creditconditions remain easy (the red line on the chart below stays below zero, whichindicates looser than average credit conditions), so the recent inversion of the yield curve does not necessarily signal theupcoming recession, at least not yet. But the yield curve-related riskshave clearly increased recently, so keeping an eye out for this indicator iscertainly worthwhile.
Chart3: Yield curve (green line, right axis, spread between 10-year and 3-monthTreasuries, in %) and the Chicago Fed National Financial Conditions CreditSubindex (red line, left axis, index) from January 1982 to May 2019.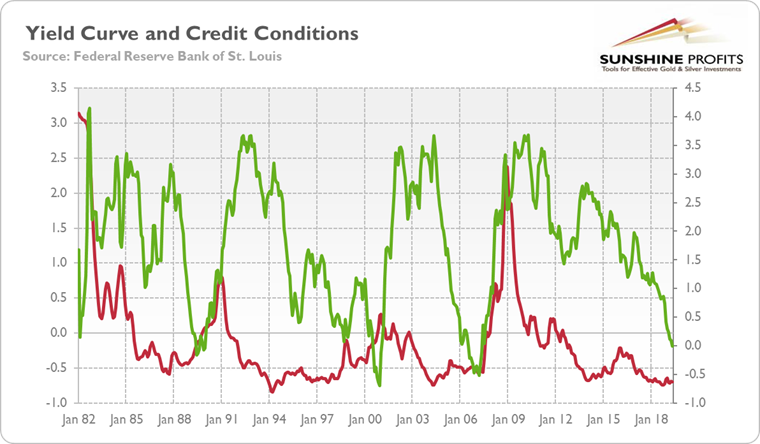
Second, trade wars. We still believe that Trump and Xi willeventually reach a deal, especially that they announced trade truce in June.Should they fail to do that, new tariffs and other protectionist measures couldsignificantly disrupt the global supply chains, affecting negatively thecorporate profits and the whole economy.
And,third, debt. The scale of privateand public debt is dangerously outrageous, in many cases even higher thanbefore the Great Recession.Total public and privatedebt in many countries is above 320 percent of GDP, according to the IMF. It goes without saying that the debt-driven economic expansion is not sustainable. At current interest rates, the debt seems to be cheap and worth of loadingon balance sheet. However, the low bond yields do not reflect low risk in general, but ratherfinancial repression. When the central banks normalize their monetary policy, the mirage of low yields will disappear.
What does our overview implyfor the gold market? The U.S. economic picture is better than many people think. While it’s notperfect, it’s not as bad as widely believed. It suggests that the economy hasstill some room to run. Bad news for the gold bulls, we know. The consensus is that America is headedfor a recession by the end of 2020. We are not yet convinced. There will be a growthslowdown, that’s very likely, given that the effect of fiscal stimulus willwane, but a downturn is another kettle of fish.
However,the economic slowdown combined with the fears of recession might be enough toincrease the safe-haven demand for gold.Many people buy the yellow metal when the economy is already in the recession,but smart money flows into the precious metal sector in advance.
If you enjoyed the above analysis and would you like to knowmore about the gold ETFs and their impact on gold price, we invite you to readthe April MarketOverview report. If you're interested in the detailed price analysis andprice projections with targets, we invite you to sign up for our Gold & SilverTrading Alerts . If you're not ready to subscribe at this time, we inviteyou to sign up for our goldnewsletter and stay up-to-date with our latest free articles. It's freeand you can unsubscribe anytime.
Arkadiusz Sieron
Sunshine Profits‘ MarketOverview Editor
Disclaimer
All essays, research and information found aboverepresent analyses and opinions of Przemyslaw Radomski, CFA and SunshineProfits' associates only. As such, it may prove wrong and be a subject tochange without notice. Opinions and analyses were based on data available toauthors of respective essays at the time of writing. Although the informationprovided above is based on careful research and sources that are believed to beaccurate, Przemyslaw Radomski, CFA and his associates do not guarantee theaccuracy or thoroughness of the data or information reported. The opinionspublished above are neither an offer nor a recommendation to purchase or sell anysecurities. Mr. Radomski is not a Registered Securities Advisor. By readingPrzemyslaw Radomski's, CFA reports you fully agree that he will not be heldresponsible or liable for any decisions you make regarding any informationprovided in these reports. Investing, trading and speculation in any financialmarkets may involve high risk of loss. Przemyslaw Radomski, CFA, SunshineProfits' employees and affiliates as well as members of their families may havea short or long position in any securities, including those mentioned in any ofthe reports or essays, and may make additional purchases and/or sales of thosesecurities without notice.
Arkadiusz Sieron Archive |
© 2005-2019 http://www.MarketOracle.co.uk - The Market Oracle is a FREE Daily Financial Markets Analysis & Forecasting online publication.