Platinum Price Technical Chart Analysis 22nd June 2018 / Commodities / Platinum

 LatestPrice – $873.30
Pattern – a downtrend has clearly been in force…one that Ibelieve ended today with a low at $857.60. And a bullish outside reversalcandle to go with it. This will obviously need follow through to the upsidewhile there may be some consolidation of this candle in the very immediateterm.
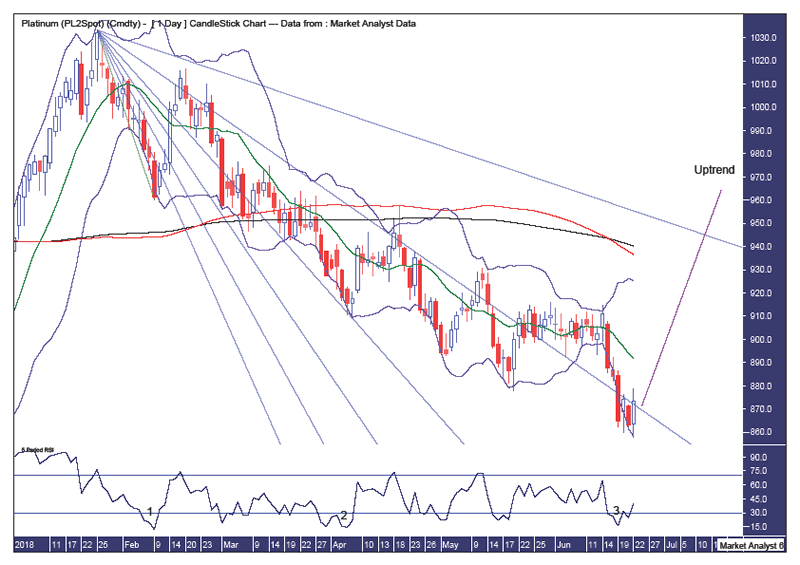
BollingerBands – price looks like it may be about to leave the lower band but it hasn’tyet. A clear break higher will likely confirm the low.
Fibonacci– price has been trending down generally between the 61.8% and 76.4% angles.Each consecutive low has been inching closer the 76.4% angle as the downtrendhas played out. If I am correct in thinking today was the low then price shouldfinally overcome this 76.4% angle and move up to the 88.6% angle where someresistance may come in before racking above there too.
Movingaverages – a bearish crossover has just occurred but this is also the exactmoment where price rallies, if only a bear rally which I think this will be.
RSI– a triple bullish divergence has formed at this price low which is often seebefore a solid rise.
MonthlyChart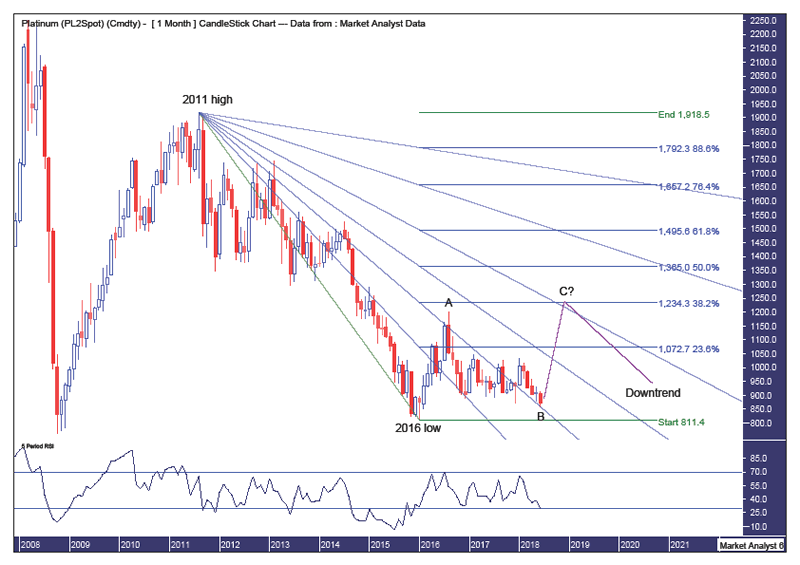
Pattern – we can see the 2016 low was a test of the previouslow which occurred during the 2008 commodities bust. While I believe price willeventually trade below that 2008 low I believe that time is not yet. Instead, Ifavour am ABC correction is in process with today the wave B low with priceabout to embark on a rally that ends in a wave C high. I favour this wave Chigh to only marginally clip the wave A high of $1199.
Fibonacci– the wave A high was around resistance from the 38.2% angle while thisexpected wave B low is at support from that same angle. If I am correct in arally commencing now then my target for the wave C high is the 61.8% angle.This angle coincides with the 38.2% retracement level of $1234 towards the endof 2018. This is some timing and price.
RSI– price is threatening to move into oversold territory but I doubt that willhappen and it won’t if price rallies now. The 2016 low saw a new low on thisindicator and I would like to see a bullish divergence form before the overalldowntrend is over. All in good time.
Summingup – I expect a solid rally now which has the potential to put on around 40%over a relatively short period of time.
By Austin Galt
Austin Galt has previously worked as a stockbroker and investment banker while studying technical analysis for over two decades. He is also the author of the book White Night: A Colombian Odyssey
Email - info@thevoodooanalyst.com
© 2018 Copyright The Voodoo Analyst - All Rights Reserved
Disclaimer: Theabove is a matter of opinion provided for general information purposes only andis not intended as investment advice. Information and analysis above arederived from sources and utilising methods believed to be reliable, but wecannot accept responsibility for any losses you may incur as a result of thisanalysis. Individuals should consult with their personal financial advisors.
Austin Galt Archive |
© 2005-2018 http://www.MarketOracle.co.uk - The Market Oracle is a FREE Daily Financial Markets Analysis & Forecasting online publication.