Is Gold Price Action Warning Of Imminent Monetary Collapse - Part 2? / Commodities / Gold & Silver 2020

The following is an update of a previousarticle: During the 2008 financial crisis the Fedsignificantly increased the US monetary base to keep the system from collapse.They are currently in a similar situation, and have done (is doing) the exactsame thing.
Here is a chart of the US monetary base toillustrate the similarity:
With the 2008 actions they were able to avoidthe collapse until now. Will the current actions yield the same results, orwill we see a completely different outcome?
One thing to look at for this answer is Gold(probably one of the most important things).
So, when the Fed increased the monetary baseof the US significantly in 2008, it took Gold prices quite a long time to showprice increases to catch up with the monetary base. Then, the Fed doubled themonetary base in a period of about four months. However, from around the sametime the Gold price took almost three years to double, thereby only catching upvery late in the game.
Gold was not crying system collapse, andrightly so.
That shows that there was still a decentamount of faith and resource in the monetary system to be able to continue.
The current increase in the monetary baseonly just stopped short of doubling the monetary base in a period of about fourmonths. Below, is a chart of gold to see how gold reacted then and now:
At around the 2008 financial crisis (duringthe significant monetary base increase) gold fell to a low of about 34% belowthe then all-time high. After about 4 months gold increased about 47% from thatlow, but did not make a new all-time high.
The new all-time high only came about 13months after the low of the crisis.
During the current crisis ( after thesignificant monetary base increase) gold fell to a low of a about 25% below theall-time high. It is also important to note that the fall to the low was percentagewise much lower than that of the 2008 crisis (indicating gold being much moreresilient this time).
After about 4 months from the low, goldincreased about 36%, which is lower than the 2008 increase. However, it didmake a new-all time high this time (also there are still a few days left inthis month).
Here is a chart that tracks the Gold pricerelative to the US monetary base (Gold price/US monetary base in millions):
Point 4 in 2008 is where the Fed increasedthe monetary base significantly. The eventual massive decline to lower thanpoint 1, shows that the Gold price did not keep up with the US monetary base.
So, although Gold was going up during thatsame period, it was not warning of system collapse. There were two otherperiods in history that similar situations occurred, but gold actually waswarning of a system collapse (or system bank run, if you will)
Those times were in 1933 and 1971, and youcan read more about those (and the above chart) here.Both of those occasions resulted in a system reset.
In the chart above, there are two patternsmarked out (1 to 4). The current pattern appears to follow the earlier pattern.If the similarity continues, then there is a good chance that the outcome ofthe current crisis will be like the 2008 one.
If there happens to be divergence from theearlier pattern, and Gold outruns the monetary base increase (by the chartgoing higher than point 4 over the coming months), then we are likely to see aradically different (and worse) outcometo the 2008 financial crisis.
Since the previous update, it appears that adivergence could be developing. It still has not gone higher than point 4, to confirmthe divergence, but there are signs of it possibly happening over the comingmonths.
During the 2008 crisis, the ratio was unableto hold support just lower than point 2 (but higher than point 3). Currentlythe support at point 2 (but higher than point 3) appears to be holding, and wehave seen a nice turnaround since the low.
With a new stimulus package coming, but goldlooking very bullish, it will be interesting to see what will happen. To me itlooks like the ratio could rise above point 4 soon, signaling a huge monetary(banking) crisis.
Silver is another important reason why thecurrent financial crisis will be far worse than 2008. This silver chart iswarning of a late 70s rally rather than a 2008 to 2011 kind of rally:
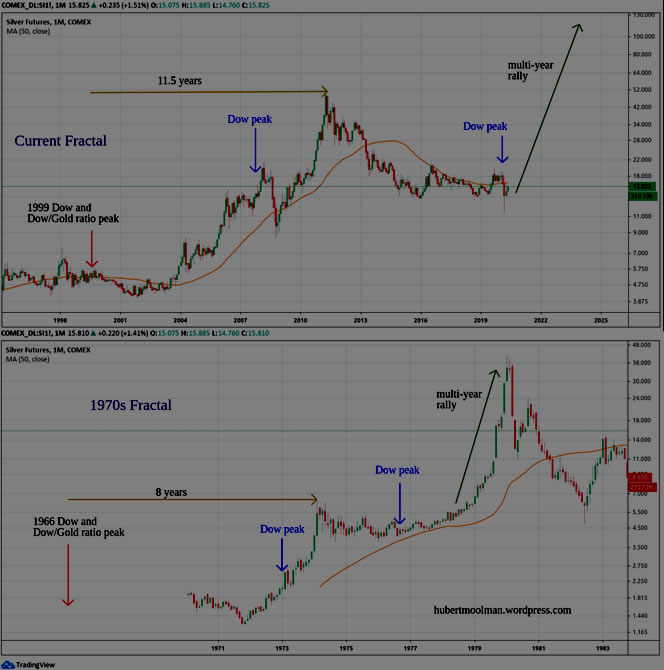
For more on this, andsimilar analysis you are welcome to subscribe to my premium service. Ihave also recently completed a Silver Fractal Analysis Report as well as a Gold Fractal Analysis Report.
Warm regards,
Hubert
“And it shall come to pass, that whosoevershall call on the name of the Lord shall be saved”
http://hubertmoolman.wordpress.com/
You can email any comments to hubert@hgmandassociates.co.za
© 2020 Copyright Hubert Moolman - All Rights Reserved
Disclaimer: The above is a matter of opinion provided for general information purposes only and is not intended as investment advice. Information and analysis above are derived from sources and utilising methods believed to be reliable, but we cannot accept responsibility for any losses you may incur as a result of this analysis. Individuals should consult with their personal financial advisors.
© 2005-2019 http://www.MarketOracle.co.uk - The Market Oracle is a FREE Daily Financial Markets Analysis & Forecasting online publication.