Gold Weekly: What's Behind The Recent Rebound?
Gold finds some support from renewed weakness in US real rates.
Net long positions in Comex gold continue to be trimmed, the CFTC shows.
ETF investors cut their gold holdings in spite of rising risk aversion, FastMarkets shows.
Expect modest buying pressure in gold in near term.
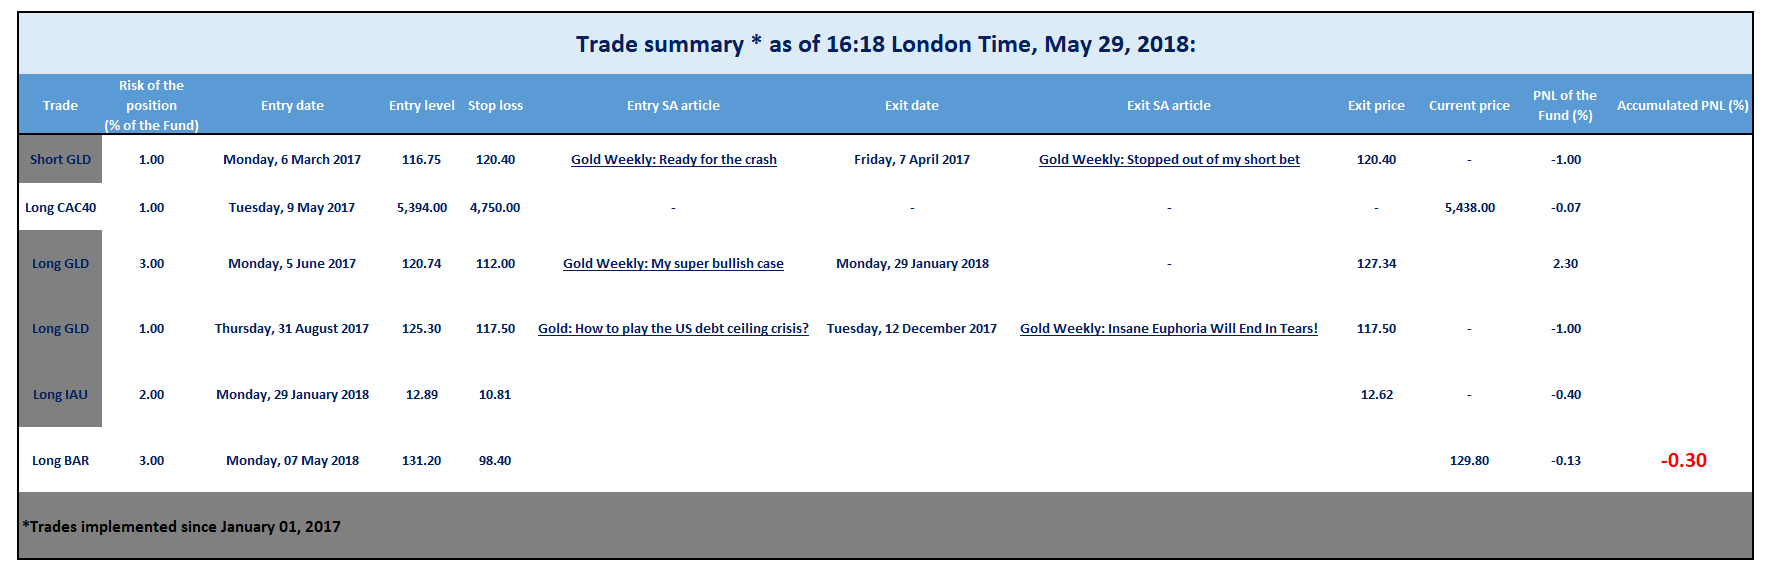
I am a long BAR, with a very long-term approach.

Source: Pinterest.
Introduction
Welcome to my Gold Weekly.
In this report, I wish to discuss mainly my views about the gold market through the GraniteShares Gold Trust ETF (NYSEARCA: BAR).
To do so, I analyse the recent changes in speculative positions on the Comex (based on the CFTC) and ETF holdings (based on FastMarkets' estimates) in a bid to draw some interpretations about investor and speculator behavior. Then I discuss my global macro view and the implications for monetary demand for gold. I conclude the report by sharing my trading positioning.
While the CFTC statistics are public and free, the data about gold ETF holdings are from FastMarkets, an independent metals agency which tracks ETF holdings across the precious metals complex.
Speculative positioning
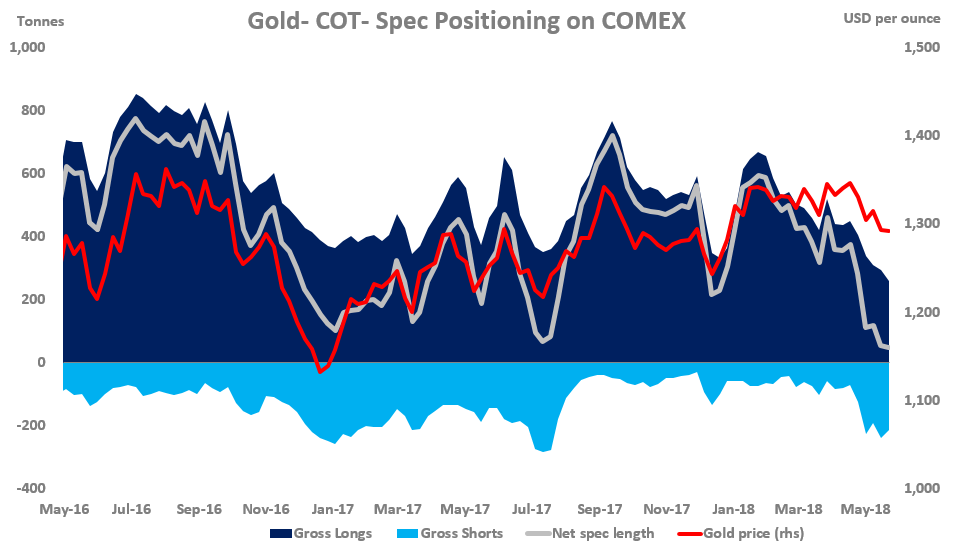
Source: CFTC
According to the latest Commitment of Traders report (COTR) provided by the CFTC, money managers cut slightly their net long positions (for a 4th time over the past 5 weeks) over the reporting period (May 15-22), during which time spot gold prices were unchanged at $1,292 per oz.
The net long fund position - at 46.86 tonnes as of May 22 - dropped 6.99 tonnes or 13% from the previous week (w/w). This was exclusively owing to long liquidation (-33.58 tonnes w/w) but largely offset by short-covering (-26.59 tonnes w/w).
The net long fund position in gold is down a massive 258.62 tonnes or 85% since the start of the year after an increase of 183 tonnes in 2017.
Gold's spec positioning is excessively light by historical standards. First, the net long fund position (46.86 tonnes) is at its lowest since January 19, 2016 (1.24 tonnes). Second, the net long fund position represents just 6% of its historical record (774.16 tonnes). Third, the net long fund position is 86% lower than its long-term historical average (~324 tonnes).
Accordingly, a normalization is warranted, which should be characterized by an initial phase of short-covering, followed by a return of fresh buying.
The resulting increase in the net long fund position in Comex gold is likely to propel prices much higher. This may happen later this year.
Bottom line: gold's spec positioning is bullish.
Investment positioning
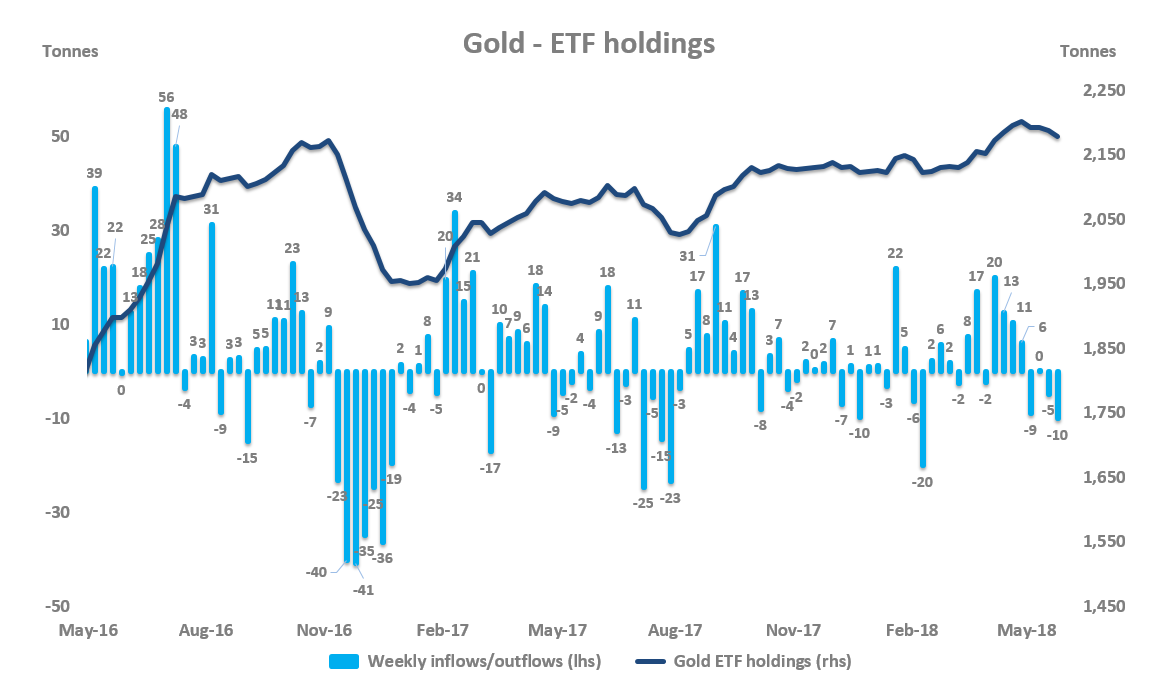
Source: FastMarkets
ETF investors sold about 10 tonnes of gold last week, the largest weekly outflow since February. Gold prices strengthened 0.9% from $1,292 per oz to $1,302 over the period.
In spite of a return to risk-aversion, ETF investors were not inclined to boost their haven demand.
ETF outflows were concentrated on Monday 21 May (-3.21 tonnes) and Friday May 25 (-4.53 tonnes).
Gold ETF outflows stemmed primarily from the SPDR GLD (-6.78 tonnes).
ETF investors are net sellers of 22 tonnes of gold so far in May, which corresponds to the largest pace of selling since July 2017 (~69 tonnes). This comes after an increase of 48 tonnes in gold ETF holdings in April, the largest monthly increase since September 2017 (+61 tonnes).
In the year to date, ETF investors remain net buyers of ~55 tonnes, corresponding to an increase of 2.6% in gold ETF holdings.
As of May 25, 2018, gold ETF holdings totaled 2,178 tonnes, up 102 tonnes or 5% y/y.
As a reminder, gold ETF investors were net buyers of 173.38 tonnes in 2017 (+9% from 2016) and 472.44 tonnes in 2016 (+32% from 2015).
Macro backdrop for gold
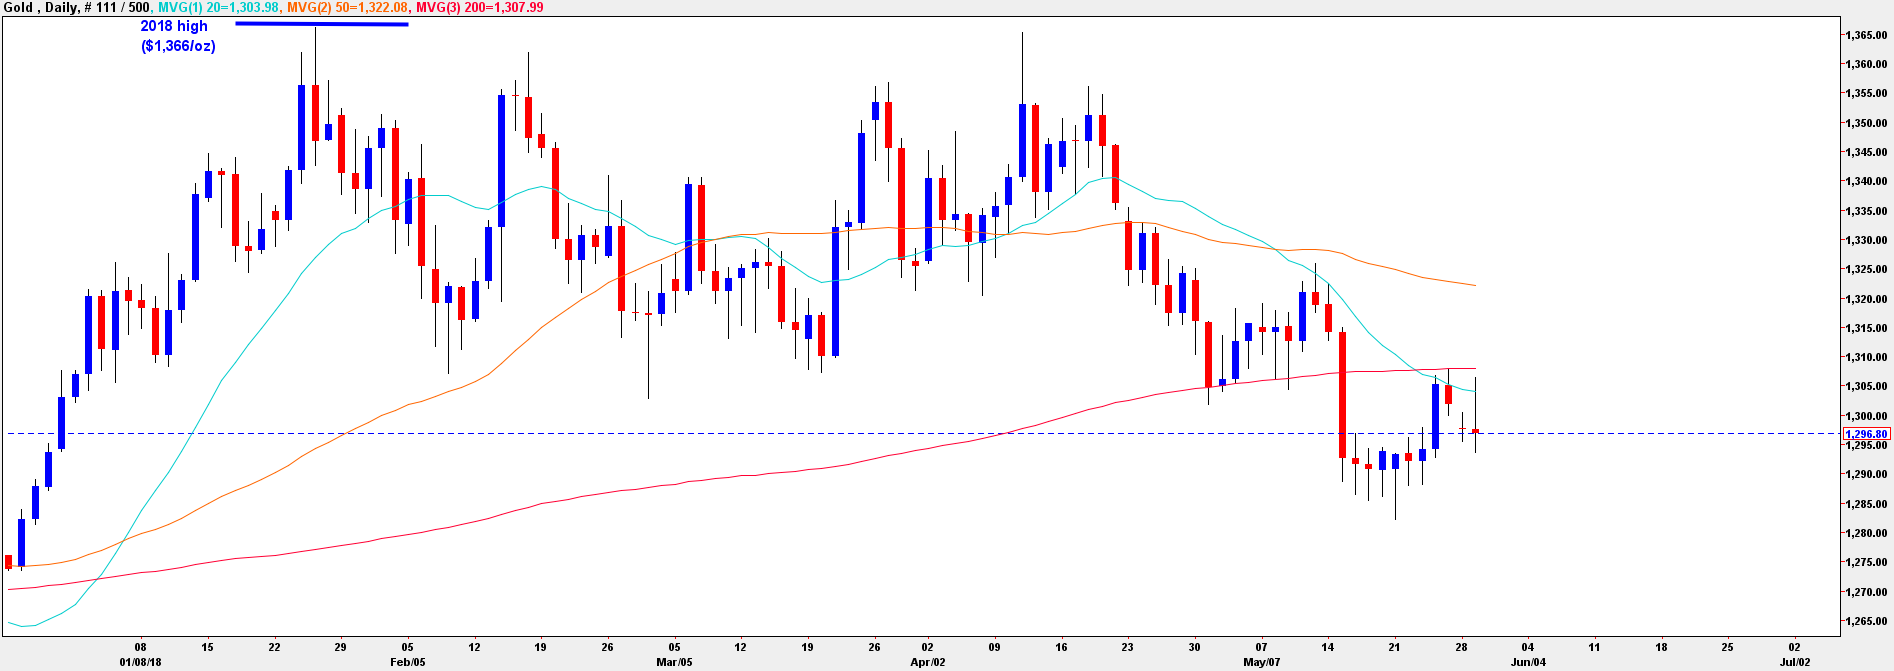
Source: Net Dania
Gold prices have stabilized somewhat since reaching a low of $1,282 per oz on May 21. Judging by the fall in open interest, we attribute the recent strength in Comex gold to short-covering. It seems to me that the bout of short-covering has been driven by a sudden fall in US real rates, proxied by the 10Y US TIPS yield.
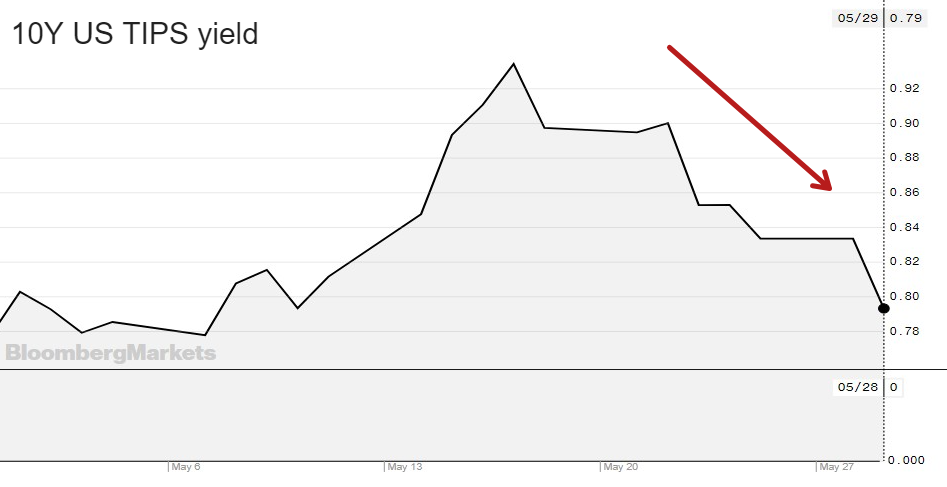
Source: Bloomberg
But the rebound in gold prices has been capped by the continued dollar strength, proxied by the DXY.
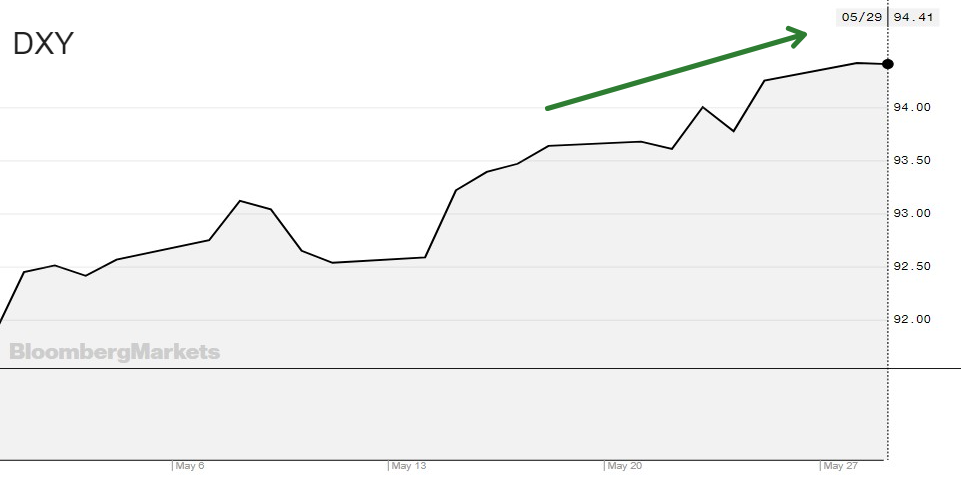
Source: Bloomberg
The sharp appreciation in the dollar has been fueled by short-covering, which has been triggered by growing investor fears over EM economies. In turn, the strengthening of the dollar has further undermined the financial stability of the EM world, generating a self-reinforcing process (stronger dollar --> weaker EM --> stronger dollar). The dollar is now at its highest since July 2017. In the near term, further strength cannot be ruled out due to (1) rising political risks both in EM economies and the EU, especially in Italy and Spain, and (2) a still excessively bearish spec positioning on the DXY.
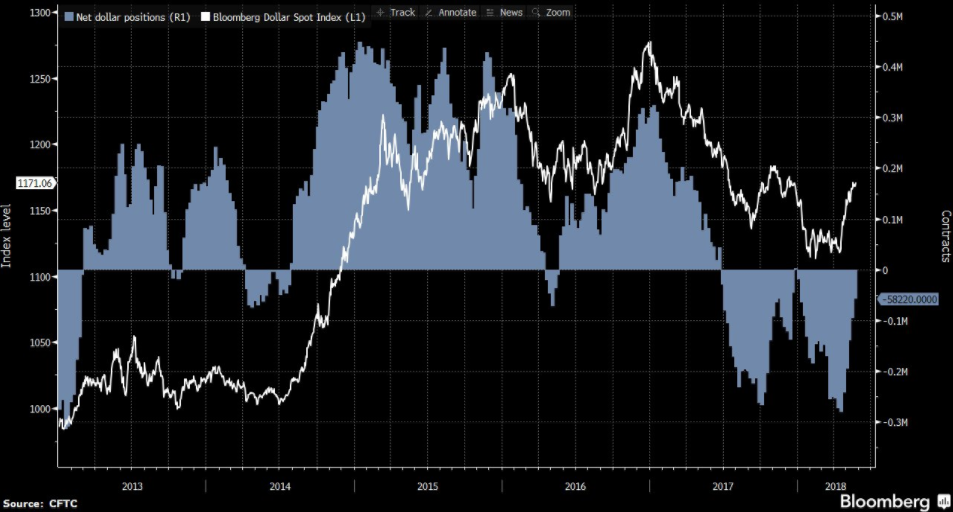
Source: Bloomberg
Against this backdrop, I am mildly bullish on short-term outlook for gold prices but I remain fairly bullish for the second half of 2018 and beyond.
Trading positioning
I have a long position in the GraniteShares Gold Trust ETF (NYSEARCA: BAR). I prefer BAR over GLD or IAU due to its relatively lower cost (measured by the expense ratio), notwithstanding its poorer liquidity conditions.
Since (1) I do not expect to trade this ETF on a daily basis and (2) I have a long-term approach to my gold trading, I am comfortable with keeping this position in BAR.
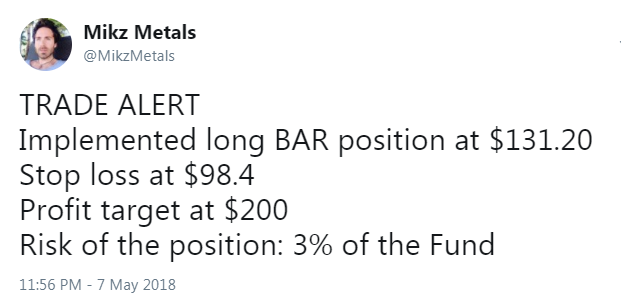
My Tweet below sumps up the new parameters of my trade.
What's the BAR technical picture telling us (weekly chart)?
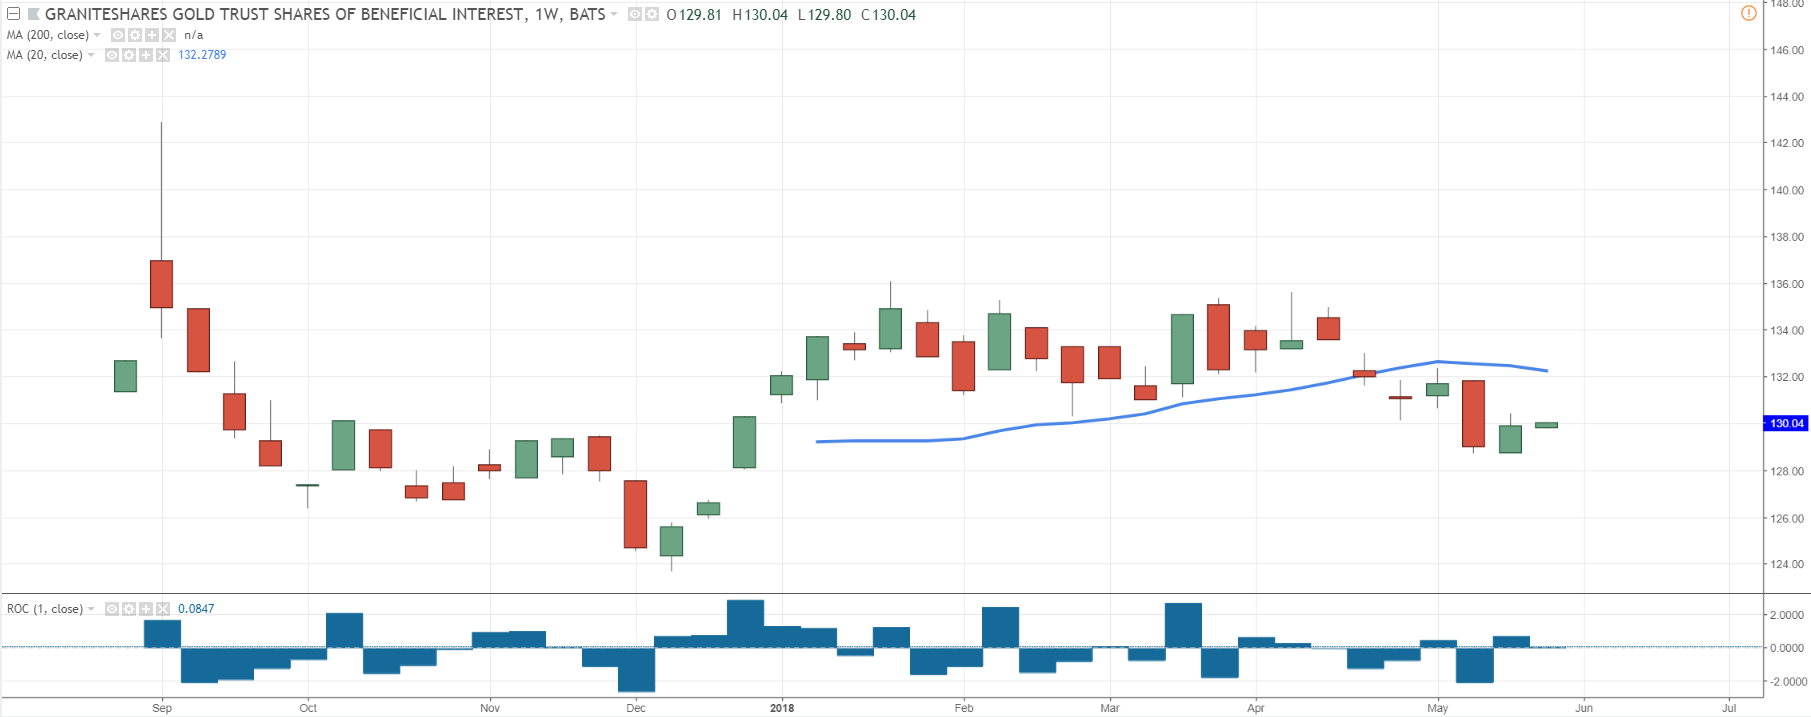
Source: Trading View
BAR rebounded modestly last week after a strong sell-off in the prior week. Despite the recent pick-up in BAR, the technical picture remains unhealthy over the near term.
The key support at $130 has been breached and momentum-based indicators are in negative territory. This could suggest more selling pressure toward the 2017 low of $124.
Although I expect higher prices for BAR over the second half of 2018 and beyond, I am not inclined to buy the dips yet, principally because the recent consolidation may not be completely over.
The risk of my bullish bet on gold (via BAR) is ~3% of my Fund. I could lift this position up to 5% of my Fund.
For the sake of transparency, I will update my trading activity on my Twitter account and post my trade summary at the end of each report.
Final note
My dear friends, thank so much for showing your support by clicking the "Follow" orange button beside my name on the top of the page and sharing/liking this article. I look forward to reading your comments below.
![]()
Disclosure: I am/we are long BAR.
I wrote this article myself, and it expresses my own opinions. I am not receiving compensation for it (other than from Seeking Alpha). I have no business relationship with any company whose stock is mentioned in this article.
Follow Boris Mikanikrezai and get email alerts