Gold Weekly: The Market Plays With Bulls' Nerves
Gold is selling off on stronger dollar, higher US real rates.
Speculators lifted their net long positions for the 1st time in 3 weeks over April 10-17, the CFTC shows.
ETF investors keep buying gold at a steady pace, FastMarkets estimate.
What's driving the negative macro environment for gold?
Although some bulls may lose patience, I am not worried by the noise of the market. I stay long IAU, expecting a powerful rally this year.

Source: PictureQuotes.
Introduction
Welcome to my Gold Weekly.
In this report, I wish to discuss mainly my views about the gold market through the iShares Gold Trust (NYSEARCA:IAU).
To do so, I analyze the recent changes in speculative positions on the Comex (based on the CFTC) and ETF holdings (based on FastMarkets' estimates) in a bid to draw some interpretations about investor and speculator behavior. Then I discuss my global macro view and the implications for monetary demand for gold. I conclude the report by sharing my trading positioning.
While the CFTC statistics are public and free, the data about gold ETF holdings are from FastMarkets, an independent metals agency which tracks ETF holdings across the precious metals complex.
Speculative positioning
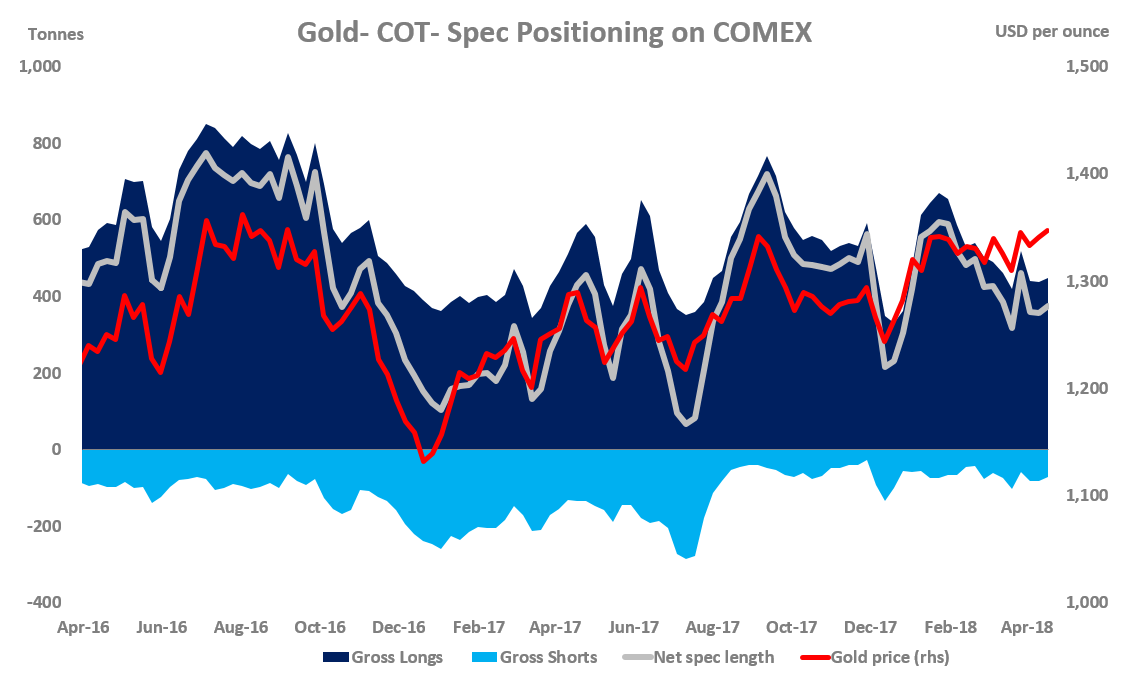
Source: CFTC.
According to the latest Commitment of Traders report (COTR) provided by the CFTC, money managers lifted their net long positions for the first time in 3 weeks over the reporting period (April 10-17), during which spot gold prices edged 0.5% higher from $1,330 per oz. to $1,347.
The net long fund position - at 376.02 tons as of April 17 - rose 20.06 tons or 6% from the previous week (w/w). This was driven by a combination of long accumulation (+11.00 tons w/w) and short-covering (-9.06 tons w/w).
Gold's net long fund position is up 70.53 tons or 23% in the year to date, after surging by 182.55 tons or 149% in the whole of 2017.
Gold's spec positioning is fairly neutral. The net spec length is at 49% of its historical record and only 16% higher than its historical average of ~325 tons.
There is not a clearly bullish sentiment on gold among the speculative community - the level of gross longs is still far below its last year- and 2016- level. That said, gold prices are close to their 2016-17 highs.
So once bullish sentiment toward gold resumes, gold prices may push much higher, producing a breakout to the upside. Stay patient.
Investment positioning
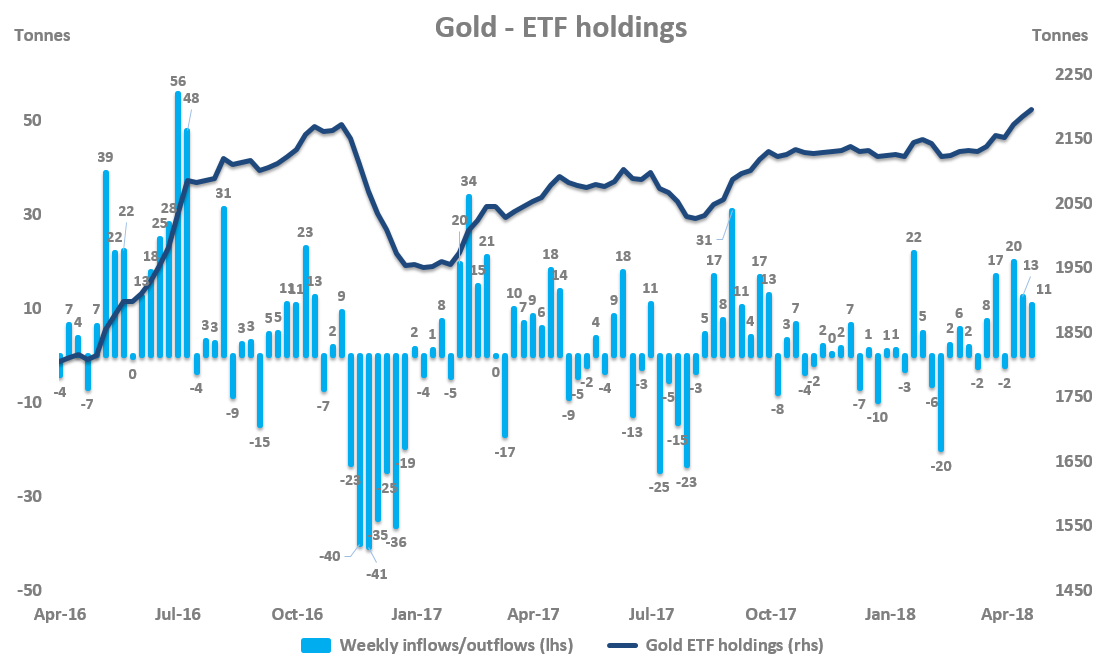
Source: FastMarkets.
ETF investors were net buyers of ~11 tons of gold last week, during which spot gold prices edged 0.1% lower from $1,338 per oz. to $1,336.
This marked the third weekly consecutive increase in gold ETF holdings.
The largest daily inflow into gold ETFs was observed on Friday 20 April (+4.11 tons). No daily outflow was noticed over the reporting period.
Gold ETF inflows were concentrated in the SPDR GLD ETF (+5.2 tons) and the Invesco Physical Gold ETC (+4.17 tons).
ETF investors are net buyers of ~33 tons so far in April, which corresponds to the largest pace of monthly buying so far since September 2017 (+61 tons).
In the year to date, ETF investors are net buyers of ~72 tons, corresponding to an increase of 3.4% in total gold ETF holdings.
As of April 20, 2018, gold ETF holdings totaled 2,195 tons, up 110 tons or 5.3% y/y.
As a reminder, gold ETF investors were net buyers of 173.38 tons in 2017 (+9% from 2016) and 472.44 tons in 2016 (+32% from 2015).
Macro backdrop for gold
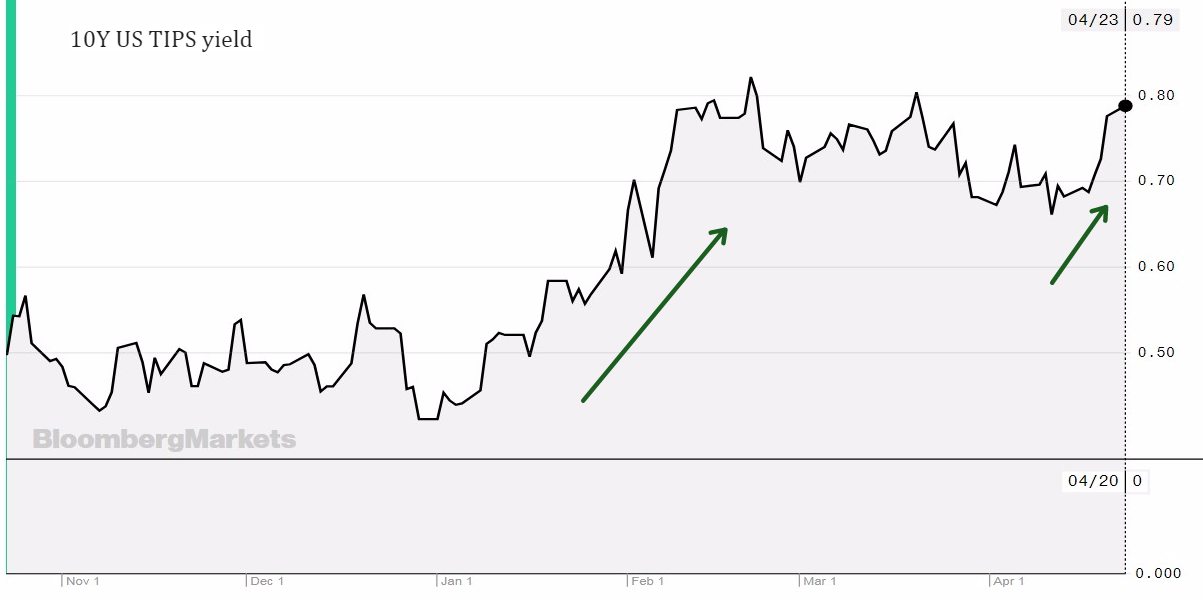
The macro environment for gold has turned unfriendly since mid-April, judging by the sharp appreciation in the dollar - proxied by the DXY - and US real rates - proxied by the 10Y US TIPS yield. The charts below, in addition to frustrating gold bulls, illustrate my point.
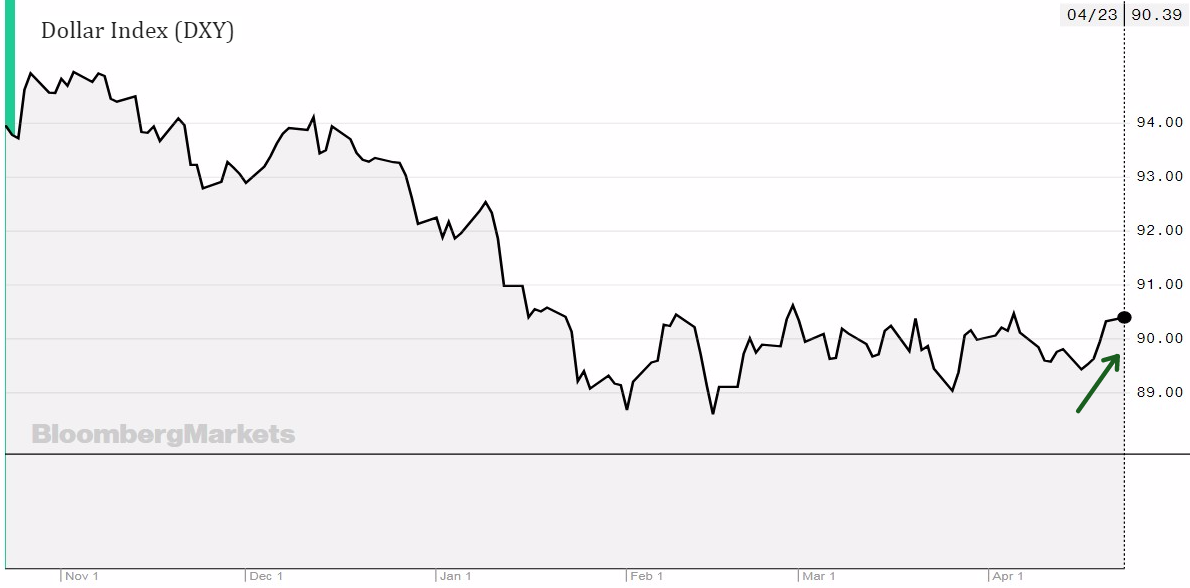
Source: Bloomberg.
As can be seen above, both the dollar and US real rates are at the upper end of their respective trading ranges.
The main driver behind the stronger dollar and firmer US real rates is the surge in US nominal rates - the 10Y US nominal yield touched the critical 3% level at the start of the week, its highest since 2014.
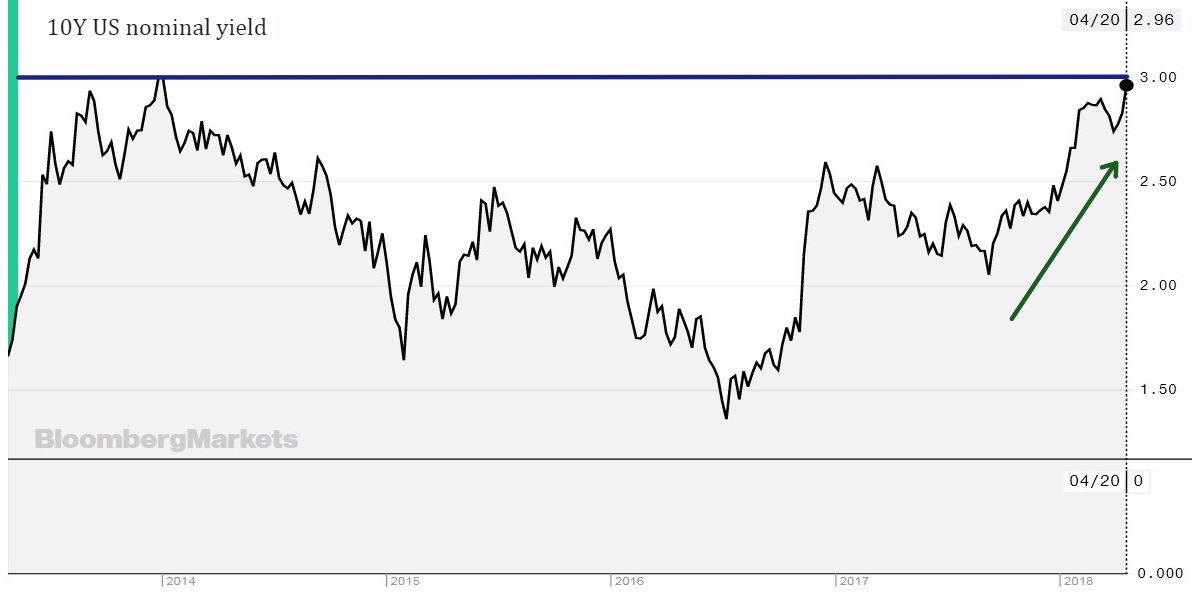
Source: Bloomberg.
The sell-off in the US bond market reflects positive factors, most notably stronger global growth expectations in the US on the back of easing geopolitical tensions and trade-war fears. Against this backdrop, investors are inclined to favor risk assets (like equities) at the expense for risk-free assets (like US government bonds).
That said, it is important to understand that a too aggressive rise in US bond yields could hurt eventually equities and global risk-taking appetite. As Deutsche Bank reminds us, "history has shown that stock markets perform positively when only a modestly rising interest-rate environment is expected" (more details here).
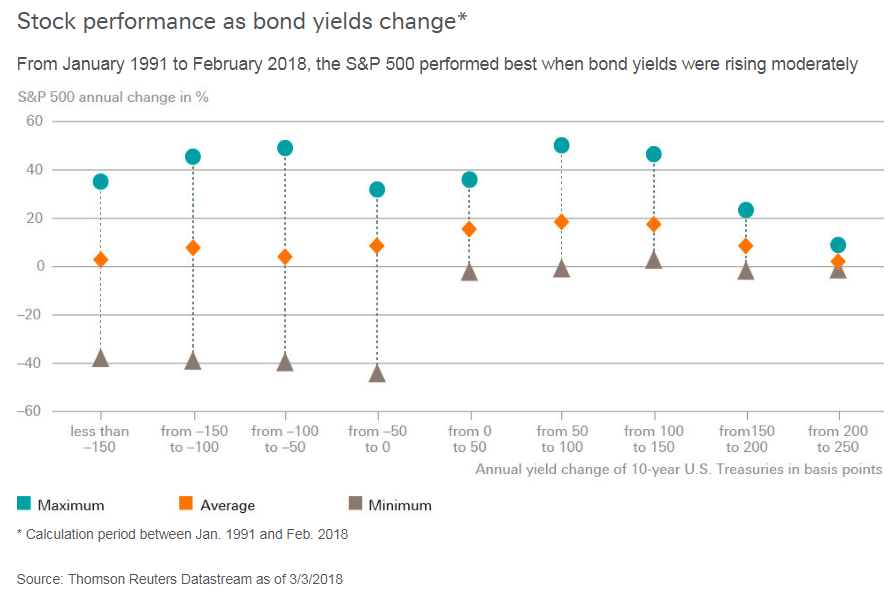
Source: Deutsche Bank.
Will this negative macro backdrop for gold (i.e., stronger dollar and higher US real rates) be sustainable?
In a nutshell, I don't think so. My view is based on the premise that the Fed will continue its gradual approach toward the removal of policy accommodation. On the one hand, the Fed does not want to stall the economy. On the other, the current level of the Fed funds rate (1.50%-1.75%) is getting closer to the natural rate (i.e., the inflation-adjusted, short-term interest rate, that is consistent with full use of economic resources and steady inflation near the Fed's target level) of ~3%. This may prompt the Fed to maintain a gradual pace of rate hikes in the coming quarters.
The cautious approach by the Fed should cap the dollar and US real rates, leaving the macro backdrop neutral to positive for gold in the months ahead. As a result, I expect the uptrend in gold prices to remain intact.
Trading positioning
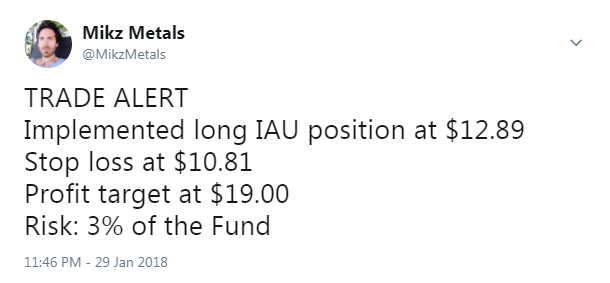
To express my constructive view on gold, I have a long position in IAU. Due to the long-term horizon of my investment (at least one year), I prefer IAU over GLD due to the relatively lower expensive ratio of the former vs the latter.
My Tweet below sumps up the parameters of my current trade.
What's the IAU technical picture telling us?
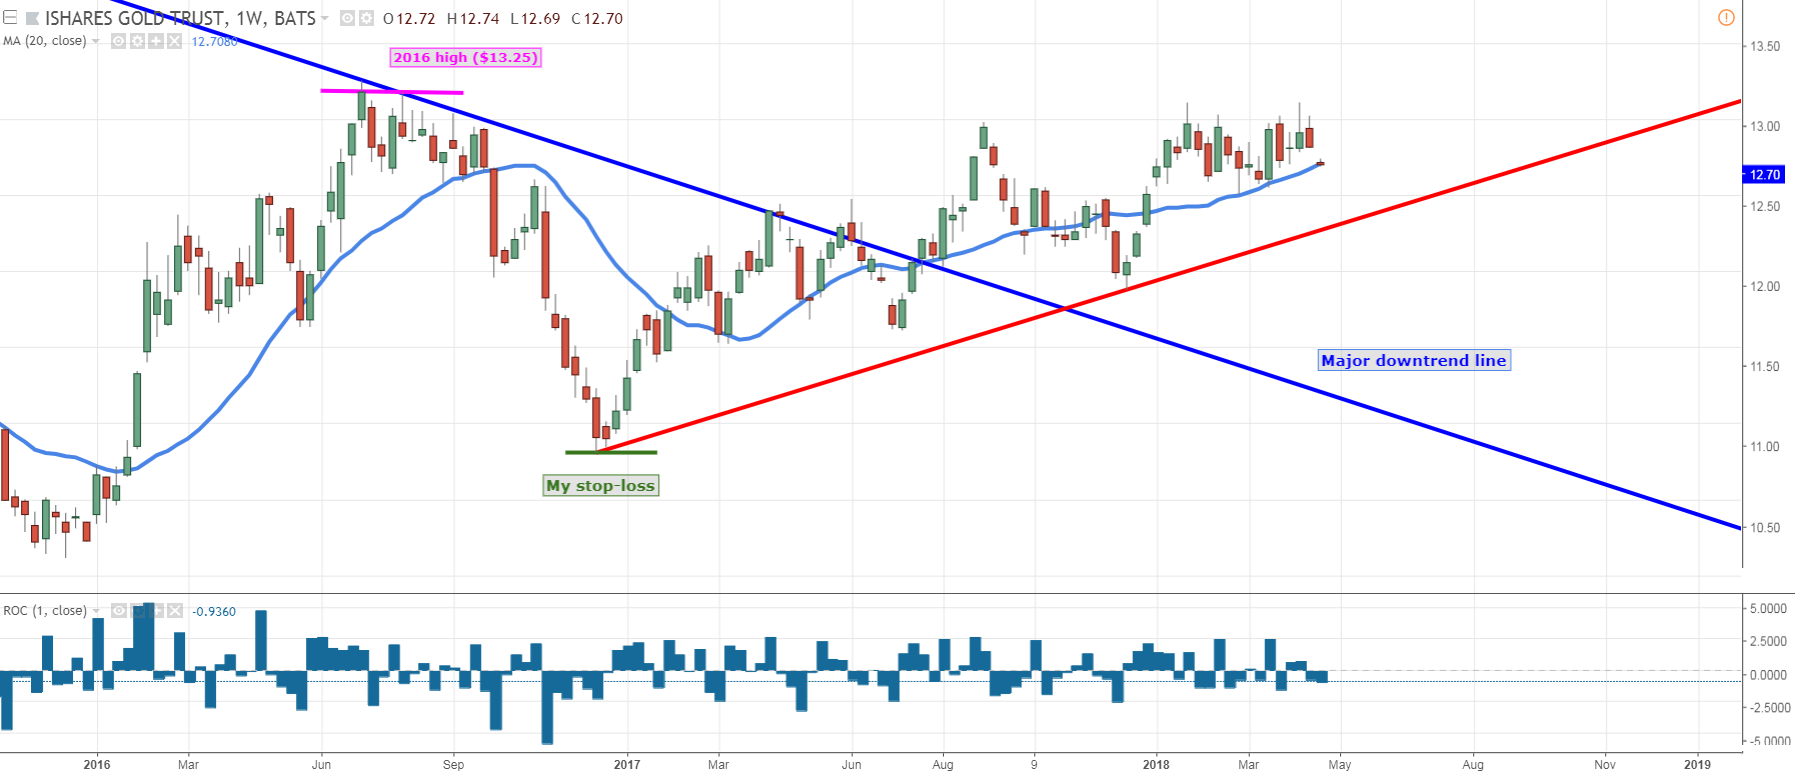
Source: Trading View.
IAU is off to a poor start to the week, retesting its 20 weekly moving average (WMA) after being unable to firmly break above the key resistance of $13.
But as I warned in previous reports, the $13 mark constitutes a heavy resistance and as such, IAU is likely to retest this level several times before sustainably breaking out to the upside.
What are the support levels to watch? A weekly close below the 20 WMA would suggest a negative swing in sentiment against IAU and therefore, result in further downward pressure toward the uptrend line from the 2016 low (red line) at ~12.20. Should this uptrend line fail to act as a support in the coming weeks, the outlook would turn materially negative for gold over the short term, with a likely retest of the downtrend line from the all-time high (blue line) at $11.20.
Although my stop-loss level is at $10.81, I contend that a weekly close below the uptrend line from the 2016 low would make me uncomfortable and induce me to reduce slightly my long position in IAU in a bid to rebuild it later at a (hopefully) more attractive price.
For now, I leave my base-case scenario unchanged, that is, a fresh 2018 high in the course of Q2 and a powerful rally in the course of 2018.
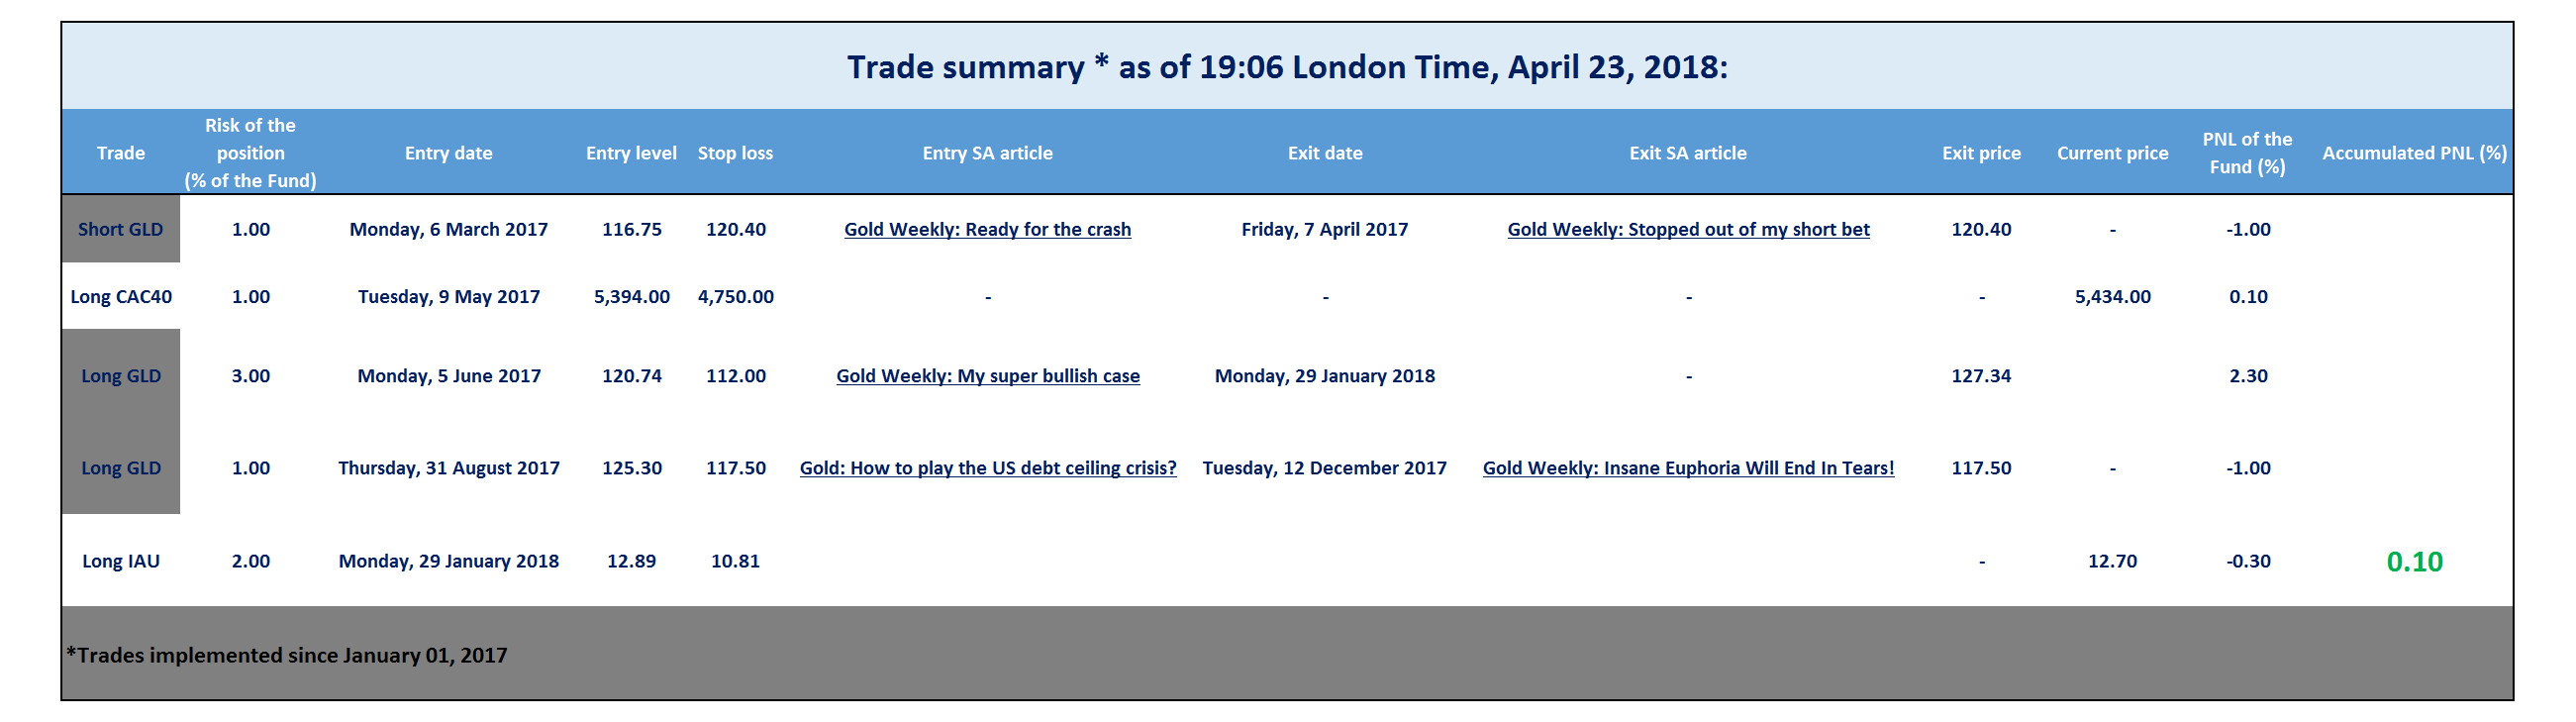
For the sake of transparency, I will update my trading activity on my Twitter account and post my trade summary at the end of each report.
Final note
My dear friends, thank so much for showing your support by clicking the "Follow" orange button beside my name on the top of the page and sharing/liking this article. I look forward to reading your comments below.
![]()
Disclosure: I am/we are long IAU.
I wrote this article myself, and it expresses my own opinions. I am not receiving compensation for it (other than from Seeking Alpha). I have no business relationship with any company whose stock is mentioned in this article.
Follow Boris Mikanikrezai and get email alerts