Gold Technical Analysis: symmetrical triangular formation on short-term charts
• Has been oscillating between two converging trend-lines over the past three-weeks, forming a symmetrical triangle on 4-hourly chart and points to a consolidation phase before the next leg of a directional move. • The commodity's inability to register any meaningful recovery from multi-month lows and acceptance below the very important 200-day SMA qualifies the contracting wedge as a bearish continuation pattern. • The negative bias would only be confirmed after a decisive break below the pattern support, currently near the $1293 region, albeit a move beyond 200-day SMA would invalidate the bearish outlook.
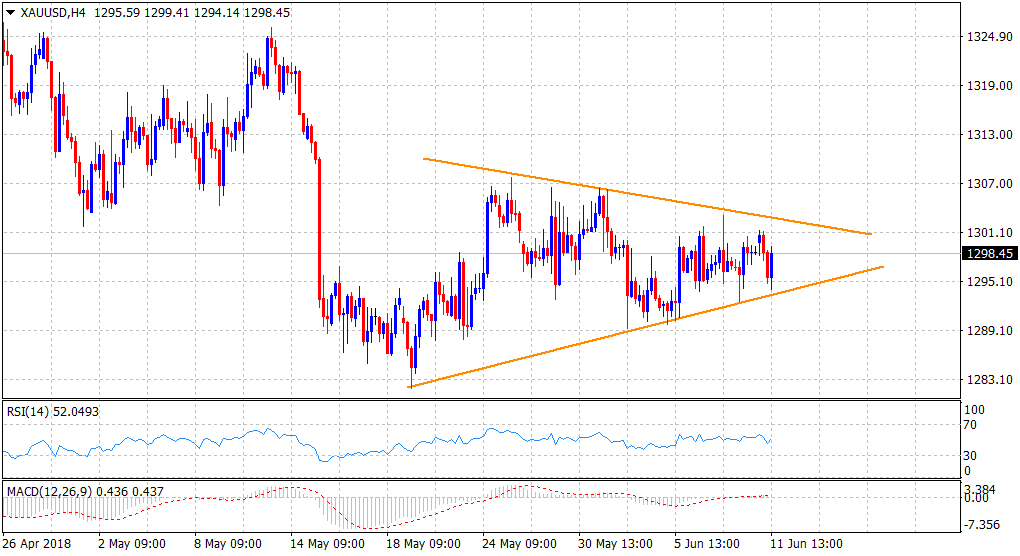
Spot Rate: $1298.45Daily High: $1301.30Daily Low: $1294.14Trend: Range-bound
ResistanceR1: $1303.50 (last Thursday's swing high)R2: 1306.05 (50-day SMA)R3: 1313.51 (200-day SMA)
SupportS1: $1294.14 (daily low touched during the European session)S2: $1289.65 (last Tuesday's swing low)S3: $1281.70 (multi-month lows set on May 21)
Information on these pages contains forward-looking statements that involve risks and uncertainties. Markets and instruments profiled on this page are for informational purposes only and should not in any way come across as a recommendation to buy or sell in these securities. You should do your own thorough research before making any investment decisions. FXStreet does not in any way guarantee that this information is free from mistakes, errors, or material misstatements. It also does not guarantee that this information is of a timely nature. Investing in Forex involves a great deal of risk, including the loss of all or a portion of your investment, as well as emotional distress. All risks, losses and costs associated with investing, including total loss of principal, are your responsibility.