Gold & Silver Detailed Trend Forecast 2020 and 2021 / Commodities / Gold & Silver 2020

This research article may get a bit technical, so please excuse us in advance if we ramble on about Measured Moves, Fibonacci Price Amplitude Arcs, and other technical jargon. Our goal is to share with you our expectations for Gold and Silver near the end of 2020 and out into early 2021.
ARCS, MEASURES & THE US DOLLAR
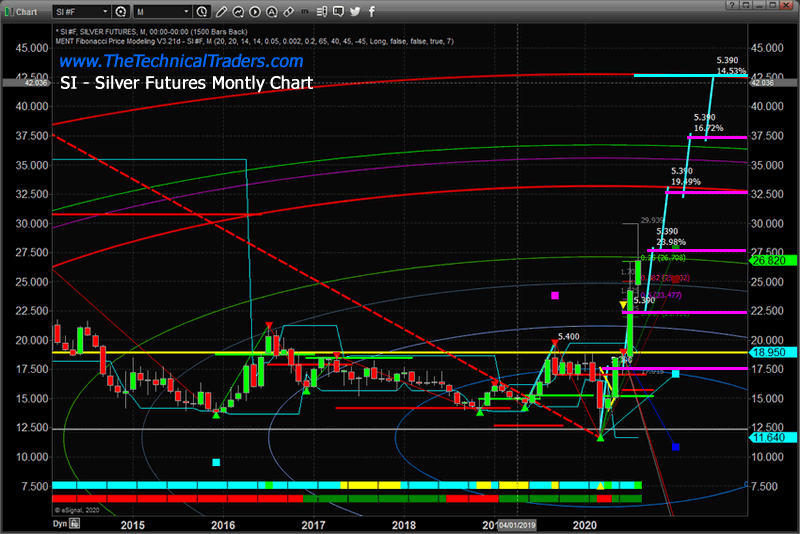
Our first observation to share with you today is the potential for the “Measured Price Moves” in Gold and Silver to continue. We’ve seen near-perfect price advances over the past 8+ months relating to these Measured Moves. In Gold, the Measured Move equates to about $263.20. In Silver, the measured move equated to about $5.40.
Recently, both Gold and Silver rallied beyond the projected Measured Move level, for Gold the level was $1,945 and for Silver the level was $27.50. The extreme breakout in Gold and Silver pushed prices well above these levels and into extreme overbought levels. This big move in metals was propelled by the decline in the US Dollar as well. When the US Dollar declines, metals tend to move higher.
Additionally, we believe the decline in the US Dollar was partially related to the uncertainty related to geopolitical events and US policy events over the past few weeks. The US government leads the world, in a lot of way, in terms of Congress and Fed policies and capital controls. Uncertainty related to future expectations could cause the US Dollar and metals to move dramatically.
We also want to highlight the Fibonacci Price Amplitude Arcs on the following Gold and Silver charts (the Arcs and Circles). Our research team believes the current price moves indicate that these upside Measured Moves in Gold and Silver are targeting the Fibonacci Price Amplitude Arc target levels related to price range expansion. The Gold chart, below, shows how the price of Gold has move to and through each successive Fibonacci Price Amplitude level – recently clearing the 2.0x Fibonacci Price Amplitude Arc.
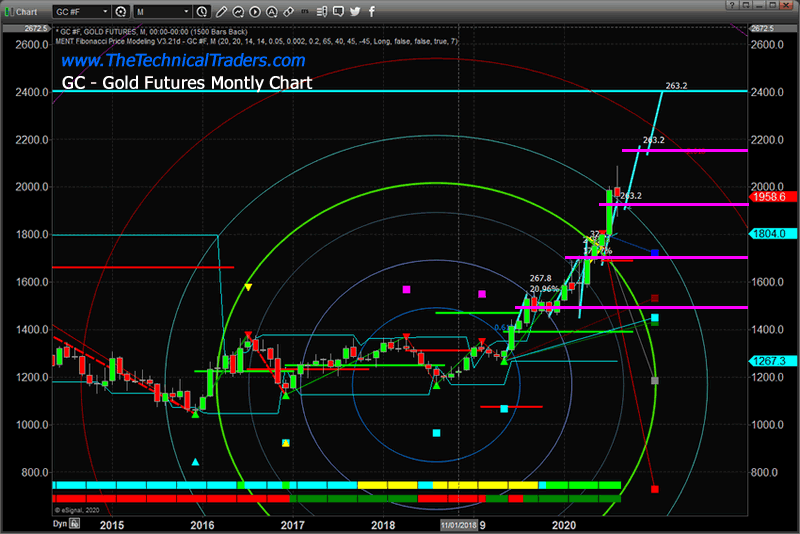
It is our belief that Gold will initiate another upside measured move, quite likely in correlation with a weaker US Dollar, that will target the $2,160 level next. After that level is reached, a brief pause in price will happen before another upside measured move will target the $2,400 level. This upside move is likely to happen before the end of January 2021.
Silver has also moved in a series of Measured Price Moves that correlate with Fibonacci Price Amplitude Arcs. The current Measured Move level, near $27.50, was reached on August 6, 2020. In fact, Silver rallied to a peak level of $29.91 the next day before peaking, rotating downward (retracing), and moving lower to close at $27.54 (almost exactly at our Measured Move Level).
Before you continue, be sure to opt-in to our free-market trend signalsnow so you don’t miss our next special report!
When we add the Fibonacci Price Amplitude Arc analysis to these Measured Move structures for Silver, we quickly come to the conclusion that support near $27.50 should prompt another upside Measure Move targeting the $32.50 level. Beyond that, we can clearly see targets near $37.50 and $42.50. We do believe brief periods of congestion will take place throughout these upside Measured Moves – so pay attention to how price reacts near these targeted levels. Additionally, pay attention to any future price weakness in the US Dollar as that will relate to the speed and volatility of the upside price moves in Gold and Silver.
GOLD-TO-SILVER RATIO PREDICTIONS
Our researchers posted the chart below many months ago related to the peak in the Gold-to-Silver ratio near March 19, 2020. At that time, we suggested that a similar type of downside Pennant/Flag formation would setup, prompting a big breakdown in the extremely high Gold-to-Silver price ration.
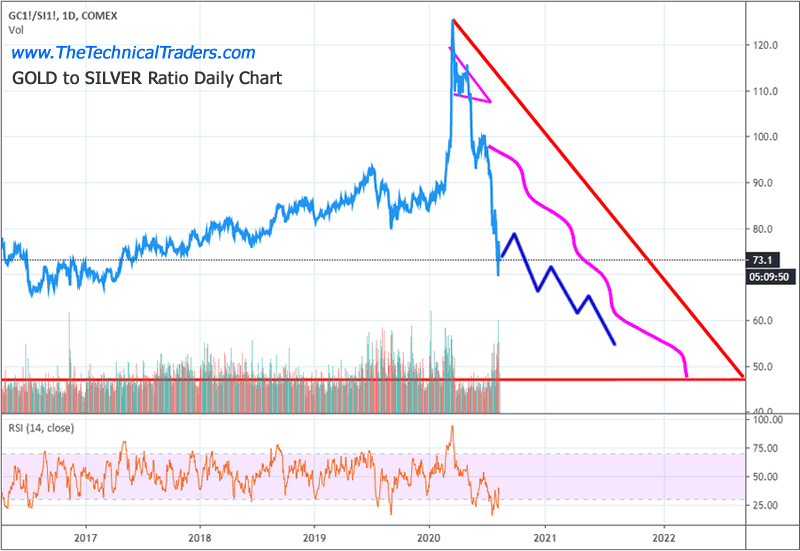
The Gold-to-Silver ratio has recently moved from peak levels, near 125, to 73.1. This downward ratio collapse is the result of the incredible upside price move in Silver recently. Historically, this Gold-to-Silver price ratio should target levels near 55 (or lower) as Silver rallies to comparable price levels to Gold. In 2010~2011, the Gold-to-Silver ratio fell to levels near 31. This happened when Gold rallied to near $2,000 and Silver rallied to near $50. Currently, Gold is trading just below the $2,000 level and Silver is trading near $27.50. This suggests that Silver still has another $24+ of rally waiting to explode higher if the fear and uncertainty expectations are similar to 2010~2011.
Should Gold rally to $2,400 or higher, there is a very strong possibility that Silver could rally above $60 per ounce while Gold continues to move to near all-time highs. In short, we believe this move higher in metals will likely continue as we head into the US Presidential Election and post-election transition.
From a trader’s perspective, the upside price trend, and the bigger downside price move setting up in November 2020 Presidential election cycle, presents very real opportunity for huge gains if you know how to time these moves and prepare for the risks. Right now, this market and the profits therein are fantastic opportunities for skilled technical traders. As we suggested throughout 2018 and 2019, 2020 and 2021 are going to be incredible opportunities for skilled technical traders. This is just getting started, folks. Pay attention and avoid unnecessary risks.
Isn’t it time you learned how I and my research team can help you find and execute better trades? Our incredible technical analysis tools have just shown you what to expect 6+ months into the future. Do you want to learn how to profit from these huge moves? Sign up for my Active ETF Swing Trade Signals today! If you have a buy-and-hold account and are looking for long-term technical signals for when to buy and sell equities, bonds, or cash, be sure to subscribe to my Passive Long-Term ETF Investing Signals.
Stay healthy and rest easy at night by staying informed through our services – sign up today!
Chris Vermeulen
www.TheTechnicalTraders.com
Chris Vermeulen has been involvedin the markets since 1997 and is the founder of Technical Traders Ltd. He is an internationally recognized technical analyst, trader,and is the author of the book: 7 Steps to Win With Logic
Through years ofresearch, trading and helping individual traders around the world. He learnedthat many traders have great trading ideas, but they lack one thing, theystruggle to execute trades in a systematic way for consistent results. Chrishelps educate traders with a three-hourvideo course that can change your trading results for the better.
His mission is to help hisclients boost their trading performance while reducing market exposure andportfolio volatility.
He is a regularspeaker on HoweStreet.com, and the FinancialSurvivorNetwork radio shows. Chriswas also featured on the cover of AmalgaTrader Magazine, and contributesarticles to several leading financial hubs like MarketOracle.co.uk
Disclaimer: Nothing in this report should be construed as a solicitation to buy or sell any securities mentioned. Technical Traders Ltd., its owners and the author of this report are not registered broker-dealers or financial advisors. Before investing in any securities, you should consult with your financial advisor and a registered broker-dealer. Never make an investment based solely on what you read in an online or printed report, including this report, especially if the investment involves a small, thinly-traded company that isn’t well known. Technical Traders Ltd. and the author of this report has been paid by Cardiff Energy Corp. In addition, the author owns shares of Cardiff Energy Corp. and would also benefit from volume and price appreciation of its stock. The information provided here within should not be construed as a financial analysis but rather as an advertisement. The author’s views and opinions regarding the companies featured in reports are his own views and are based on information that he has researched independently and has received, which the author assumes to be reliable. Technical Traders Ltd. and the author of this report do not guarantee the accuracy, completeness, or usefulness of any content of this report, nor its fitness for any particular purpose. Lastly, the author does not guarantee that any of the companies mentioned in the reports will perform as expected, and any comparisons made to other companies may not be valid or come into effect.
Chris Vermeulen Archive |
© 2005-2019 http://www.MarketOracle.co.uk - The Market Oracle is a FREE Daily Financial Markets Analysis & Forecasting online publication.