Gold Signals That Higher Prices Are Coming And Then Moves Lower
Higher lows since late 2015.
Close to a breakout level.
A bullish key reversal.
The technical levels that gold will face.
Silver needs to validate gold.
For the third consecutive year, the price of gold is higher as the first quarter comes to an end than it was at the end of the previous year.
In 2015 gold ended December at $1060.50, and by the end of Q1 2016, the price was trading at the $1233.40 per ounce level. At the end of that year, gold was trading $1152, and at the end of the first three months of 2017, the price was at $1247.40.
Gold closed last year at $1305.10, and with only a few days to go before the end of the first quarter of 2018, the yellow metal was at the $1330 per ounce level. The price action in gold had been strong, and it had ignored weaker performances by other precious metals such as platinum and silver over recent weeks and months. Gold is shining these days, and there are lots of reasons to expect the yellow metal to keep on working its way to the upside. While interest rates in the U.S. are rising, the dollar is close to recent lows. A bearish trend in the dollar is typically a positive sign for the price of gold. Moreover, there is more than a fair share of uncertainty in markets these days, and recent data suggest that inflationary pressures could be mounting. We could be on the verge of what may develop into a perfect bullish storm for the price of gold. Meanwhile, the price trend since late 2015 has not wavered.
Higher lows since late 2015
The pattern of trading in the gold futures market has been bullish since December 2015. 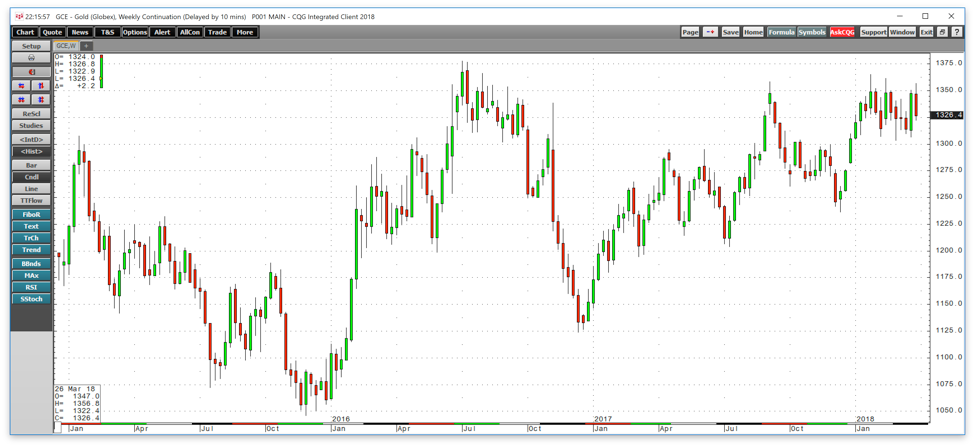
Source: CQG
As the weekly chart of COMEX gold futures highlights, the yellow metal has made higher lows for more than three years. The peak came in early July 2015 at $1377.50 in the immediate aftermath of the Brexit referendum in the United Kingdom.
Gold got down to a low of $1303.60 and was trading near that level in the days leading up to the most recent meeting of the Federal Reserve. The central bank first increased the short-term Fed Funds rate in December 2015 and had acted six times to hike rates by 25 basis points each time. In the prelude to a rate hike, gold has typically moved lower on the prospects for higher interest rates. Rate differentials tend to be the primary factor when it comes to the path of least resistance for currencies, and gold has an inverse historical relationship with the U.S. dollar. However, the dollar has been falling since early 2017 providing support for the yellow metal. On March 28, the June dollar index was trading at 89.719, close to its lowest level since 2014 at 88.15. Gold has been trading almost tick-for-tick against the dollar, and continued weakness in the dollar index could mean strength in gold.
The dollar fell from 1985 through 1992 and then rallied until 2001. The greenback then declined until 2008 and moved into a bull market that came to an end in January 2017. If the pattern of seven years of price weakness and nine years of strength continues, the U.S. currency could be only at the beginning of year two of its bear market cycle. Moreover, tariffs have been historically bearish for the U.S. currency. Recent events of a 10% duty on aluminum, 25% on steel, and $60 billion in tariffs on China could exacerbate the downward trajectory of the dollar when compared to the euro currency which makes up 57% of the index. A weak dollar tends to be bullish for the price of gold.
Close to a breakout level
In 2018, gold has been working its way towards a test of that level and traded up to a high of $1365.40 in late January, just $12.10 below its level of critical resistance on the continuous futures contract. 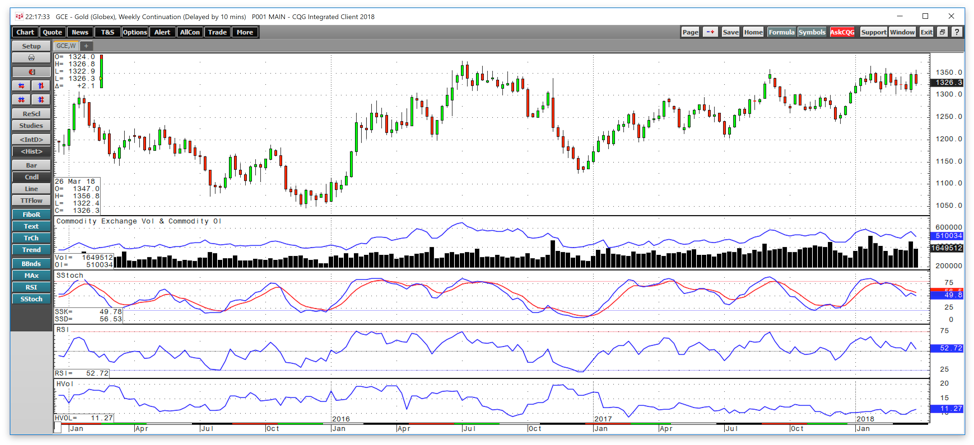
Source: CQG
As the weekly chart illustrates, gold is in excellent technical shape these days. Open interest is the total number of open long and short positions in a futures market. The metric moved from just under 496,000 contracts on March 5 when the yellow metal was under pressure. However, it had increased to over 564,000 last week as the price of gold was moving towards its 2016 peak price. Rising open interest alongside increasing price tends to be a bullish validation of an emerging trend in futures markets. When gold rallies the metric has been rising and when it falls it declines, which is a validation of technical strength in the gold futures market.
At the same time, price momentum on the weekly chart is in neutral territory.
A bullish key reversal
In another bullish sign for the gold market, last week the yellow metal put in a bullish key reversal trading pattern on the weekly chart. Gold fell to a low of $1306.60 which was lower than the previous week, and closed at $1347.30 per ounce, higher than the prior week's high.
A bullish key reversal on the weekly chart is often a signal of strength in a future market. The last reversal on the weekly occurred during the week of August 7, 2017, and it took gold over $100 higher than the lows during that week. During the week of November 30, 2015, a bullish key reversal trading pattern launched the current bull market in the yellow metal that remains intact. However, we may have to wait as the dollar decided to attempt another recovery which stopped the upward momentum in the yellow metal. Gold reached a high of $1361.60 on March 27, but the next day it was trading back at the $1330 level.
The technical levels that gold will face
It looks like gold is preparing to mount a challenge of the critical technical resistance level at $1377.50 over coming days and weeks. 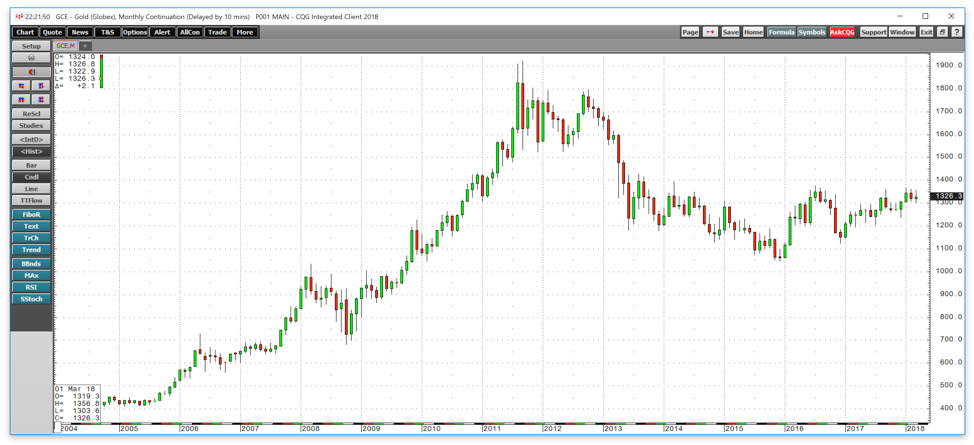
Source: CQG
As the monthly chart shows, above the July 2016 peak, the next level of technical resistance is nearby at $1392.60, the March 2014 high. $1400 is likely to stand as a psychological level of resistance, but the August 2013 high at $1428 will be the next level that could stand as a barrier for the price of gold.
If gold can scale the wall of resistance and move above $1430, it could be clear sailing on the upside to the October 2012 peak at $1794.80, and the all-time high for the precious metal is at the September 2011 high at $1920.70 per ounce.
Gold is currently looking good on a technical basis, and the trajectory of the dollar is supportive of more gains in the coming weeks. However, gold is going to need some help and silver is the metal that could help ease its journey to the upside.
Silver needs to validate gold
Silver is the most volatile precious metal, and it tends to attract the greatest amount of speculative interest. "Poor man's gold" is cheaper on a per ounce basis and it has a long history of posting much higher returns on a percentage basis during bull market moves. 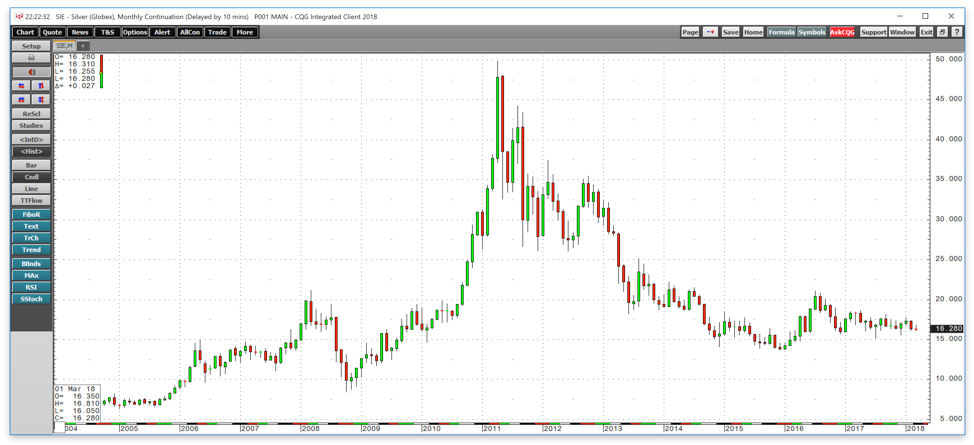
Source: CQG
As the monthly chart shows, silver traded to a high of $49.82 in April 2011, one month after gold hit its peak at $1920.70. Gold fell to lows of $1046.20 in December 2015, a correction of 45.5%. During the same month, silver found a bottom at $13.635, 72.6% lower than its peak. Silver has been consolidating over recent years. When gold reached its 2016 high at $1377.5, silver traded to a peak at $21.095 per ounce. On March 28, gold was around $1330 per ounce, just 3.4% off the highs. However, silver was at the $16.285 level, 22.8% off its 2016 peak. Silver has a lot of catching up to do when it comes to the precious metal sector. If gold's little brother breaks out to the upside above the $18.16 per ounce level where technical resistance stands, it will likely provide additional support to the yellow metal, and we could see a return of speculative interest and wide price variance to the silver market over the coming weeks. 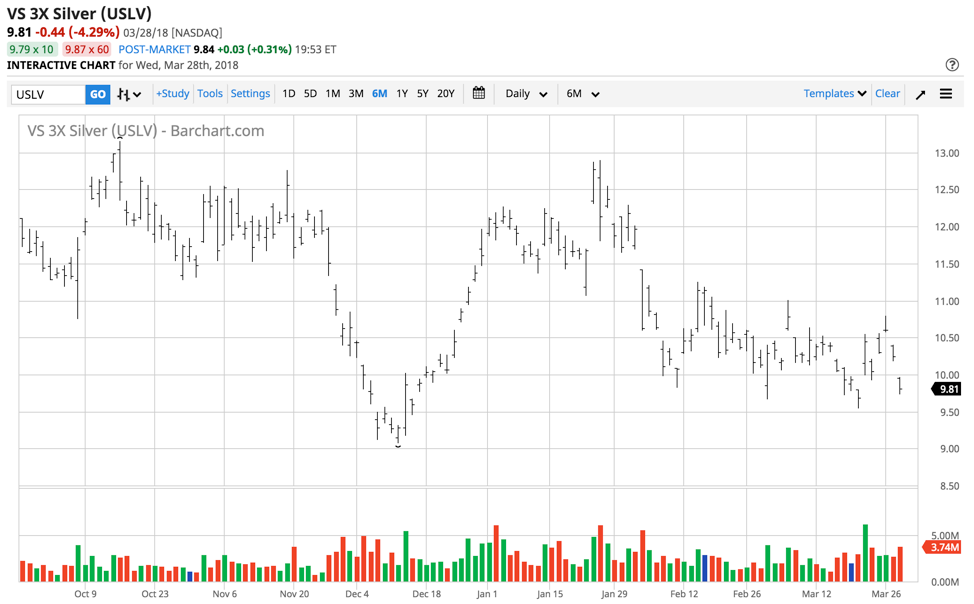
Source: Barchart
I believe that both gold and silver will eventually undergo a significant upside move. A bullish surprise from the silver market will likely send gold above $1400 per ounce for the first time since 2013. Given silver's penchant for volatility and big percentage moves, the triple-leveraged silver ETN product (NASDAQ:USLV) could offer market participants value and the opportunity for significant gains if the price of silver is preparing to break higher. USLV was trading at the $9.81 per share level on March 28.
Last week's bullish key reversal in gold, a dollar that is close to lows and in a long-term bearish trend, and the price trend in the yellow metal since late 2015 all add up to a compelling bullish case for both precious metals. I am a buyer of USLV at current levels and believe if "poor man's gold" decides to move we could see this ETN double in value.
The Hecht Commodity Report is a must-read...
I believe we're on the verge of a commodities super cycle. Do you know how to profit from it? I do, and I can help you navigate the turbulent commodities markets to make the most of the trends behind the trade. The Hecht Commodity Report on Marketplace provides subscribers with my weekly outlook, top picks, and bullish, bearish or neutral calls on over 30 individual commodities markets, including U.S. futures. I also make timely recommendations for risk positions in ETF and ETN markets and commodity equities and related options. There's also an active live chat, where I reply quickly to questions. If you want to build wealth with commodities, the Hecht Commodity Report is required reading.
Disclosure: I/we have no positions in any stocks mentioned, and no plans to initiate any positions within the next 72 hours.
I wrote this article myself, and it expresses my own opinions. I am not receiving compensation for it (other than from Seeking Alpha). I have no business relationship with any company whose stock is mentioned in this article.
Additional disclosure: The author always has positions in commodities markets in futures, options, ETF/ETN products, and commodity equities. These long and short positions tend to change on an intraday basis.
Follow Andrew Hecht and get email alerts