Gold Market Update - "so far so good"
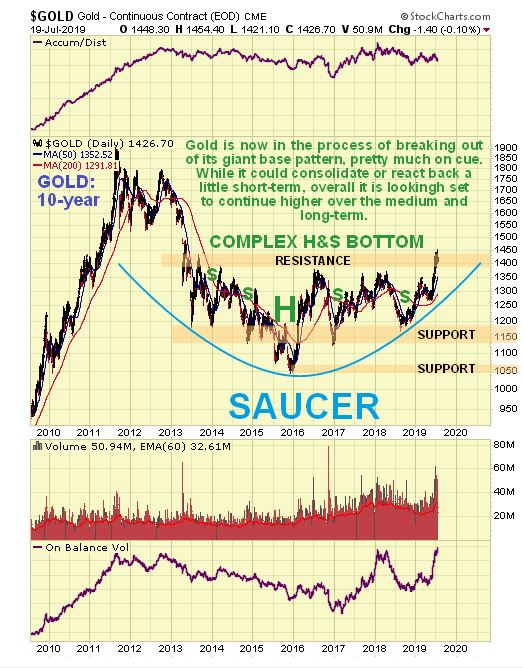
It's a case of "so far so good" for gold, which is breaking out on schedule from its giant complex Head-and-Shoulders base that may also be classified as a Saucer base, as can be seen on its latest 10-year chart...
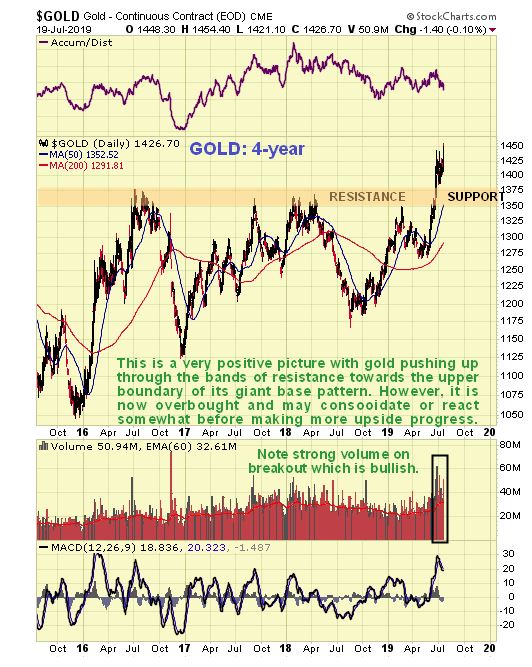
On the 4-year chart we can see that gold's breakout move last month has resulted in its becoming overbought, which partly explains why is hasn't gone anywhere in recent weeks. This is normal following a breakout and it could react back to about $1375 before the advance resumes.
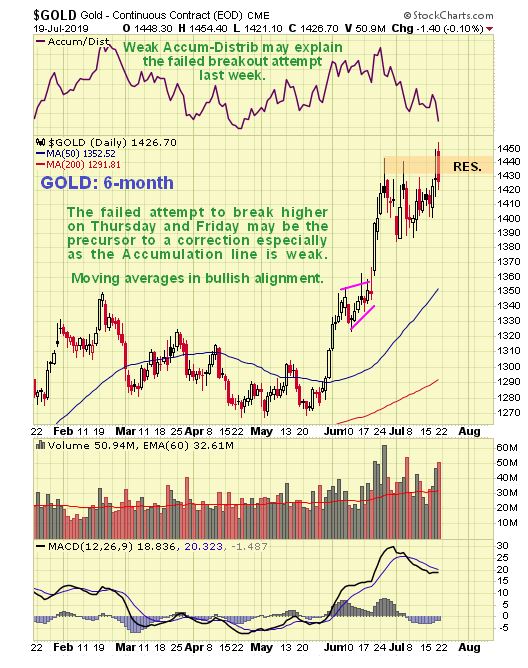
On the latest 6-month chart we can see that recent price / volume action increases the risk of a near-term reaction, because gold has tried twice to break out of a possible bull Flag / Pennant, on Thursday and Friday, and failed, with this failure (thus far at least) made more likely and perhaps presaged by the weak Accumulation line. A failed Pennant breakout usually leads to a period of retreat.
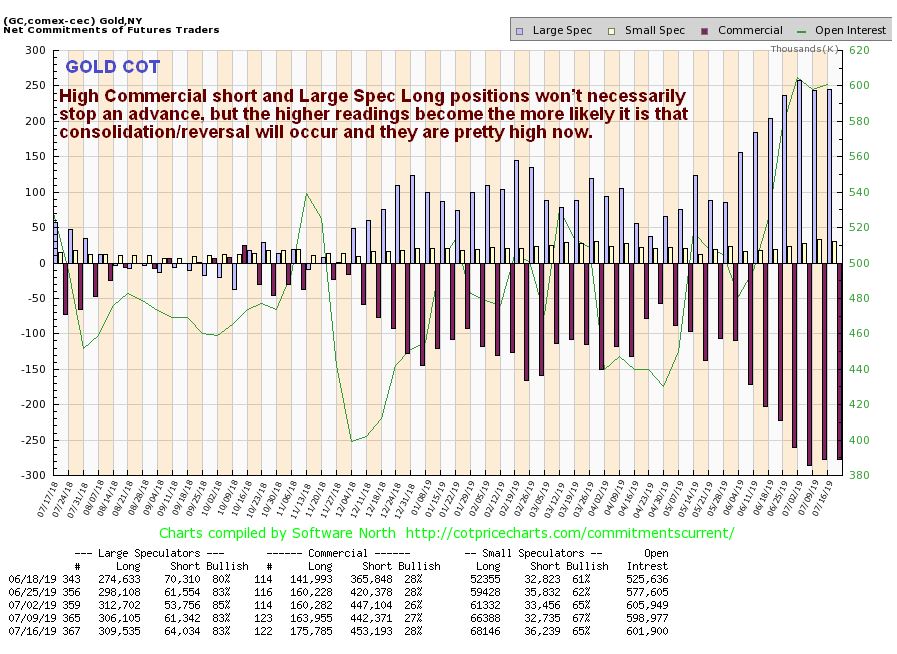
While gold's latest COT readings do not preclude further advance, it is clear that it would benefit from an easing of current Commercial short and Large Spec long positions which are rather extreme and increase the chances of some sort of reaction here.
Click on chart to popup a larger, clearer version.
So, the big picture is strongly bullish, but, barring the Iran situation dramatically worsening, it looks like a period of consolidation /reaction is likely before further significant gains are made. If gold and the sector do react, it is considered unlikely that it will be by much and any such reaction may be used to add to positions across the sector.
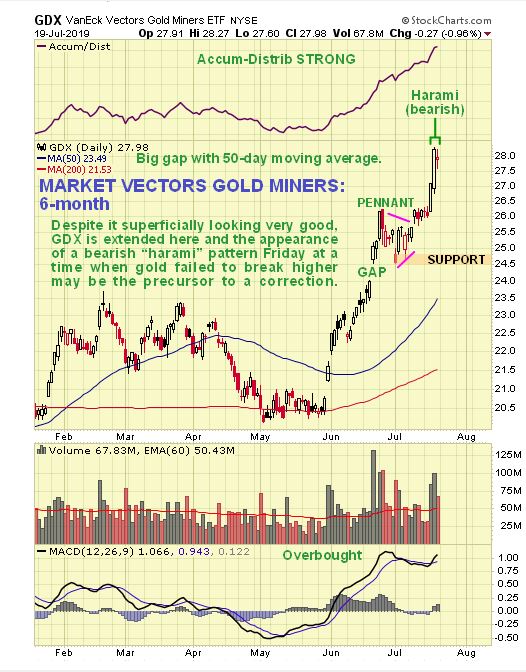
It was rather odd late last week that while gold tried to break higher but failed to, the PM sector forged ahead on Wednesday and Thursday, as we can see on the latest 6-month chart for GDX. Normally, stocks rallying leads to gold following suit, but gold's price/volume action was not bullish for the near-term, and nor was the action in GDX on Friday, which saw a bearish Harami pattern appear, which is where a large candle the previous day is followed by a small one which fits inside the 1st one This is bearish and usually marks a reversal, and thus probably marks the start of a corrective phase.
End of update.