Gold Looks Promising Entering 2018
Gold price outlook is as strong it has been in a long time.
Gold's latest rally is further solidified by a bullish crude oil price outlook.
The return of inflation may serve as gold's biggest driver in 2018.
Gold prices soared to three-month highs on the last trading day of 2017 and were on track for their best year since 2010. The late-year rally in gold was fueled by a weaker dollar, short-covering and some renewed safe-haven buying prompted by global political uncertainties. Here we'll examine the significant technical strides gold has made in recent weeks and discuss the possibilities for a continued rally in January.
Underscoring gold's increasing forward momentum has been a corresponding decline in the U.S. dollar index. The dollar hit a three-month low last Friday, lifting the metal to its highest level since late September at $1,307. In my previous commentary I emphasized that by overcoming the benchmark $1,300 level, gold would likely get the benefit of additional short-covering due to the fact that many gold analysts had made $1,300 the focus of their attention, thereby increasing its psychological significance.
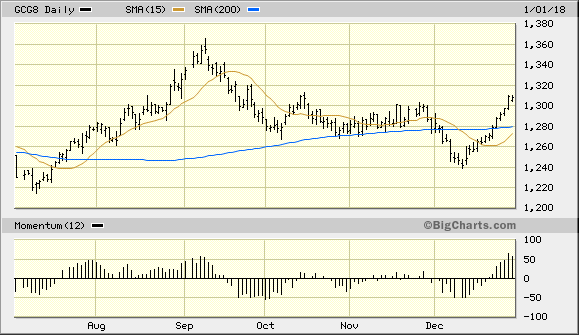
Source: www.BigCharts.com
The dollar index (DXY) is approaching a critical juncture as the New Year begins. The greenback is on the verge of testing its major intermediate-term low at the 91.00 level, which was established in September. The most important consideration for gold traders as we enter 2018 is that DXY remains under its 15-day moving average, thereby confirming that the dollar's immediate-term (1-4 week) trend is down. Since gold tends to move opposite the dollar, this is a bullish factor for the metal and one of the major drivers behind gold's latest rally phase.
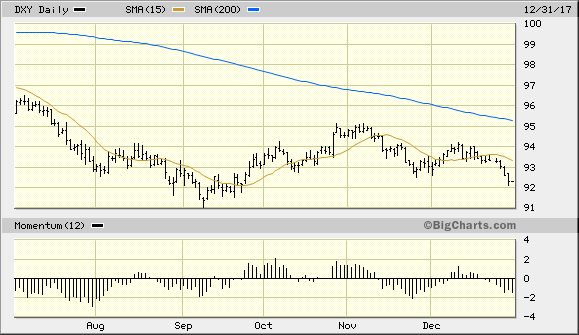
Source: www.BigCharts.com
Another key factor which should help to make the coming weeks bullish for gold is the crude oil price. The oil futures price (basis February) has established impressive upside momentum in recent months and is approaching its highest level in almost three years. This is significant for two reasons. The first reason is the historical tendency for the gold price to feed off strength in the oil market. As I've explained in past commentaries, this is due to the tendency for money managers to view the oil price as a barometer for inflation pressure. Whenever the oil price is rising on a sustained basis, fund managers tend to take a closer look at other inflation-sensitive commodities, most notably gold. Thus, gold bull markets are often born in the oil patch.

Source: www.BigCharts.com
The second reason for the significance of steadily rising oil prices is that sooner or later, increasing fuel prices have economic and sometimes even political ramifications. A genuine bull market in the crude oil market exerts inflationary pressure on the prices of virtually all retail prices due to increased transportation costs (as well as higher feedstock costs). Thus when the oil price continually makes new yearly highs and begins to challenge the highs from previous years, investors naturally begin to fear a renewed outbreak of inflation. This in turn can generate safe-haven buying of gold as a hedge against further inflationary pressures.
While it would be premature to assume that the U.S. economy is in imminent danger of inflation, there are signs that inflation is slowly beginning to emerge after years of lying dormant. One of the best pictures of the overall commodities market is the Thomson Reuters/CoreCommodity CRB Index (CRB). The CRB has been stuck in a sideways trend below the pivotal 195.00 level for the last few years, as can be seen in the graph below. A decisive breakout above the 195.00 level in early 2018 would put commodity bulls firmly in the driver's seat, however. It also would confirm that inflation is becoming more of a concern for producers and investors alike as increased demand for raw materials, coupled with an improving global industrial outlook, pushes prices steadily higher. Gold is poised to benefit from this unfolding scenario.
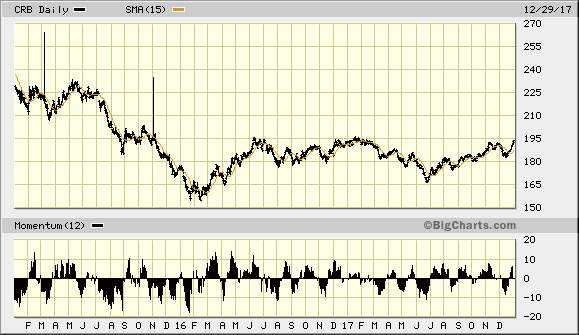
Source: www.BigCharts.com
For disclosure purposes, I am currently long the VanEck Vectors Gold Miners ETF (GDX), which is my favorite proxy for the XAU index. GDX confirmed an immediate-term bottom on Dec. 20 after closing two days higher above the 15-day moving average, per the rules of my trading discipline. For traders who wish to participate in the gold stock turnaround via GDX, I recommend using the 22.00 level as the initial stop-loss on a closing basis. I'm also currently long the iShares Gold Trust ETF (IAU), which is my preferred tracking vehicle for the gold price. I recommend using a stop loss slightly under IAU's 15-day moving average at the 12.18 level (closing basis).
Disclosure: I am/we are long IAU, GDX.
I wrote this article myself, and it expresses my own opinions. I am not receiving compensation for it (other than from Seeking Alpha). I have no business relationship with any company whose stock is mentioned in this article.