Gold Investors Wavering / Commodities / Gold and Silver 2021

Gold has been suckingwind this summer, trudging along after getting slammed by a distant-future-rate-hikesscare. The resulting lower prices havereally damaged psychology, leaving investors wavering on gold. Their recent capital inflows have reversedinto modest selling, contributing to unusual weakness in this leadingalternative asset. But investment demandshould roar back in this inflationary environment.
Gold entered summer 2021with strong upside momentum, in a young upleg that had just powered up 13.5% in2.8 months by early June. This currentinterrupted upleg is the fifth of gold’s secular bull, and the previous four averagedbig 33.3% gains. Gold was progressingnicely until the June 16th meeting of the Fed’s Federal Open Market Committee. The FOMC was expected to do nothing, and that’swhat it did.
In a nothingburger monetary-policydecision, the FOMC left its zero-interest-rate policy and $120b per month ofquantitative-easing money printing in place indefinitely. There were no hints that either of thesehyper-easy policy stances would be changed anytime soon. The leveraged gold-futures speculators whodominate gold’s short-term fortunes should’ve yawned at that, and gone back toenjoying lazy summers.
But with every otherFOMC decision, the Fed releases a Summary of Economic Projections that showswhere individual top Fed officials expect to see certain economic data in comingyears. That includes their outlooks forthe federal-funds rate, which are gathered in a scatter chart known as the “dotplot”. In mid-June’s version, 6 out of 18top Fed officials thought there might be two quarter-point hikes into year-end2023!
That was about 2.5years into the future, an eternity away in the markets. And the dot plot has proven anotoriously-inaccurate FFR predictor anyway. That very afternoon the Fed chair himself warned that the dots are “nota Committee forecast, they’re not a plan. ... the dots are not a greatforecaster of future rate moves.” Hesaid they should “be taken with a big grain of salt.” Jerome Powell advised to ignore the dotplot!
That is wise given dots’dismal track record, as they’ve often proven dead-wrong. Back in December 2015 after the first ratehike of the last cycle, top Fed officials expected four more rate hikes in2016. But only a single one happened, ayear later in December! In December 2018with the ninth hike of that cycle, the dots predicted three more hikes in 2019and 2020. Zero of those actually came topass, that hiking was done.
Yet in mid-June 2021, futurestraders active in US-dollar and gold contracts acted as if those distant-futurehawkish dots were an official FOMC decree heralding a new hiking cycle. So they bid up the US dollar sharply onprospects for higher rates, which unleashed withering gold-futures selling. In three trading days starting with the FOMC,the US Dollar Index blasted 1.9% higher hammering gold a brutal 5.2% lower!
I wrote about that Fed-gold-futures purge extensively that very week, analyzing how specs’ positioning leading into itmeant their selling firepower would quickly exhaust itself. That indeed proved true, as gold bottomedafter that kneejerk several-day pummeling. But that anomalous plunge left serious sentiment damage in itswake. Bearishness flared overpoweringbullishness, leaving traders discouraged on gold.
This indexedgold-summer-seasonals chart is updated from my latest essay on that researchthread of a few weeks ago. It rendersall modern-gold-bull-year summers in like terms by indexing gold’s price actionto May’s final close. Note that mid-June’sridiculous gold plunge on unofficial rate-hike projections way out into the distantfuture made for one of gold’s weakest summers ever. That has left investors wavering.
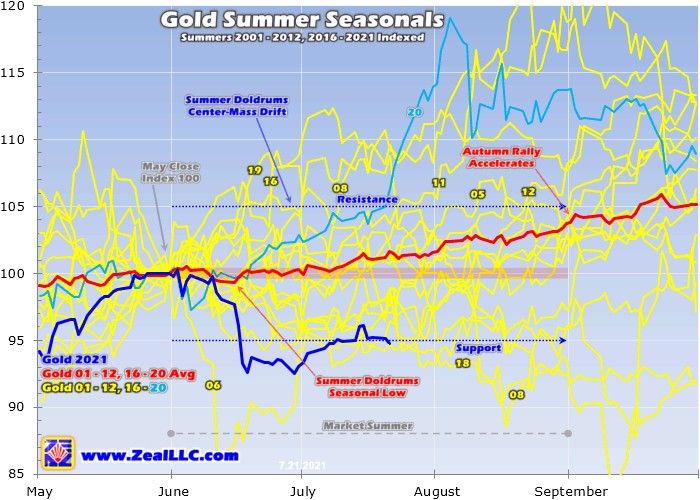
Out of 18 gold-bullyears between 2001 to 2012 and 2016 to 2021, gold has only suffered a worseJune once. That was way back in 2006, ina radically-different situation that justified a sharp correction. Gold had just rocketed 46.2% higher in only4.6 months into mid-May, leaving it incredibly overbought! So a big-and-fast correction was necessary torebalance sentiment. That sure wasn’tthe case this summer.
Gold has recovered somesince that hawkish-Fed-dots pummeling, but remains way downsummer-to-date. By mid-July, gold hadrallied 3.8% regaining about two-thirds of its post-FOMC losses. But gold had also fallen considerably in thefew days leading into that FOMC meeting, as traders worried the Fed might warnit was starting to think about tapering its QE bond monetizations. That didn’t happen though.
Gold entered June at young-upleghighs near $1,903, retreated to $1,859 on the eve of that FOMC day, plummetedto $1,763 a few trading days later, then rebounded to $1,829 a couple weeksago. That wild mostly-downside ride hasleft investors wary of the yellow metal. They like to chase upside momentum, which has been sorely lackingin gold this summer. Thus investmentcapital flows have reversed to selling.
Comprehensive globalgold supply-and-demand data is only published once a quarter by the World GoldCouncil, in their fantastic Gold Demand Trends reports. But a great high-resolution daily proxy for world gold investment is the physical-gold-bullion holdings of the leadingand dominant gold exchange-traded funds. These are of course the massive American GLD SPDR Gold Shares and IAUiShares Gold Trust.
In the WGC’s latest GDTcovering Q1’21, GLD and IAU commanded 29.0% and 14.1% of all the gold held byall the world’s physically-backed gold ETFs! The distant third was a UK competitor at just 6.3%. Global gold ETFs suffered major draws in Q1 asinvestors fled a gold correction. GLD+IAUholdings alone accounted for nearly 7/8ths of that world total. These huge ETFs increasingly dominate goldinvestment.
This next chart superimposesGLD+IAU holdings over gold itself, revealing how they moved during major uplegsand corrections in the yellow metal. Forour purposes today, we are zooming in to the action this summer. Investment capital was flowing into goldbefore that hawkish-Fed-dots scare, stalled in its wake, then rolledover into modest selling since gold’s recovery has been anemic. That has weighed on prices.
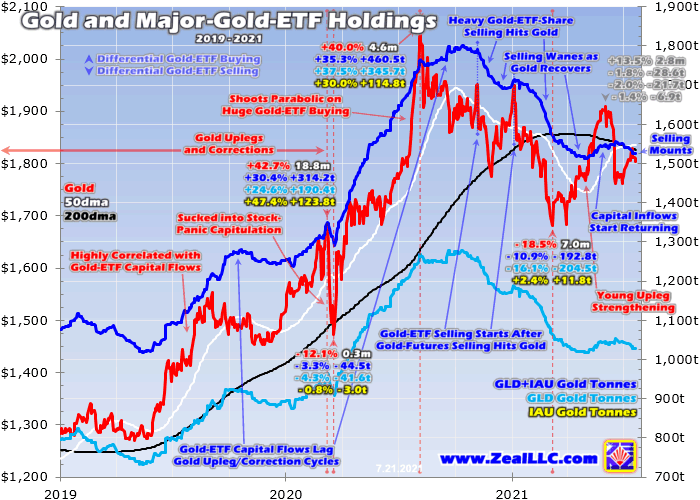
Gold’s anomalouspost-FOMC plunge is readily apparent even at this multi-year scale, and thetrajectory of GLD+IAU holdings and thus investment capital flows have turnedsouth since. Heading into June, the combinedGLD+IAU holdings were running 1,543.8 metric tons. Despite gold’s slump ahead of that FOMCmeeting on unfounded QE-tapering fears, GLD+IAU holdings edged up 0.2% to 1,547.6ton that Fed eve.
Then initially as gold plummeted5.2% in those three trading days starting with those hawkish dots, that didn’tseem to faze investors. The capitalinflows into gold via differential gold-ETF-share buying not only persisted, butaccelerated. GLD+IAU holdings climbed0.6% to 1,556.8t during that gold-plunging span! But after gold failed to recover fast in a sharpV-bounce, investors’ confidence in its near-term outlook waned.
Gold investment-capitaloutflows were small in the last couple weeks of June, with GLD+IAU holdingsslipping 0.4% by month-end from their post-FOMC high. But unfortunately that differential gold-ETF-shareselling has intensified since. By mid-July,GLD+IAU holdings had fallen another 1.6% month-to-date to 1,525.2t. Overall between soon after the FOMC to lastFriday, those draws totaled 2.0% or 31.5t.
Fortunately thismounting selling remains modest if not smallish. For some perspective, in just the singleCommitments-of-Traders week straddling that mid-June FOMC meeting speculatorsdumped the gold-futures equivalent of 89.7t! That is what blasted gold 5.2% lower in three trading days despite that concurrentbuild in GLD+IAU holdings. So this mid-summergold investment selling hasn’t been a threat yet.
And it shouldn’t becomeone, as gold has been holding its own since that ridiculous distant-future-rate-hikesscare and clawing its way back higher on balance. But this festering investment selling iscertainly reinforcing gold’s slow recovery. Again investors live to chase upside momentum, and gold has mostly beenlacking in that department because of those hawkish Fed dots. So investors have been wavering since.
While their sentimentis damaged, it definitely isn’t bearish since their recent selling has proven limited. Thus it shouldn’t take much of a gold advanceto start enticing investors back in. Andtheir capital inflows resuming will accelerate gold’s gains, attracting in moreinvestors forming the powerful virtuous circle of buying typical inmajor gold uplegs. Higher gold prices bringpeople back, and their buying pushes gold higher.
One reason goldinvestment is likely to improve soon is August sees strong autumn-rally seasonals. I’m updating that research thread for a newessay next week, but for now realize August has proven gold’ssecond-strongest month through those same modern bull years in the firstchart above. On average gold has surged 2.1%higher in August, followed by another big 1.7% in September! That stretch is super-bullish.
A far-better argumentfor upping portfolio allocations to gold is the raging inflation this profligateFed has unleashed. Between March 2020’spandemic-lockdown stock panic to mid-July, the US Federal Reserve has balloonedits balance sheet a terrifying 90.2% or $3,890b! That’s no typo, in just 16.1 months the Fedhas nearly doubled the US-dollar supply! And $120b of monthly QE is continuing that extreme growth.
This radically-unprecedenteddeluge of new money conjured out of thin air to monetize the US federalgovernment’s insanely-huge deficits is naturally forcing prices sharplyhigher. Relatively-more moneybidding up the prices on relatively-less goods and services is the very definitionof inflation. And as that becomes ever-moreapparent in investors’ everyday lives, they will flock back to the ultimateinflation hedge.
The latest officialinflation reads from the US government are red-hot, even though they areintentionally lowballed statistically. Last week the US Consumer Price Index was reported as soaring 0.9% month-on-monthand 5.4% year-over-year in June! And thecore read stripping out food and energy looked even worse, rocketing up 4.5%YoY! That proved the hottest core inflationsince way back in September 1991!
We are all seeingmuch-higher and ever-rising prices in most of the things we need and want tobuy, this price inflation is real. Whatdid the Fed expect nearly doubling the US money supply in just a year-and-a-third? And as everyone responsible for running ahousehold or business is painfully aware, the true inflation rate is far hotterthan the 5%ish the US federal government is claiming. It is definitely double-digits.
I could write essays onhow official reporting lowballs inflation, but consider an example. In the blistering inflation year of 1979 whengold skyrocketed, the CPI rose 11.3%. That was partially driven by a 14% increase in house prices, a criticalcomponent of living. Today’s watered-downCPI no longer includes house prices, which are soaring. Instead a garbage arbitrary construct calledowners-equivalent rent is substituted.
That makes up about aquarter of the CPI, and is only up 2.3% in the past year according to governmentstatisticians. A 2.3% increase in housingcosts is ludicrous compared to the real-world. Just yesterday for example, a separate dataset revealed the US medianhouse price soared 23.4% YoY to an all-time high of $363k! Americans’ actual housing costs are rising anorder of magnitude faster than the CPI is reporting.
Throw out that OER fairy-taleand replace it with hard actual house-price data, and the CPI would already be blastinghigher in double-digits right now! And that doesn’t include all kinds of other hedonic statistical wizardryintentionally included to underreport inflation. Higher inflation fuels political and socialunrest, and raises the financial burden on the government to increase welfare payments. Politicians fear high inflation.
And this soaring priceinflation isn’t going away unless the Fed starts unwinding its recklessmushrooming of the money supply. Consumer prices are fed by producer prices, wholesale inflation at factorygates. Of course that is still blastinghigher too with that flood of new dollars bidding up prices. The latest June read for the US PPI showed ascary 7.3% YoY gain, the hottest on record in the current iteration of thisdata!
That baked-in pipelineinflation will continue to translate into higher consumer prices. Whenever I get a chance to talk with anyone,I try to work inflation into the conversation. I ask them what they are seeing in terms of prices and the costs ofliving for their households. Americansare increasingly aware that prices are relentlessly spiraling higher,and eventually the rightful blame for this crisis will be laid at the Fed’sfeet.
How did gold fare in1979 the last time excessive monetary growth unleashed serious inflation? During that calendar year alone itskyrocketed 126.5% higher! As investors startunderstanding the dangerous inflationary monster the Fed has foolishly spawned,and realize it can’t be killed without shrinking the money supply which wouldtrigger a depression and crash the stock markets, gold investment demand willsoar.
These lofty Fed-levitatedstock markets are another reason gold portfolio allocations need to shoot way higher. That 90%+ explosion in the Fed’s balance sheetis the primary reason why the benchmark S&P 500 US stock index soared 96.0%at best since March 2020’s panic. That hasdriven stocks deep into bubble territory, with SPX companies averaging trailing-twelve-monthprice-to-earnings ratios of 36.5x entering July!
Historical fair-valueover the past century-and-a-half or so is 14x earnings, and double that at 28xis the starting threshold for bubbles. That makes US stocks extraordinarily vulnerable to a new bear market. Though the Fed’s QE has delayed that, the lastcouple bears ending in October 2002 and March 2009 mauled the S&P 500 down49.1% over 2.6 years and 56.8% over 1.4 years! The next bear is long overdue.
It could awaken whenthe Fed starts tapering QE, slowing its $120b per month of bond monetizations. And it would almost certainly roar if the Fedreverses quantitative easing to quantitative tightening, actuallyselling bonds to unwind some of the trillions of new dollars it has created. Whatever the bear-igniting spark, weakerstock markets will really boost demand for the leading alternative investmentwhich is gold.
During bears itgenerally moves counter to stock markets, rallying on capital inflows asinvestors wisely diversify from overweight stock positions. And the room for portfolio-shifting goldbuying is enormous. One proxy for goldinvestment compares the value of GLD+IAU holdings to all S&P 500 stocks’market caps. Exiting June, that ratioran a trivial 0.2%! American stockinvestors had only 0.2% allocated to gold.
For centuries if notmillennia, 5% to 10% was considered the minimum prudent portfolio allocation ingold. Given this crazy-inflationarybackdrop today, 20% is probably far smarter. At any rate, vast amounts of capital should flow into gold as central bankscontinue to balloon money supplies forcing all prices higher. If American stock investors even move from0.2% to 1% or 2%, gold prices would power higher for years.
As the Fed can’t stuffthis inflationary genie back in the bottle without slashing the money supply backto pre-pandemic levels, which would again crash the stock markets and spawn a depression,the arguments for gold investment are stronger than ever. Investors will increasingly return bidding upthe yellow metal’s price as their inflation worries mount. And these spiraling-higher prices will continuegrowing into a bigger issue.
The main beneficiary ofgold rebounding and resuming its FOMC-interrupted upleg will be gold miners’stocks. That silly hawkish-Fed-dotsscare hammered their prices down to really-oversold levels relative to their 200-day moving averages and really-undervalued levels comparedto gold. As usual gold stocks will amplifygold’s coming upside, with the best gains accruing in fundamentally-superior mid-tiersand juniors.
At Zeal we walk the contrarianwalk, buying low when few others are willing before later selling high when fewothers can. We overcome popular greedand fear by diligently studying market cycles. We trade on time-tested indicators derived from technical, sentimental,and fundamental research. That hasalready led to realized gains in this current young upleg as high as +51.5% onour recent newsletter stock trades!
To multiply your wealthtrading high-potential gold stocks, you need to stay informed about what’sgoing on in this sector. Stayingsubscribed to our popular and affordable weekly and monthly newsletters is a greatway. They draw on my vast experience, knowledge,wisdom, and ongoing research to explain what’s going on in the markets, why, andhow to trade them with specific stocks. Subscribe today while this gold-stockupleg remains young! Our recently-reformattednewsletters have expanded individual-stock analysis.
The bottom line is goldinvestors are wavering, their psychology damaged after gold plummeted in mid-Juneon those hawkish Fed dots. Without enoughupside momentum to chase, investors have been selling gold on balance since soonafter the FOMC. While modest, those investmentcapital outflows have still weighed on gold’s price. But investors’ light selling should quicklyreverse to sizable buying as gold perks up.
Strong seasonals resumein August, a very-bullish omen. And thespiraling price inflation unleashed by the Fed’s colossal balance-sheet ballooningis increasingly becoming center-stage. The more investors grow aware of how serious this late-1970s-likeinflation is, the more capital they will move into gold. It has always been the ultimate inflationhedge, and higher prices beget more buying fueling a virtuous circle of upside.
Adam Hamilton, CPA
So how can you profit from this information? We publish an acclaimed monthly newsletter, Zeal Intelligence , that details exactly what we are doing in terms of actual stock and options trading based on all the lessons we have learned in our market research. Please consider joining us each month for tactical trading details and more in our premium Zeal Intelligence service at … www.zealllc.com/subscribe.htm
Questions for Adam? I would be more than happy to address them through my private consulting business. Please visit www.zealllc.com/adam.htm for more information.
Thoughts, comments, or flames? Fire away at zelotes@zealllc.com . Due to my staggering and perpetually increasing e-mail load, I regret that I am not able to respond to comments personally. I will read all messages though and really appreciate your feedback!
Copyright 2000 - 2019 Zeal Research ( www.ZealLLC.com )
Zeal_LLC Archive |
© 2005-2019 http://www.MarketOracle.co.uk - The Market Oracle is a FREE Daily Financial Markets Analysis & Forecasting online publication.