Gold Investors Shouldn't Be Losing Focus / Commodities / Gold & Silver 2020

The recent volatility inmost markets was really extreme, which means that it was easy to lose focus onthe things that matter the most in case of the gold market. It was relativelyeasy to keep one’s focus as far as the fundamental outlook for gold isconcerned – it’s quite obvious that the economies around the world are in deeptrouble and that the various QEs and money-printing mechanisms are likely to be inflationary, which together islikely to result in stagflation – which gold loves.
On the other hand, it waseasy to lose focus with regard to one of gold’s key short- and medium-termdrivers – the USD Index. If the USD Index soars, then gold is likely to plungein the short run, regardless of how favorable other fundamentals are.
Consequently, in today’sfree article, we’ll discuss the situation in the USD Index, with emphasis ontwo key similarities.
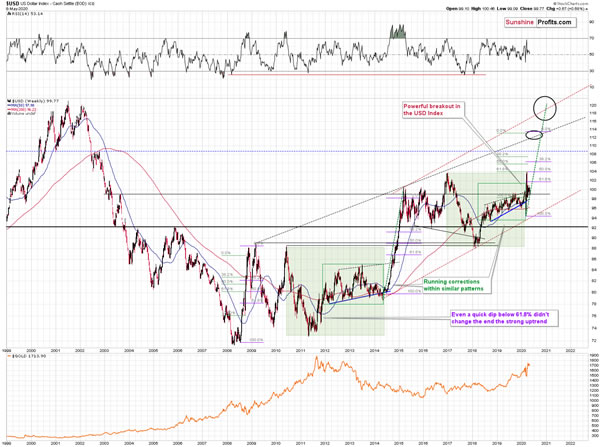
TheUSD Index was previously (for the entire 2019 as well as parts of 2018 and2020) moving up in a rising trend channel (all medium-term highs were higherthan the preceding ones) that formed after the index ended a very sharp rally.This means that the price movement within the rising trend channel was actuallya running correction, which was the most bullish type of correction out there.
Ifa market declines a lot after rallying, it means that the bears are strong. Ifit declines a little, it means that bears are only moderately strong. If theprice moves sideways instead of declining, it means that the bears are weak.And the USD Index didn't even manage to move sideways. The bears are so weak,and the bulls are so strong that the only thing that the USD Index managed todo despite Fed's very dovish turn and Trump's calls for lower USD, is to stillrally, but at a slower pace.
Wepreviously wrote that the recent temporary breakdown below the rising bluesupport line was invalidated, and that it was a technical sign that amedium-term bottom was already in.
TheUSD Index soared, proving that invalidation of a breakdown was indeed anextremely strong bullish sign.
Interestingly,that's not the only medium-term running correction that we saw. What'sparticularly interesting, is that this pattern took place between 2012 and 2014and it was preceded by the same kind of decline and initial rebound as thecurrent running correction.
The2010 - 2011 slide was very big and sharp, and it included one meaningful correctiveupswing - the same was the case with the 2017 - 2018 decline. Also, they bothtook about a year. The initial rebound (late 2011 and mid-2018) was sharp inboth cases and then the USD Index started to move back and forth with highershort-term highs and higher short-term lows. In other words, it entered arunning correction.
Theblue support lines are based on short-term lows and since these lows were formedat higher levels, the lines are ascending. We recently saw a small breakdownbelow this line that was just invalidated. And the same thing happened in early2014. The small breakdown below the rising support line was invalidated.
Sincethere were so many similarities between these two cases, the odds are that thefollow-up action will also be similar. And back in 2014, we saw the biggestshort-term rally of the past 20+ years. Yes, it was bigger even than the 2008rally. The USD Index soared by about 21 index points from the fakedown low.
TheUSDX formed the recent fakedown low at about 96. If it repeated its 2014performance, it would rally to about 117 in less than a year. Before shruggingit off as impossible, please note that this is based on a real analogy - italready happened in the past.
Infact, given this month’s powerful run-up, it seems that nobody will doubt thepossibility of the USD Index soaring much higher. Based on how things aredeveloping right now, it seems that the USD Index might even exceed the 117level, and go to 120, or even higher levels. The 120 level would be anextremely strong resistance, though.
Basedon what we wrote previously in today's analysis, you already know that bigrallies in the USD Index are likely to correspond to big declines in gold. Theimplications are, therefore, extremely bearish for the precious metals market forthe following months.
Onthe short-term note, it seems that the USD Index has finished or almostfinished its breather after the powerful run-up. While the base for the movemay be similar to what happened between 2010 and 2014, the trigger for thisyear’s sharp upswing was similar to the one from 2008. In both cases, we sawdramatic, and relatively sudden rallies based on investors seeking safe haven.The recent upswing was even sharper than the initial one that we had seen inthe second half of 2008. In 2008, the USDX corrected sharply before moving uponce again, and it’s absolutely no wonder that we saw the same thing alsorecently.
Infact, onMarch 23rd, just after the USDX closed at 103.83, we wrote that “on the short-term note, it seems that the USD Index was ripe for acorrection.
Buta correction after a sharp move absolutely does not imply that the move isover. In fact, since it’s so in tune with what happened after initial (!) sharprallies, it makes the follow-up likely as well. And the follow-up would be another powerful upswing. Justas a powerful upswing in the USD Index triggered gold’s slide in 2008 and inMarch 2020, it would be likely to do the same also in the upcoming days /weeks.
Please note that the 2008 correction could havebeen used – along with the initial starting point of the rally – to predictwhere the following rally would be likely to end. The green lines show that theUSDX slightly exceeded the level based on the 2.618 Fibonacci extension basedon the size of the correction, and the purple lines show that the USDX hasapproximately doubled the size of its initial upswing.
Applying both techniques to the current situation,provides us with the 113 – 114 as the next target area for the USD Index. Asharp rally to that level (about 13-14 index points) would be very likely totrigger the final sell-off in gold, silver, and mining stocks.
7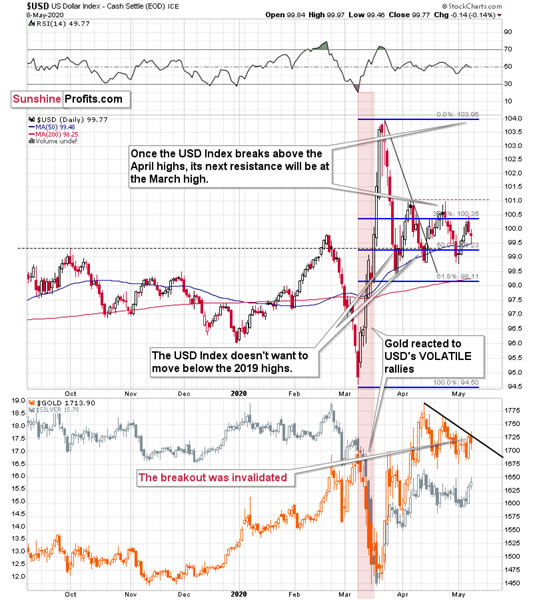
On a short-term basis, we just saw a daily movelower in gold, while the USD Index declined and reversed before the end of the day.This – by itself – is a sign of gold’s weakness, but it’s a sign of strongweakness, when one takes into account gold’srecent technical development.
Namely, gold recently moved above its decliningresistance line – the upper border of the triangle / pennant. A decline in theUSD Index was a bullish factor for gold and it should have easily held ground.Namely, it should have rallied further and confirmed the breakout. Gold didn’tmanage to do that. Instead, it declined and invalidated the breakdown. This isa profound sign of weakness.
Interestingly, while gold showed weakness, silvershowed daily strength by rallying higher despite a move lower in gold. That’sexactly what we quite often see right before big declines in the preciousmetals market.
The above is the most important short-term technical development ingold, so we don’t discuss it separately from this point of view, but we wouldlike to draw your attention to the following monthly goldchart.
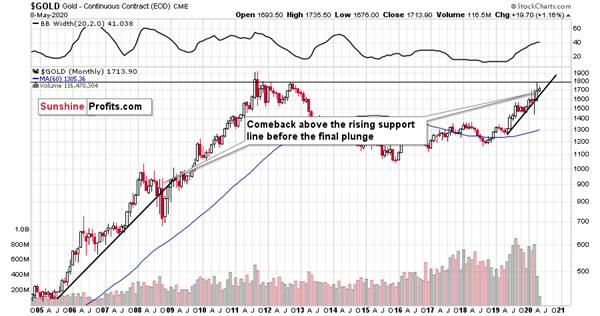
In 2008, after the initial plunge, and a – failed – intramonth attemptto move below the rising support line, gold came back above it and it closedthe month there. The same happened in March 2020.
During the next month in 2008, gold rallied and closed visibly abovethe rising support line. The same was the case in April, 2020.
In the following month – the one analogous to May 2020 – gold initiallymoved higher, but then it plunged to new lows and finally closed the monthbelow the rising support line. We might see something very similar this month.
Speaking of this month in particular, let’s check how goldusually (seasonally) performs in May.
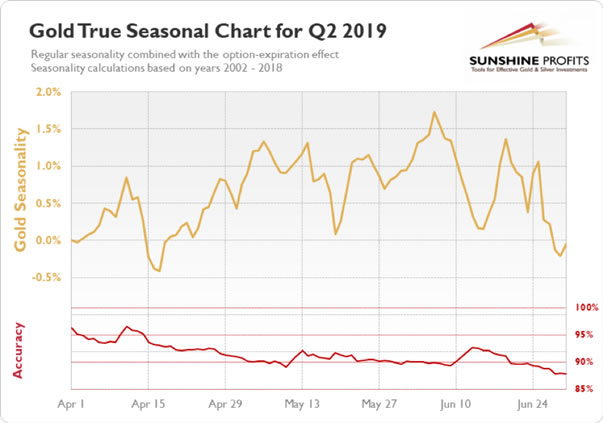
In short, gold usually tops in the first half ofthe month, and bottoms in its second half. It then recovers, but moves to newhighs only in June. This more or less fits what we expect to see later thismonth also this year.
All in all, the outlook for the USD Index isbullish, which is likely to trigger a decline in the price of gold. Ultimately,gold is likely to recover and soar in the following years, but the oppositeseems more likely for the following weeks.
Thank you for reading today’s free analysis. Pleasenote that it’s just a small fraction of today’s full Gold & Silver TradingAlert. It also includes the fundamental analysis of the Great Lockdown with theemphasis on the dramatic changes on the US jobs market, as well as technicaldiscussion of silver, mining stocks, USD Index, platinum, and palladium. Theysay that the partially informed investor is just as effective as partiallytrained surgeon… You might want to read the full version of our analysis beforemaking any investment decisions.
If you’d like to read those premium details, wehave good news. As soon as you sign up for our free gold newsletter, you’ll get7 access of no-obligation trial of our premium Gold & Silver TradingAlerts. It’s really free – sign up today.
Thank you.
Przemyslaw Radomski, CFA
Founder, Editor-in-chief
Toolsfor Effective Gold & Silver Investments - SunshineProfits.com
Tools für EffektivesGold- und Silber-Investment - SunshineProfits.DE
* * * * *
About Sunshine Profits
SunshineProfits enables anyone to forecast market changes with a level of accuracy thatwas once only available to closed-door institutions. It provides free trialaccess to its best investment tools (including lists of best gold stocks and best silver stocks),proprietary gold & silver indicators, buy & sell signals, weekly newsletter, and more. Seeing is believing.
Disclaimer
All essays, research and information found aboverepresent analyses and opinions of Przemyslaw Radomski, CFA and SunshineProfits' associates only. As such, it may prove wrong and be a subject tochange without notice. Opinions and analyses were based on data available toauthors of respective essays at the time of writing. Although the informationprovided above is based on careful research and sources that are believed to beaccurate, Przemyslaw Radomski, CFA and his associates do not guarantee theaccuracy or thoroughness of the data or information reported. The opinionspublished above are neither an offer nor a recommendation to purchase or sell anysecurities. Mr. Radomski is not a Registered Securities Advisor. By readingPrzemyslaw Radomski's, CFA reports you fully agree that he will not be heldresponsible or liable for any decisions you make regarding any informationprovided in these reports. Investing, trading and speculation in any financialmarkets may involve high risk of loss. Przemyslaw Radomski, CFA, SunshineProfits' employees and affiliates as well as members of their families may havea short or long position in any securities, including those mentioned in any ofthe reports or essays, and may make additional purchases and/or sales of thosesecurities without notice.
Przemyslaw Radomski Archive |
© 2005-2019 http://www.MarketOracle.co.uk - The Market Oracle is a FREE Daily Financial Markets Analysis & Forecasting online publication.