Gold Holding Its Own / Commodities / Gold and Silver 2018

 As a general rule, the mostsuccessful man in life is the man who has the best information
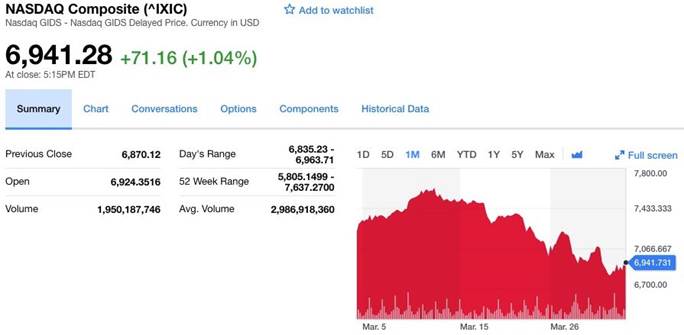
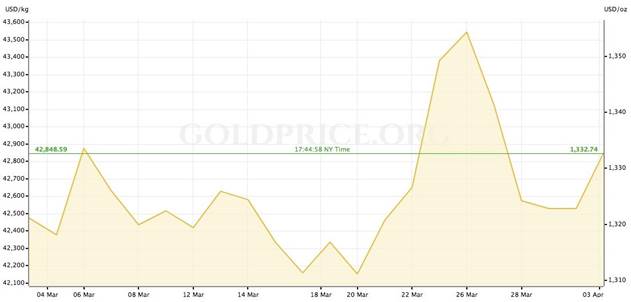
What the heck is going on with gold? The past few weeks have seenglobal equities falling amid a broad selloff in tech stocks, but thetraditional safe haven metal has barely budged, floating along in a fairlytight range of between around $1320 and $1330 an ounce with the exception of aspike to $1354 on March 26 and a slip on March 16 and 20. See the techstock-dominant Nasdaq one-month chart versus one-month gold.
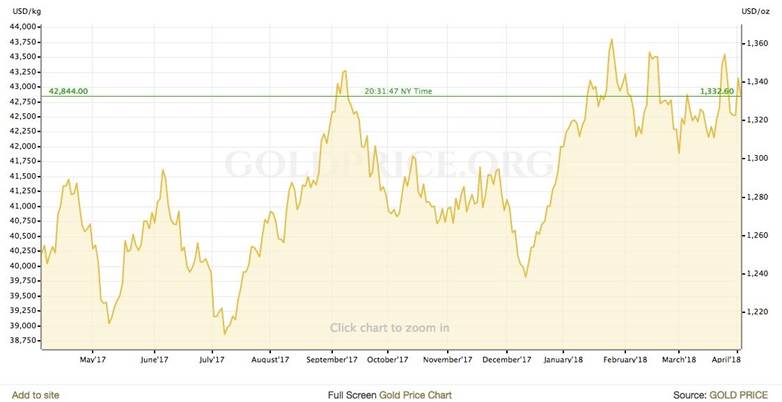
Why isn't gold rising more than it has? On the other hand, withall the good economic indicators that normally cause the precious metal tofall, gold has held its own, climbing steadily from a low of $1208 in July 2017to a high of $1362 on January 25, 2018 – a gain of 12.7%. Despite the rise ofcryptocurrencies which sucked a lot of wind out of its sails, Federal Reserveinterest rate hikes, QE stopped in the US and winding down in Europe and Japan,and cross-the-board global growth, gold still managed to gain 12.5% fromJanuary to December 2017.
Of course the “fear trade” sooften cited by US Global Investors CEO Frank Holmes was well in place lastyear, with low real interest rates (interest rates minus rate of inflation)grinding down government bond yields, a falling US dollar, deficit spending,and geopolitical uncertainty all playing their part in propping gold up. Butarguably due to so much good news going on in the US and elsewhere right now,gold should be getting crushed. But it's not. Why not? This article will try tofind some answers.
Economichealth check
A year ago the global economy was stagnant following the recessionof 2007-09, an overhang from the debt crisis in Europe, and slowing Chinesegrowth which had seen double-digit GDP numbers throughout the 2000s. Accordingto the International Monetary Fund, 75% of the world is now enjoying a fullrecovery. The IMF predicts global growth to hit 3.7% this year, the fastestrate since 2010.
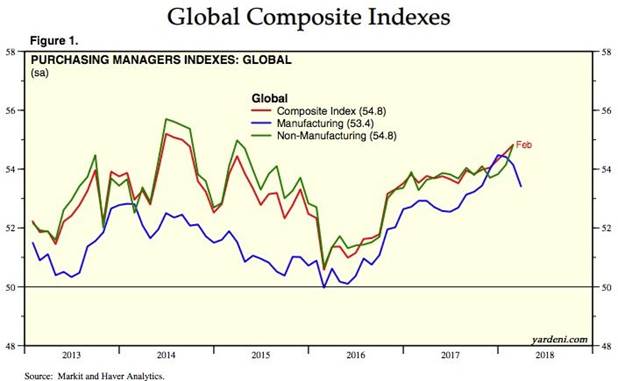
One of the best indicators of economic growth are purchasingmanagers' indices. PMIs are based on monthly surveys of carefully selectedcompanies. They provide an advance indication of what is really happening inthe private sector economy by tracking variables such as output, new orders,stock levels, employment and prices across the manufacturing, construction,retail and service sectors. The latest data from YardeniResearch (see chart below) shows the PMIs for the Global Composite Index(advanced plus emerging economies) at 54.8, with manufacturing and non-manufacturingPMIs not far behind. Any number above 50 is considered an expansion versus acontraction.
China, the world's second largest economy behind the US, saw itsmonthly PMI rise more than expected, from 50.3 in February to 51.5 in March,“as authorities lifted winter pollution restrictions and steel mills cranked upproduction as construction activity swings back into high gear,” reported CNBC.
Shroders, the global investment manager, said this week that dueto rising PMIs, along with business and consumer confidence, global economicactivity is at its highest in seven years. It therefore upped itsglobal growth forecast by to 3.5% for 2018, and predicts 3.3% growth in 2019.Among the factors Shroders cites for its optimism are President Donald Trump's $300 billiongovernment spending package, which “has added fuel to a US and globaleconomy already firing on all cylinders,” Schroders’ chief economist andstrategist says Keith Wade said in an April note.
While the US economy did see a modest pullback in March, accordingto the Institute for Supply Management's non-manufacturing index, the economy alsocreated a better than expected 241,000 more jobs last month. Wall Streetanalysts were only predicting 205,000. Unemployment in the US sits at around4%. Hiring is at its strongest level since 2016, judged by the participationrate – the share of Americans with jobs or seeking one – increasing to 63%,which reflects an 806,000 increase in the labor force statesBloomberg.
All indications are that companies are gearing up for a bannerearnings season, which kicks off in about a week. The passage of a tax reformbill in December which slashed corporate and individual taxes “should give thisyear's earnings a sizeable boost. Its anticipated effect has doubled previousearnings estimates for 2018,” CNBC quotesBrian Nick, chief investment strategist at Nuveen. “Bottom-linegrowth from tax cuts should start to show up in the first quarter.” FactSetanalysts predict an 18% increase in earnings this year.
Oil, another indicator of how well the global economy is doing,has slipped a bit since closing in on $70 a barrel at the end of March, butcontinues to trade above $60, double the lows reached in January 2016. With thelikelihood of trade wars onthe wane despite tit for tat tariffs between the US and China, oil pricesrebounded on April 1. The IEA sees asupply deficit coming, with OPEC cuts still in place, and eventhough US shale producers continue to pump, which would push crude priceshigher.
Thetech meltdown and gold
Of course you'd have to be on vacation for a month withoutInternet access not to notice that global stock markets have been tumbling, ledby a sharp selloff in tech stocks including the “FANG” quartet of Amazon,Facebook, Netflix and Alphabet/ Google. On Monday thetech-heavy Nasdaq index fell 193 points, near a correction,defined as a loss of 10% from a peak. All 11 S&P 500 sectors dropped andeight of them shed more than 2%, with the benchmark US stock market indexclosing below its 200-day moving average for the first time since Brexit inJune 2016.
Trump is partly to blame for the tech selloff, taking aim atAmazon in a series of tweets, saying it shouldpay “billions more” to the US Postal Service for delivering itsonline goods. Trump despises Amazon CEO Jeff Bezos, owner of the Washington Post anespecially aggressive Trump detractor. The spectre of alooming trade war is also holding markets back, with the Dow plunging 500points early Wednesday after China announced new tariffs on 106American product categories including soybeans, planes and cars – seriouslyupping the ante from its previous $3 billion worth of tariffs. The marketslater recovered. China and the US are now each planning around $50 billion inimport duties.
Forbes notes all five USequity averages ended March and the first quarter of 2018 negative, with thecontagion spreading to Japan, China, India and Germany. It would be the firstglobal quarterly fall in stock markets since early 2016.
Gold has been both a benefactor and a victim of market turbulencethis week. Stock market movements and gold prices typically move in oppositedirections, as the historical chartbelow from Sunshine Profits shows.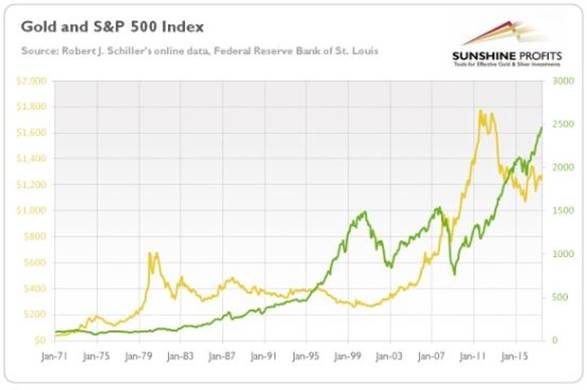
On Monday gold futures rose $11.10 higher to $1338.40 an ounce,with silver also gaining 33 cents to $16.60. Weak equities, a lower US dollar,US-China trade tensions and geopolitical risk including potential US sanctionsagainst Iran were named as factors in gold's rise. Spot gold finished the dayat $1332.90 on Wednesday, almost unchanged from Tuesday and $8 lower thanMonday's stock market selloff. Gold was down in morning trading on Thursday,reflecting rebounding stock markets and a higher dollar, at around $1325 anounce.
Despite the turbulent week, gold bulls have a lot to cheer about,considering the safe haven metal has gained for a third quarter in a row,something it has not managed to do since the heady days of 2011. Volume on theComex, the biggest futures contract, hit 23 million contracts in the firstquarter, while holdings in bullion-backed ETFs reached 2,268.6 metric tons inMarch, the most since 2013. “The hoard has risen about 43 tons this year, theeighth quarterly rise in the past nine,” Bloomberg stated.
Tailwindsfor gold
One of the most important determinants of the gold price is the USdollar, and like gold and stock markets, they usually move in oppositedirections. We can see that trend in comparing a one-year gold chart with a USDchart from the same period.
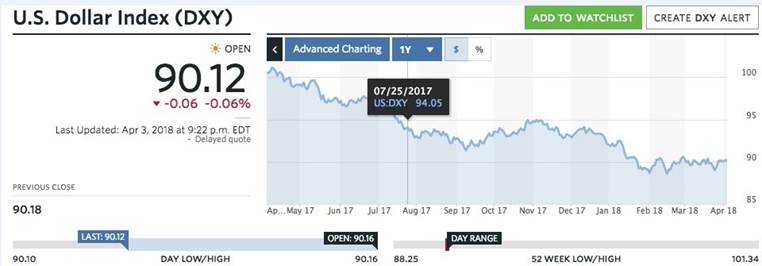
Recently the US dollar index has been hurt by the trade disputebetween the US and China, with a fall in the dollar occurring on Monday afterChina slapped fresh tariffs on the States, following a good last week for thegreenback when it looked like China's response would be more muted (just $3billion worth of tariffs) and Trump decided to exempt the EU, Canada, Mexicoand a few other nations from steel and aluminum tariffs.
Kitcowrote on Monday that gold is likelyto continue to benefit from a low dollar despite rising bond yields. Yields are rising because of aperception that more government spending will require more issuing of Treasurybills (another QE). Usually that means the dollar goes up because the demandfor Treasuries requiring dollars also rises, but foreign demand for safe assetslike the dollar are falling according to analysts at CrossBorder Capital quotedby Kitco. Earlier this year there was a rumor that China was about to lessen orstop buying US Treasuries, causing US bond prices to drop and yields to spike.In fact in January Chinadid scale back its bond purchases,but it is still the largest US bond holder at $1.7 trillion worth ofTreasuries. With a trade dispute in full swing, China could hurt the US bydialling back on more purchases, which would make interest rates on those bondssoar to attract investors – thus hurting individuals and businesses who borrowmoney based on bond rates. On the other hand, China has few options other thanUS T-bills to invest its ample foreign exchange reserves, earned from excessdollars due to its large trade surplus with the US.
Worsening trade deficit
Trump has been talking about unfair trade practices and thewidening gap between imports and exports since his election campaign kickedoff. A plan to do something about the $375 billion trade deficit with China andclosing the deficit gap with its other trading partners is behind the Trumptariffs, and the re-negotiation of NAFTA.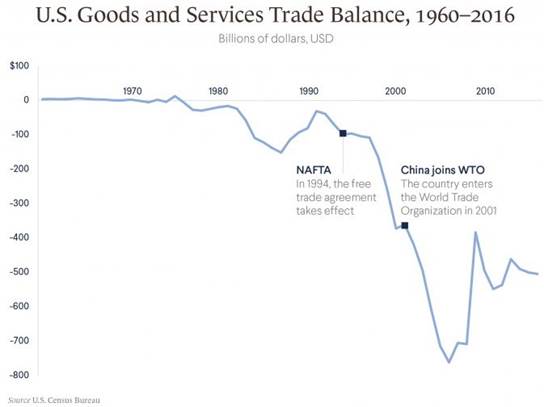
In 2017 the total US trade deficitsoared 12.1% on record imports, reaching $566 billion,the highest it’s been since 2008. Trump believes that cheap foreign imports and“horrible trade deals” have hurt America's competitiveness and costs jobs, forexample in the steel industry. His Administration thinks that closing thedeficit gap and cutting taxes will boost economic growth by an annual 3%,perpetually.
So what's the connection between the deficit and gold? The USdollar index is affected by changes in the balance of trade. If imports aremore than exports (a deficit), there is high demand for foreign currencies topay for those exports, which means an outflow of US dollars. Over time thisleads to a devaluation of the dollar, which of course is good for gold.Therefore, trade deficits are good for gold.
What is the likelihood of the US closing the trade deficit? I'vewritten extensively about this before, and the answer is, “not very likely atall.” I agree with Trump that running tradedeficits is foolish, but the problem is that without a global reserve currency (ie. Acurrency or basket of currencies other than the US dollar), the US willcontinue to run deficits because it is the reserve currency. Why?Because of the Triffin Dilemma,which arises when a national currency also serves as the international reservecurrency. This causes conflicts between a country’s national monetarypolicy and its global monetary policy:
“InOctober of 1959, a Yale professor sat in front of Congress' Joint EconomicCommittee and calmly announced that the Bretton Woods system was doomed. Thedollar could not survive as the world's reserve currency without requiring theUnited States to run ever-growing deficits. This dismal scientist wasBelgium-born Robert Triffin, and he was right. The Bretton Woods systemcollapsed in 1971, and today the dollar's role as the reserve currency has theUnited States running the largest current account deficit in the world.
By"agreeing" to have its currency used as a reserve currency, a countrypins its hands behind its back. In order to keep the global economy chuggingalong, it may have to inject large amounts of currency into circulation,driving up inflation at home. The more popular the reserve currency is relativeto other currencies, the higher its exchange rate and the less competitivedomestic exporting industries become. This causes a trade deficit for thecurrency-issuing country, but makes the world happy. If the reserve currencycountry instead decides to focus on domestic monetary policy by not issuingmore currency then the world is unhappy.
Becominga reserve currency presents countries with a paradox. They want the"interest-free" loan generated by selling currency to foreigngovernments, and the ability to raise capital quickly, because of high demandfor reserve currency-denominated bonds. At the same time they want to be ableto use capital and monetary policy to ensure that domestic industries arecompetitive in the world market, and to make sure that the domestic economy ishealthy and not running large trade deficits.
Unfortunately,both of these ideas – cheap sources of capital and positive trade balances –can't really happen at the same time.” How The Triffin DilemmaAffects Currencies, investopedia.com
My article also addressed the question of whether a global reservecurrency is feasible. It could be, with gold backstopping it just as goldbacked the US dollar until the gold standard was abandoned by President Nixonin 1971. The question being asked right now is whether the US dollar willremain the world's reserve currency (the answer is yes), but the reality isthat there is simply no other currency that would be able to replace it, despite the riseof China's “petro-yuan”, symbolized by China's March launch of anoil futures contract denominated in yuan, or renminbi, and convertible intogold.
According to the IMF, dollar-denominated assets among foreignexchange reserves were at $6 trillion in Q4, a 14% increase from the fourthquarter of 2016 and 42% higher than in Q4 2014. Out of total official exchangereserves held by central banks, two-thirds are US dollars. Euros were second at20% and the yuan represented a measly 1.2%. (see graph below). And if the yuanwere to gain more international standing, the US hasplenty of ways to knock it down:
For example, if Chinachooses to resist Trump’s demands for concessions on trade, the US couldprohibit the renminbi’s use in invoicing or settlements by US businessestransacting with Chinese partners. It could discourage, or establish newbarriers to, investments in renminbi-denominated assets. Or it could offer swapagreements on favorable terms to any central bank that is prepared to abandonits agreement with China. The list of possible punitive actions is long. - ProjectSyndicate
In sum, whether the US continues to be the world's reservecurrency and is therefore obligated to run a deficit, or another, “global” (notnational) currency comes along to replace it, both scenarios are good for gold.In the first case because a deficit means a lower dollar and therefore highergold prices, and in the second case, a world currency would almost certainly bebacked by gold, given the resounding failure of the current monetary system,based on fiat currencies, to avoid global trade imbalances, which are one ofthe major reasons for financial crises. Countries become trapped in a viciousspiral – they accumulate debt because they are sustaining a trade deficit. Thebigger their debt grows year after year, the harder it becomes to generate atrade surplus. Only the countries with a trade surplus have any room to manipulatepolicy; there’s very little debtor nations can do.
Higher debt
Gold loves higher government debt because it typically means thatgovernments need to print more money (Ie. Issue Treasury bills) to service thatdebt and pay for goods services. This also means rising inflation, which sendsequity investors flocking to the safety of bullion. Why? Because gold is notaffected by investments denominated in dollars or other currencies, which losevalue with inflation. Just the hint of rising inflation causes central banks tolook at raising interest rates to cool down runaway prices. Finally, risingdebt also undermines confidence in the economy and worries over whether thegovernment can make its debt payments. Today’s federal debt is $20,493,401,574,964.07. The amount is the grossoutstanding debt issued by the US Treasury Department since 1790 and reported here. And it'sonly going to get worse. According to Newsweek the Congressional Budget Officesays the Republicantax cuts will add more than $1 trillion to the national debt over the nextdecade.
Negative real interest rates
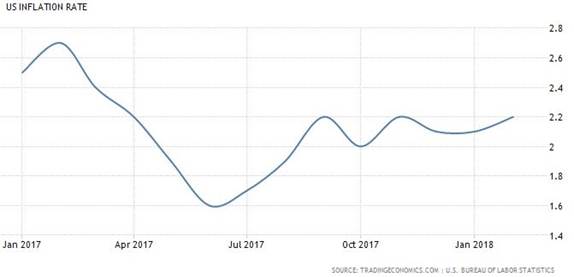
As mentioned one of the key drivers of gold in 2017 was negativereal interest rates, which happens when the inflation rate subtracted frominterest rates (the Funds rate) falls below zero. The graphs below show thatthis trend is continuing. From April 2017 to present, real interest rates havebeen negative: -1.2% in April 2017, 0.4% in July, -0.6% in January 2018, and-0.45% in April 2018.
Because inflation has been shifting upward, moving from 1.6% inthe summer of 2017 to 2.2% currently, investors turned to gold becauseinflation squeezes the yield on government bonds. Bonds tend to sell off wheninvestors believe more inflation is coming. That’s because the yield gets eatenaway by inflation (Eg. you own a 10-year Treasury bill that pays 3%. Ifinflation is 2%, your real return is only 1%.)
Inflation couldclimb even higher, once the effects of Trump's policies are felt throughout theeconomy, such as new tariffs, the withdrawal of the US from the Trans PacificPartnership, a new NAFTA agreement, and $300 billion in new governmentspending. If it does, real interest rates will go even further negative,increasing the appeal of gold.
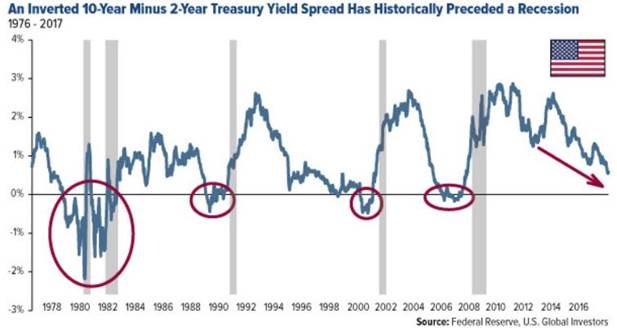
Flattening yield curve
Those concerned about a recession watch the yield curve, which isthe difference between the two-year Treasury yield and the 10-year Treasuryyield. As the two yields move closer together, they are said to “flatten” andwhen the yield curve inverts (Ie. goes below 0%) history shows us that arecession is likely to occur.
In January the spread was around 0.49 – the flattest it's beensince 2007 - as of Tuesday,April 3 it was 0.51. If a recession were to occur gold is a safe place to be. It'salso notable that there is a strong correlation between bond yields and stockprices. Rising bond yields pressure stock prices. "Bond king" JeffreyGundlach told CNBC Wednesday that he thinks stocks will endthe year in negative territory due to rising yields on government debt and theslump in cryptocurrencies, whose rise correlated with the stockmarket top in 2017 and whose fall could be a harbinger for lower equity prices.
CNBC reported a 2.63% yield on the benchmark 10-year Treasury notemarks “a line in the sand” for stocks, which are currently in correctionterritory. “The stock market can’t take higher bond yields,” said Gundlach. The10-year yield was at 2.8% on Wednesday. A continued stock market correction wouldclearly be good for gold.
ETF inflows
Another strong factor supporting gold right now is investorspiling into so-called “paper gold” aka gold ETFs. According to the World GoldCouncil, gold-backedexchange traded funds added 197.5 tonnes to their holdings in 2017, a gain of8.4% from 2016.
In December the world's largest gold ETF, the SPDR Gold Trust ETF(GLD) rose for 11straight days before finally turning red, its longest rally sinceit started in 2004 that many probably missed as they were focusing on themeteoric rise of crypto instead.
The ETF party continued into 2018 with GLD seeing steepinflows at the end of January, corresponding with aJan. 25 gold price high of $1362 an ounce. The fund saw $873.6 million flowinto it that week, which represented nearly half of the $1.99 billion ininflows from the preceding 12 months.
Hedge funds arejumping back into gold, Kitco reported on Monday, the day thestock markets sold off. The precious metals site noted that after four weeks ofselling, hedge funds were buying again.
The CFTC’s disaggregated Commitments of Traders report for theweek ending March 27 showed money managers increased their speculative grosslong positions in Comex gold futures by 34,928 contracts to 183,080. At thesame time, short bets fell by 15,428 contracts to 20,917. Gold’s net lengthincreased to 162,163 contracts.
The data show that the gold market saw its most significant shiftin bullish sentiment in nearly two years. Gold’s net length jumped 45% from theprevious week. The strong buying momentum pushed prices up by more than 2%during the survey period, hitting a five-week high.- Kitco
Central bank buying
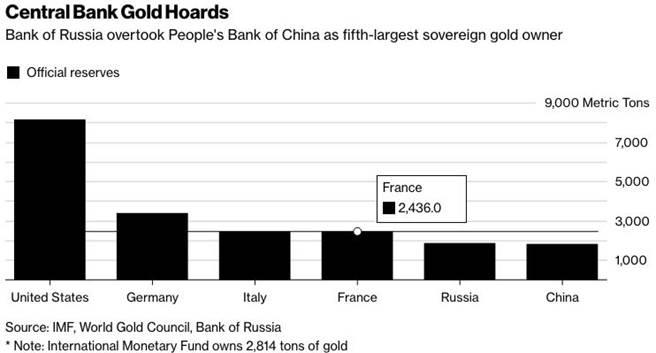
How about central bank buying? Central banks buy gold as a storeof value and to purchase hard currencies like the US dollar which mostcommodities are priced in. In February Russia overtook China's central bankgold hoard, with both countries running close gold tonnages, at 1,857 for theBank of Russia versus 1,843 for the People's Bank of China. It makes sense forRussia to hoard gold that it can convert into other assets besides the USdollar, in order to skirt sanctions.
Bloomberg said that Russia hasincreased its holdings every month since March 2016, while Chinalast reported buying gold in October 2016. Both nations however are nowhereclose to the amount of gold owned by the US central bank, which reportedly has8,134 tons.
Gold demand
Demand for goldactually slipped in 2017 as global investors turned to stocksinstead of bullion and assets with lower growth potential. But it was a differentstory for physical gold, with demand for gold jewelry up 4% from 2016; 10% inIndia alone.
The demand for physical gold in the form of coins and bars was ledby China, which according to the World Gold Council purchased 306.4 tonnes in2017 – 8% higher than the previous year. These officials figures however arelikely way off the real total. Sharps Pixley analyst Lawrie Williams haswritten that actual Chinesegold consumption is probably at least 50% higher than the WGC figures, with Chinesegold imports from Hong Kong last year totalling 628.2 tonnes and 299.8 tonnesimported from Switzerland. “China’s own gold output during the year was,according to the [Chinese Gold Association], 426.14 tonnes, so from thesesources alone China will have absorbed 1,354.1 tonnes of gold.” Williams notesthis doesn't include yet to be revealed figures from the UK, the US, Australiaand Russia. China for the 11th year in a row was the world's biggestgold consumer.
Supply squeeze
More a long-term issue than a current factor in the strength ofgold prices, the mined supply of the precious metal is shrinking as most of the“low-hanging fruit” has been mined and the rest is either in remote locationsor buried deep in the earth, meaning higher extraction costs.
“Production is coming off, and that means the upward pressure onthe gold price could be very intense,” Cambridge Houserecently quoted Pierre Lassonde, chairman ofFranco-Nevada, on the matter of declining gold supply.
Goldcore said last year that “peak gold” was “the biggestgold story not being reported,” noting that 2016 wasthe first year that mine production fell since 2008. It's a view shared byRandall Oliphant, chairman of the World Gold Council, who told Bloomberg in Septemberthat “Production is likely to plateau at best...”
Indeed in February, the WGC in its annual gold trends report saidthat total goldsupply slipped in 2017 to 4,398 tonnes – a drop of 4% from2016. Mine production was about the same as last year, 3,268.7 tonnes, butrecycled gold fell 10% to 1,160 tonnes. Key gold producers that saw drops lastyear were China and Tanzania.
Tightening gold supply will feed into higher prices as long asdemand factors hold. Stephen Letwin, CEO at Iamgold, believes it could happensooner than later. Speaking at a mining conference in Hong Kong this week,Letwin said gold prices are set to climb due to a lack of exploration andmajors failing to replace the ore they've mined. Iamgold however is exploringnear existing mines as well as ramping up production in Canada.
“Gold has a much higher probability of moving north as opposed tosouth,” he was quotedsaying. “I’ve been around a long time; when you’re in an industry that’snot replacing what it produces, eventually, the price has to move up.”
Conclusion
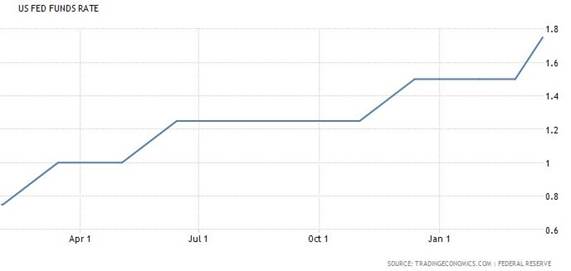
The preceding analysis should give readers a better sense of whygold continues to show resilience in the face of some fairly strong headwindsin the form of high economic growth, robust purchasing managers indices, oilprices north of 60 dollars, and a US economy that continues to do well, despitethe recent pullback in stock markets particularly tech stocks. Fear may havedissipated among investors as they enjoyed a long bull run in stocks, but it isreturning in the form of negative real interest rates – a key driver for gold.As global growth stokes inflation, interest rates are creeping up, making bondyields less of a deal and gold more attractive. And while no-one wants to utterthe “R” word, the flattening yield curve is a sign that the US economy may notbe in that great a shape after all, which is good for gold. Rising bond yieldsmean that the demand for US Treasuries is falling (bond prices and yields movein opposite directions) and signal that inflation is coming, which in turnmeans higher interest rates and pressure on stock prices since the cost ofborrowing for companies increases. The Fed has stated it expects to raise ratesthree times this year and two in 2019. The last increase, on March 21, was thesixth time the Fed raised rates since December 2015.
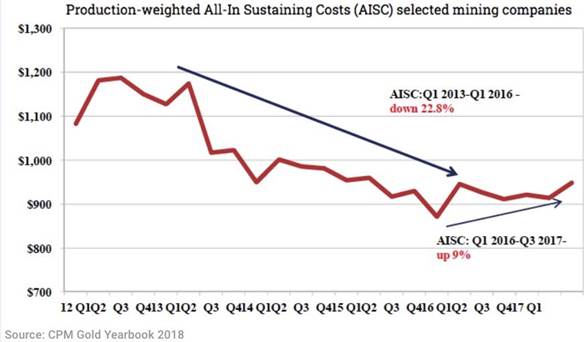
Also front and center in the gold price behaviour of late is thefalling US dollar. Among the factors are a decrease in the demand for UST-bills and less confidence in the greenback due to fears of an escalatingtrade dispute with China. Gold has been the benefactor of a lower US dollar andwill continue to be, as long as the United States continues to run a tradedeficit – something I have argued the US cannot avoid if it wishes to maintainthe dollar's position as the world's reserve currency. Gold ETF inflows andrising physical gold demand in the form of jewelry, coins, bars and centralbank buying – particularly from China and Russia, have also bolstered the goldprice. A tighter market for mined supply should also see gold holding uplonger-term, which will be good for junior gold explorers as the major goldminers look to them to find new deposits which are rapidly depleting. Prettysoon all the high-graded material will be gone and the majors will be left withlower-quality ore. Their margins look good now, but their financial picturescould change drastically when that starts happening. Already we can see thatgold mining costs are back on the rise after falling in step with lower goldprices, reaching a bottom in the first quarter of 2016, not coincidentally thesame time that the gold price bottomed out. The CPM Group in its 2018 GoldYearbook reports that all-in-sustainingcosts are up 9% between Q1 2016 and Q3 2017. They were down 22.8%between Q1 2013 and Q1 2016.
I'm pleasantly surprised to see gold doing so well in a generallyexpansive economic climate, and I'll be keeping an eye on mining companyearnings when they start trickling out soon. This should give a good sense ofwho the potential acquirers might be and who needs to sell assets to raisecash. Do you have the purchase of physical gold and a selection of good goldcompanies on your radar screen?
If not, maybe it should be.
By Richard (Rick) Mills
If you're interested in learning more about the junior resource and bio-med sectors please come and visit us at www.aheadoftheherd.com
Site membership is free. No credit card or personal information is asked for.
Richard is host of Aheadoftheherd.com and invests in the junior resource sector.
His articles have been published on over 400 websites, including: Wall Street Journal, Market Oracle,USAToday, National Post, Stockhouse, Lewrockwell, Pinnacledigest, Uranium Miner, Beforeitsnews, SeekingAlpha, MontrealGazette, Casey Research, 24hgold, Vancouver Sun, CBSnews, SilverBearCafe, Infomine, Huffington Post, Mineweb, 321Gold, Kitco, Gold-Eagle, The Gold/Energy Reports, Calgary Herald, Resource Investor, Mining.com, Forbes, FNArena, Uraniumseek, Financial Sense, Goldseek, Dallasnews, Vantagewire, Resourceclips and the Association of Mining Analysts.
Copyright © 2018 Richard (Rick) Mills - All Rights Reserved
Legal Notice / Disclaimer: This document is not and should not be construed as an offer to sell or the solicitation of an offer to purchase or subscribe for any investment. Richard Mills has based this document on information obtained from sources he believes to be reliable but which has not been independently verified; Richard Mills makes no guarantee, representation or warranty and accepts no responsibility or liability as to its accuracy or completeness. Expressions of opinion are those of Richard Mills only and are subject to change without notice. Richard Mills assumes no warranty, liability or guarantee for the current relevance, correctness or completeness of any information provided within this Report and will not be held liable for the consequence of reliance upon any opinion or statement contained herein or any omission. Furthermore, I, Richard Mills, assume no liability for any direct or indirect loss or damage or, in particular, for lost profit, which you may incur as a result of the use and existence of the information provided within this Report.
© 2005-2018 http://www.MarketOracle.co.uk - The Market Oracle is a FREE Daily Financial Markets Analysis & Forecasting online publication.