Gold Falls And Sits At The $1,300 Level
The dollar and rates were too much for the yellow metal.
Gold declines, but it has not tanked.
A seasonal move?
The critical levels for gold.
A buy when it looks the worst.
In 2016, gold traded at its lowest level for the year on the first session in early January. The price traded at a low of $1061 on that day and never looked back closing the year at the $1152 per ounce level. In 2017, we witnessed the same type of price action with gold trading at a low of $1146.50 on the first day of the year which turned out to be the low. Gold closed 2017 at the $1305.10 level.
In 2018, gold traded at $1304.60 during the first week of January. The January nadir stood as the lowest price for the year until late February when it fell to a bottom of $1303.60, marking the first time the yellow metal moved lower than at the beginning of the year since 2015. The pattern of trading this year in the gold market has deviated from past years. While the pattern of higher lows since late 2015 remains intact on medium-term charts, gold was trading below the $1300 per ounce level last week, declining below the psychological level for the first time in 2018 in mid-May.
The dollar and rates were too much for the yellow metal
The rate on the 10-year Treasury busted through the 3% level, and the 30-year long bond fell to a new low over recent sessions. 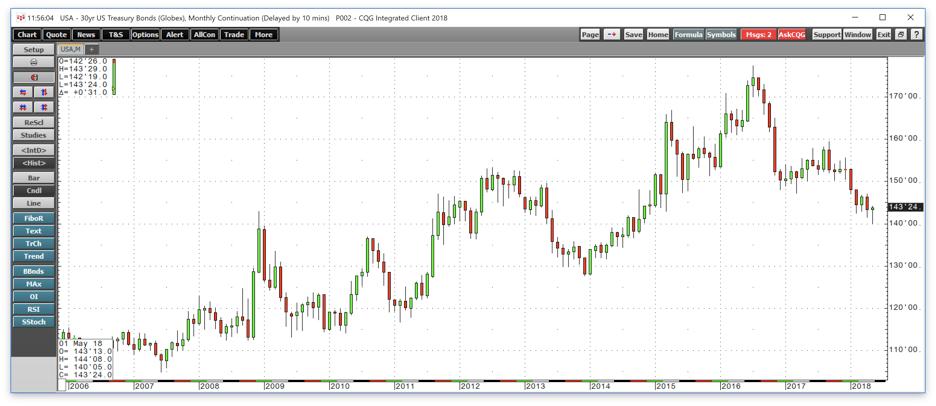
Source: CQG
As the monthly chart shows, the long bond declined to a low of 140-05 on the June futures contract recently, which is the lowest level since October 2014. Increasing interest rates makes the cost of carrying long positions and inventories of commodities higher. In the gold market, it increases the contango or forward premium in the gold futures market which tends to weigh on the price of the yellow metal. Higher real rates are typically a bearish factor for gold.
At the same time, higher rates have provided support for the dollar which continues to recover, making another new short-term high at 94.19 on Friday, May 25. 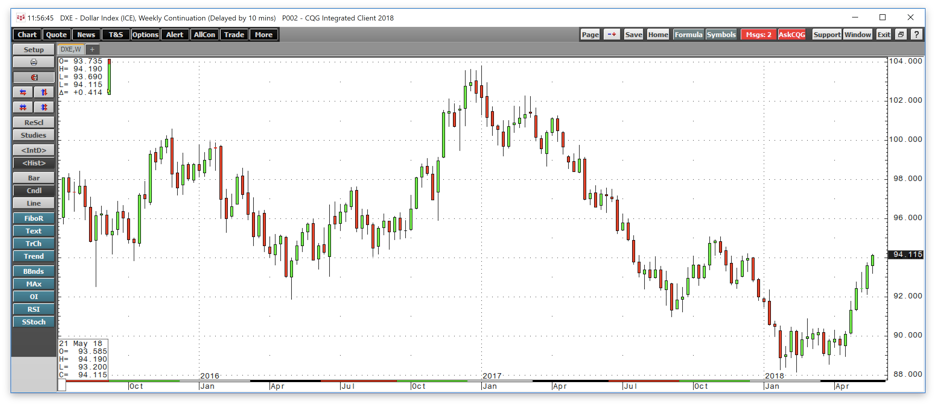
Source: CQG
As the weekly chart of the U.S. dollar index highlights, the greenback index is at over the 94 level as it works its way towards the level of critical technical resistance at the November 2017 high of 95.07. The dollar has recovered from lows of 88.15 in February, and a stronger dollar tends to have a bearish influence on the prices of gold and many other commodities. The rise in the dollar and decline in bonds turned out to be too much for gold to handle and the yellow metal moved below the $1300 per ounce level and to a new low for the year at $1281.20 on Monday, May 21.
Gold declines, but it has not tanked
After trading to a high of $1365.40 during the week of April 9 on the continuous COMEX futures contract and $1369.40 on the active month June contract, gold turned south and moved down to new lows for 2018. 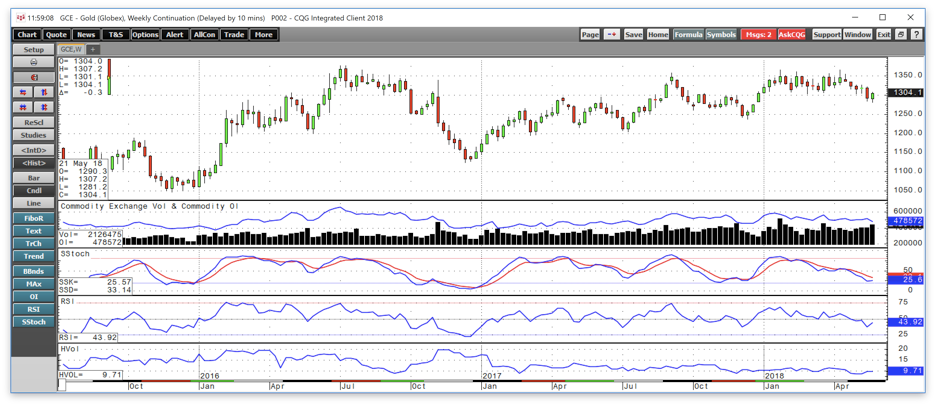
Source: CQG
As the weekly chart illustrates, the next technical level for gold stands at the December 2017 low at $1236.50 per ounce. To keep the bullish pattern of higher lows since December 2015 in place, gold will need to find a bottom above this price. The price action in gold has been negative given the dollar and rates, but we have not seen any plunge in the yellow metal which has eased to the downside. At the same time, the price of silver did not make a new low for this year and remains around the $16.57 per ounce level as of May 25. Gold fell to a low of $1281.20 on May 21 and turned higher later in the week closing above the $1300 level on May 25. Open interest or the total number of open long and short positions in the COMEX futures market declined to 478,572 contracts on May 24 from 513,158 on May 18 as some traders closed risk positions. The momentum indicator is declining towards an oversold condition. While it has not turned higher on the weekly chart after the price recovery, any further price increases in gold would shift momentum higher. Relative strength for the gold price is in neutral territory on the weekly chart.
A seasonal move?
Over the past three years, gold made lows in December. In 2015 it fell to $1046.20, and the following year the low was at $1123.90. During the final month of 2017, the bottom was at $1236.50 per ounce which is the next level of support for the yellow metal. Meanwhile, on the weekly chart, it shows that gold experienced downside corrections in May and June 2017. The Brexit referendum in 2016 caused the price of the precious metal to quickly recover in 2016 reaching a high in early July. Last year, gold declined from early June through mid-July before finding a short-term bottom and recovery. The selling in gold follows a pattern of season selling at this time of the year. The dollar and rates have exacerbated the selling as gold has broken a pattern that was in place throughout 2016 and 2017. Even though we witnessed seasonal selling over the prior two years, gold never traded below its lowest price for the year, but 2018 is a different story in the gold market.
The critical levels for gold
The critical technical support and resistance levels in the gold futures define a range of $141 per ounce. On the downside, the level to watch is $1236.50, the December 2017 low that we must hold to keep the bullish price action intact. On the upside, the post-Brexit July 2016 high at $1377.50 stands as a bullish line in the sand for the precious metal. Gold made three attempts at the highs so far this year, but each failed. We saw highs at $1365.40 in late January and early April which now stands as a double top for the price of gold. Any move above that price would likely ignite lots of speculative buying.
The geopolitical landscape continues to provide support for the metal that is a barometer for risk and uncertainty in the world. The situation in the Middle East has deteriorated following President Trump's decision to walk away from the nuclear nonproliferation agreement with Iran. Additionally, the proxy war between Saudi Arabia and Iran continues to rage on, causing the price of oil to trade at the highest price level since 2014. Higher oil is an inflationary factor for the global economy which is another bullish factor when it comes to the path of least resistance for the price of gold. The off-again, on-again summit between President Trump and North Korean leader Kim Jong-un could also cause volatility in the gold market over coming days and weeks.
A buy when it looks the worst
I have been trading the yellow metal since the early 1980s and have participated in bull markets, bear markets, and dead markets where the price hardly moved for years. The most significant lesson I learned over those years has been that looking for the big move or break to the up or downside is an extremely low odds play. Gold has a habit of looking its best when it is at or close to a high. Conversely, it looks worst and like it is going to fall precipitously when it is close to or at a bottom. The price action in gold has been frustrating lots of gold bulls over recent weeks who probably got nervous as the price moved to a new low for this year. I remain friendly to the gold market so long as it can remain above the December 2017 low at $1236.50 per ounce. Rather than buying gold these days, I am looking to buy GDX and GDXJ or the leveraged ETN products NUGT or JUNG on price dips in the gold market on a scale-down basis. I would stop out of any long positions if the price of gold were to fall below last December's low. 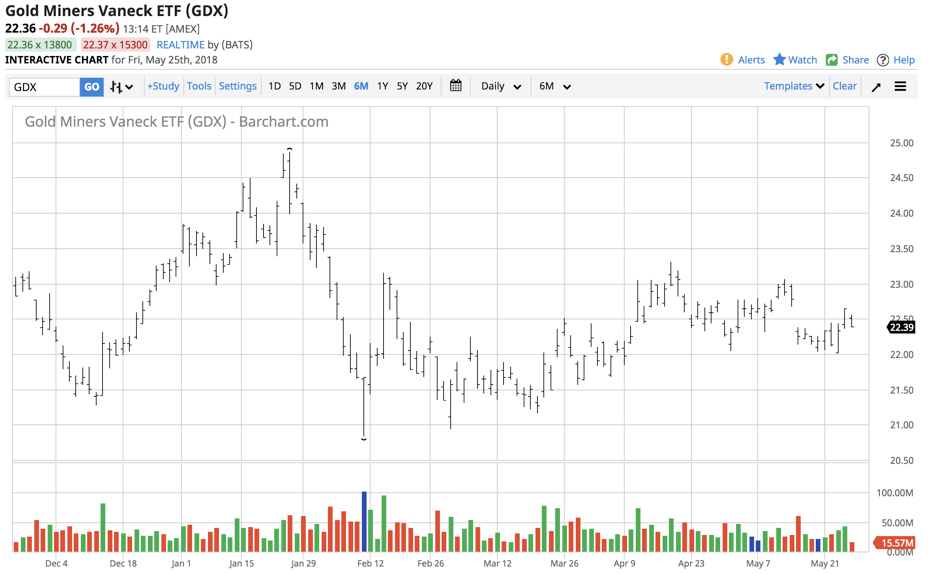
Source: Barchart
While gold continues to trade at its lowest level of this year, GDX and the other three products remain above their February 9 lows. Gold mining stocks dropped in sympathy with all equities in early February, but I find it impressive that new lows in the yellow metal did not translate to lower levels in these instruments.
Gold mining stocks often magnify moves in the gold market on the upside, and if the current short-term trend in the yellow metal finds a bottom and starts to recover, I expect these vehicles will outperform the price action in the gold market. While higher energy prices are causing an increase in the cost of producing an ounce of gold, mining stocks are traditionally more volatile than the metal they produce and tend to move more on a percentage basis during rallies and price recoveries.
Gold fell below the $1300 per ounce level, but it is not a falling knife. I am bullish on the prospects for the precious metal and will reconsider if it breaks the pattern of higher lows that has been in place since December 2015.
The Hecht Commodity Report is one of the most comprehensive commodities reports available today from the #2 ranked author in both commodities and precious metals. My weekly report covers the market movements of 20 different commodities and provides bullish, bearish and neutral calls; directional trading recommendations, and actionable ideas for traders. More than 120 subscribers are deriving real value from the Hecht Commodity Report.
Disclosure: I/we have no positions in any stocks mentioned, and no plans to initiate any positions within the next 72 hours.
I wrote this article myself, and it expresses my own opinions. I am not receiving compensation for it (other than from Seeking Alpha). I have no business relationship with any company whose stock is mentioned in this article.
Additional disclosure: The author always has positions in commodities markets in futures, options, ETF/ETN products, and commodity equities. These long and short positions tend to change on an intraday basis.
Follow Andrew Hecht and get email alerts