Gold Benefiting From Copper, Euro Strength
Strengthening copper price and euro currency pave the way for higher gold.
Copper miner FCX is also an important leading indicator for gold.
Weight of technical evidence still bullish for the yellow metal.
Gold remained stable on Thursday near a 3 1/2 -month high as traders took profits after the recent run-up. Skeptics believe the gold rally was purely technical and has largely run its course, but in today's commentary we'll see why the skeptics are likely premature in their bearish sentiment. We'll also take a look at two important leading indicators for gold and gold mining stocks and what their message is for the near-term outlook.
Spot gold rose 0.5 percent to $1,319 on Thursday, while February gold futures settled $3.10, or 0.24 percent, higher at $1,321. Silver meanwhile rose 0.3 percent at $17.18 after earlier hitting an eight-week high at $17.26.
On a short-term basis, continued weakness in the U.S. dollar index (DXY) has been one driver behind gold's rally. The dollar hit a four-month low against the euro against a backdrop of optimism about the euro zone economy. A more important driver behind the gold rally, however, is euro currency strength. European investors appear in my view to be keener on buying gold right now than the average American investor, thus it should come as no surprise that gold seems to be tracking euro currency strength more than dollar weakness.
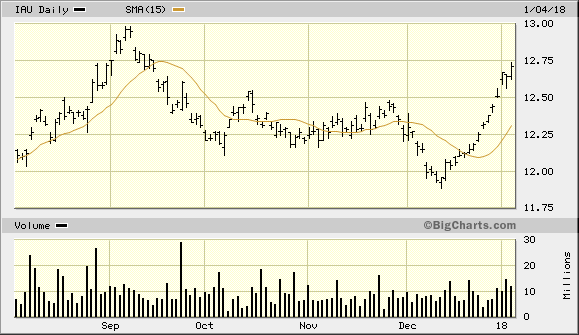
My favorite tracking fund for gold, the iShares Gold Trust ETF (IAU), rose 0.55% on Thursday and decisively made a 3 1/2 -month high in outperforming the physical metal. This was in line with the latest strength in the Currency Shares Euro Trust ETF (FXE), which rose by 0.50% for the day. The close connection between gold and the euro of late shouldn't be underestimated, and it's one important factor that skeptics of the gold rally are overlooking.
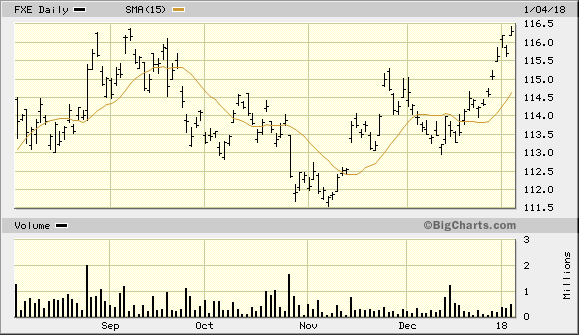
Source: www.BigCharts.com
Another important factor underlying the current gold market is the price of copper. Copper has long been a leading indicator for the yellow metal and has led the gold rally at every step since early December. Currently the price of copper is at a 52-week high and remains above its rising 15-day moving average on a closing basis. This informs us that the immediate-term (1-4 week) trend for copper is still up and so, too, is gold's immediate trend by extension.
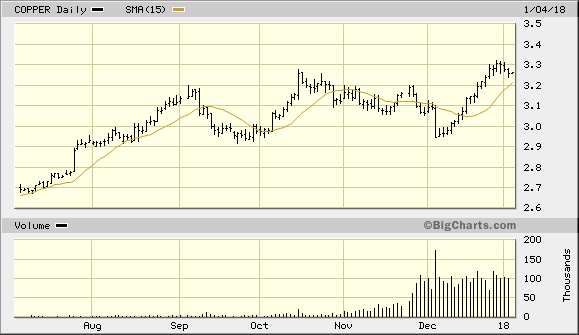
Source: www.BigCharts.com
It's not hard to see the connection between the rising copper price and the recent improvement of the euro currency. As the euro zone and the emerging markets continue their economic recoveries, industrial demand for copper has increased. Not without reason is copper considered to be one of the most important indicators of economic strength.
While we're on the subject of copper, let's turn our attention to an even more sensitive leading indicator for both gold and the PHLX Gold/Silver Index (XAU). The share price of Freeport-McMoRan Inc. (FCX), the world's second largest copper producer, not only tends to lead the XAU index, but also sometimes even physical copper itself. FCX also has exposure to gold and molybdenum mining, which makes it a valuable indicator for the actively traded metals mining stocks as a group. By tracking the price trend of FCX you can often get a "heads up" on where the XAU index is headed in the near term. A good rule of thumb is that a rising trend in FCX will either confirm gold stock market strength, or else precede it.
The following graph shows that FCX was showing relative strength versus both the copper price and the XAU index in early December at a time when the precious metals and mining stocks in general were experiencing selling pressure. Subsequently, the FCX price line exploded to a 2-year high and continues to lead copper and gold, as well as the gold mining stocks. As long as FCX remains above its 15-day moving average, traders should assume that the bulls are in control and that gold/gold stocks will continue to trend higher.
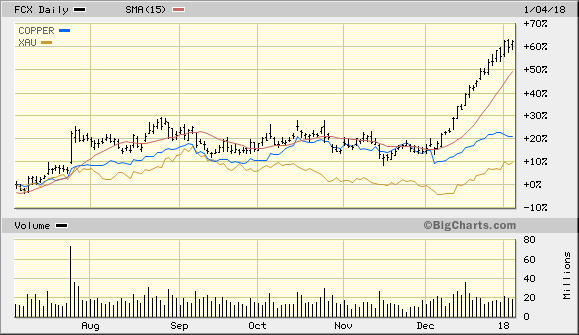
Source: www.BigCharts.com
Meanwhile, the mining shares as a group are still in good shape as can be seen in the following graph. This features the primary short-term directional components of my gold stock internal momentum (GOLDMO) index, which is based on the 10-week new highs and lows of the 45 most actively traded gold stocks. The graph shown here measures the 4-week rate of change of those new highs and lows and is a good reflection of the incremental demand for gold stocks in general. Note also that the directional indicator has just entered positive territory for the first time in several months, which is also a good sign.
A rising short-term directional indicator suggests that the near-term path of least resistance for gold stock prices is up. Therefore as long as this indicator is rising I recommend that traders maintain a long position in the VanEck Vectors Gold Miners ETF (GDX), using the 22.80 level as the stop-loss on a closing basis.
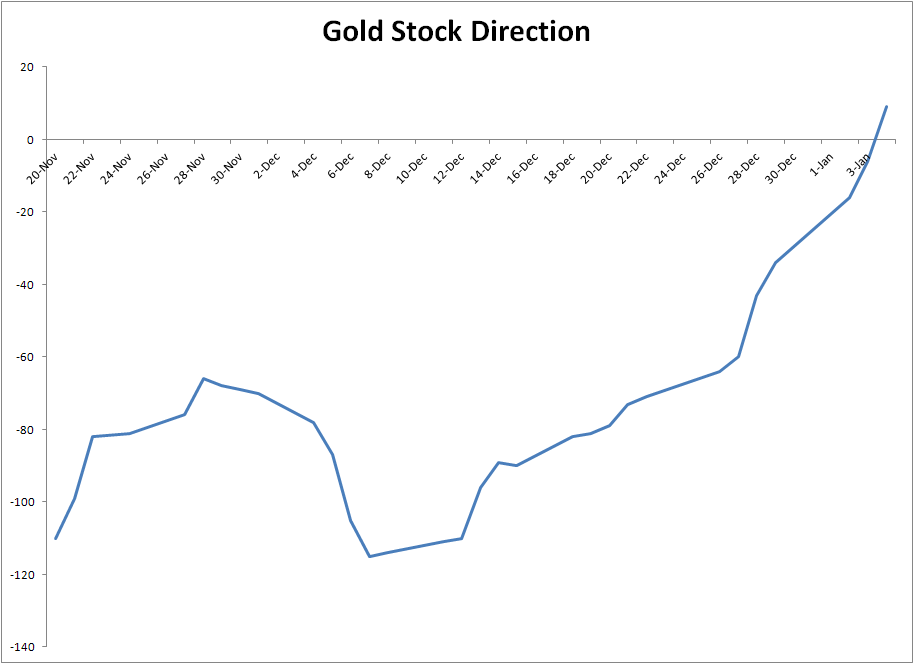
Chart created by Clif Droke
In my previous commentary, I recommended that technical traders book some profit in gold following the 5% rally from the confirmed immediate-term buy signal on Dec. 21 (per the rules of the 15-day moving average trading method). To reiterate, the rules of this discipline state that the first profit in a newly established long position should be taken whenever the price rallies by 4-to-5% from the initial entry point. In gold's case, this equates to the $1,320-$1,333 area. For the iShares Gold Trust ETF (IAU) the 5% area would be approximately $12.75-$12.80. February gold reached an intraday high of $1,323 on Jan. 2, which means that the minimum upside objective of the immediate-term (1-4 week) trading positions has been realized.
Source: www.BigCharts.com
I also recommend raising the stop loss on existing long positions to slightly under the $1,288 level in February gold, which is where the 15-day moving average is currently found in gold's daily chart. For long positions in IAU, the stop loss should be adjusted to slightly under the $12.30 level where the 15-day MA currently is found in the daily chart. From here on, the 15-day moving average will serve as our guide for progressively raising the stop loss on our long position in IAU.
Disclosure: I am/we are long IAU, GDX.
I wrote this article myself, and it expresses my own opinions. I am not receiving compensation for it (other than from Seeking Alpha). I have no business relationship with any company whose stock is mentioned in this article.