Gold At Critical Level, Is It A Break Or A Bounce?
Gold fell to the predicted level of the prior article.
In the past three months, Turkish banks have cashed out gold reserves worth $4.5 billion.
Gold shall have a bullish rise till the 161.8% fibonacci resistance level at $1,242.18.
In my last article, I was bearish on Gold (GDX, ASA) as I expected it to have a sharp descent. This came true as the yellow metal last week fell till the $1,176 mark. After reaching this level, the bulls tried to recoup some of the losses made, which resulted in the commodity closing the week at $1,199. Hence, in this article, I shall ascertain the possibility of Gold shaking off the weak hands with a sideways pattern after which we shall have a bullish breakout. To establish the likelihood of this occurring, I will look at the fundamental developments affecting the yellow metal, whilst also analysing the charts using technical analysis tools.
Fundamental news:
Trade Tensions:
The recent sell off in Gold occurred due to do trade tensions between China and America, which resulted in traders buying the US Dollar. This is due to traders believing that the United States stood a lower chance of suffering from the trade war. However, I believe that sentiment has changed due to President Donald Trump announcing fresh tariffs of 10% on $200 billion worth of Chinese imports. This move by President Trump has resulted in the trade war casting a shadow on the outlook of the US Dollar. Moreover, the negative outlook on the Greenback has been amplified by news that Beijing may decline to partake in any trade talks with America.
Turkish Lira:
In the past three months, numerous Turkish banks have cashed out their gold reserves worth $4.5 billion. This was undertaken as it shall help the banks and the country in preventing a liquidity crisis from occurring due to the nosediving Turkish Lira. Moreover, this high level of Gold dumping has been one of the catalysts that have placed a bearish pressure on the commodity over the past few months. However, as Turkey has now halted the sale of its Gold reserves, thus, we can expect this to severely weaken the bearish momentum thus allowing the bulls to re-enter the yellow metal.
US Retail Sales:
The US retail sales figure for August fell below expectations as it's rise was the lowest seen in the prior six months. The retail sales value stood at 0.1% against an anticipated value of 0.4%. This was primarily due to consumers cutting back on clothing and automobile purchases. Moreover, the report suggests that elevated fuel prices could be the reason of the drop-in retail sales, as it is pulling away expenditure from other categories. This supports my view that Gold shall be now strengthening against the US Dollar due to hints of weakness forming in the American economy.
Technical Analysis:
Daily Chart:
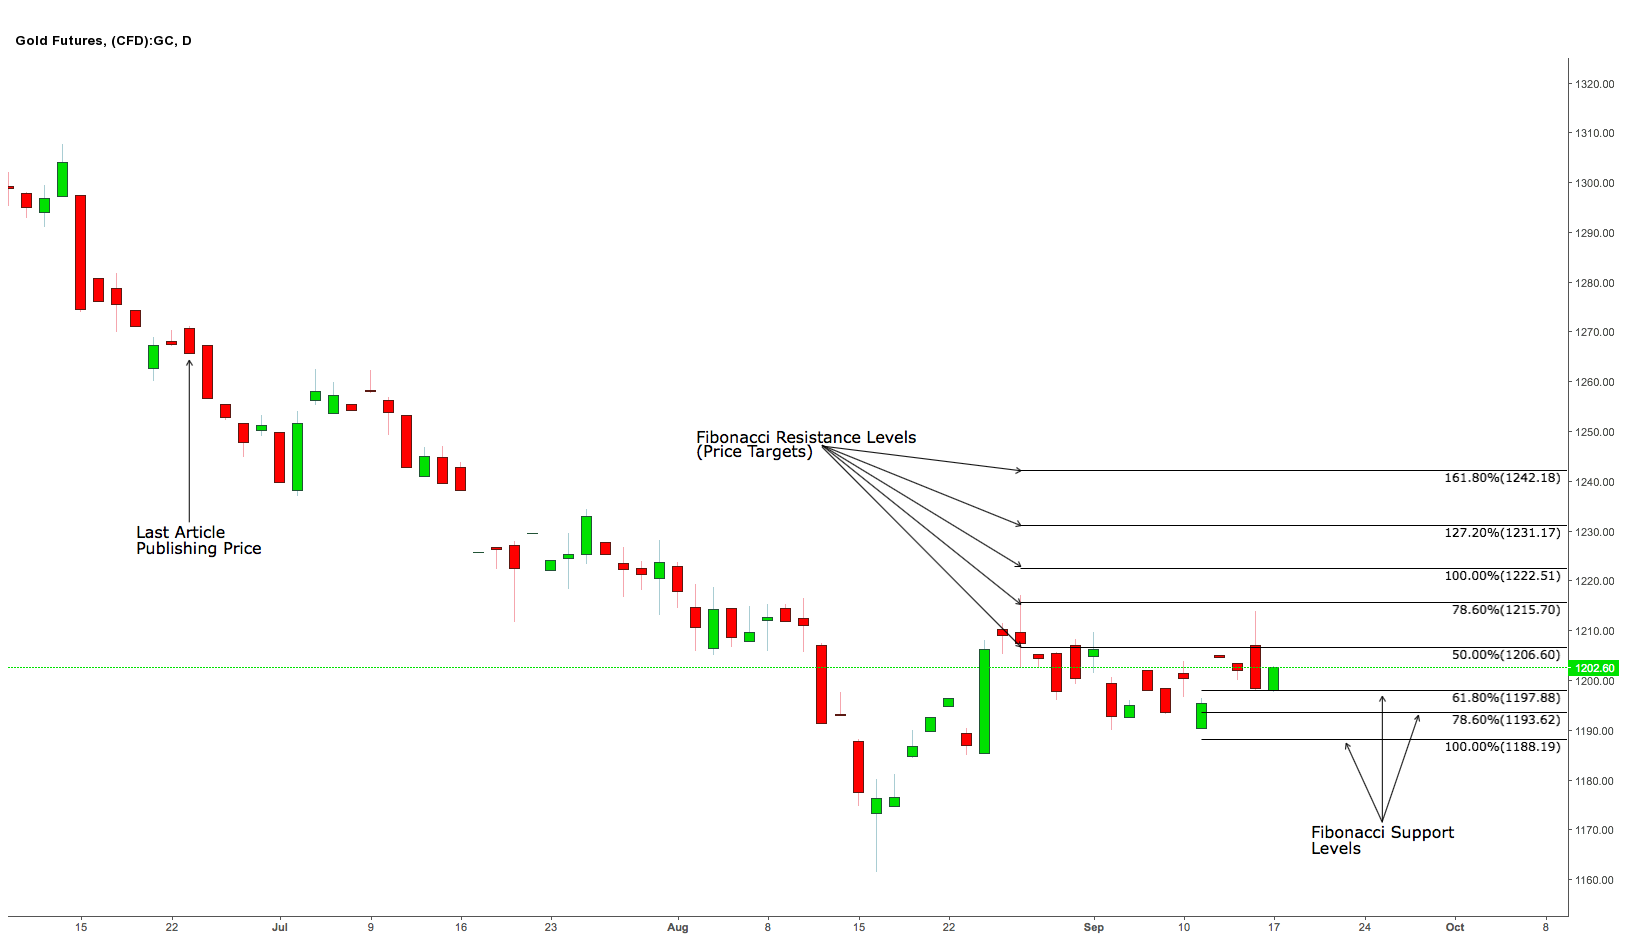 The commodity's daily chart has formed a bullish Harami candle pattern. The first red candle in the pattern indicates to traders that the bears are in control. However, the next candle's real body reflects to traders that the bears have lost momentum. Moreover, the final nail in the bear's coffin was put by the 20-day moving average as it has provided support to the current candle pattern. Furthermore, the commodity has currently also taken support from the 61.8% level at $1,197.88. However, we can expect three to four days of sideways trading before a bullish breakout occurs.
On the indicator facet, the RSI has just ascended above the 60 mark thus supporting the notion that the yellow metal shall be having an upwards movement. Moreover, the ADX settings have perched between the range of 35 and 37, thus, indicating to investors that the bullish trend strength is sturdy.
On the price target front, I do not expect Gold in the short term to extend its rise beyond the 127.2% to 161.8% level. This is due to these levels being a prior falling window's resistance lines. The 127.2% resistance level is at $1,231.17, whilst, the 161.8% resistance level is at $1,242.18. Moreover, the 100% resistance level is at $1,222.51.
Weekly Chart:
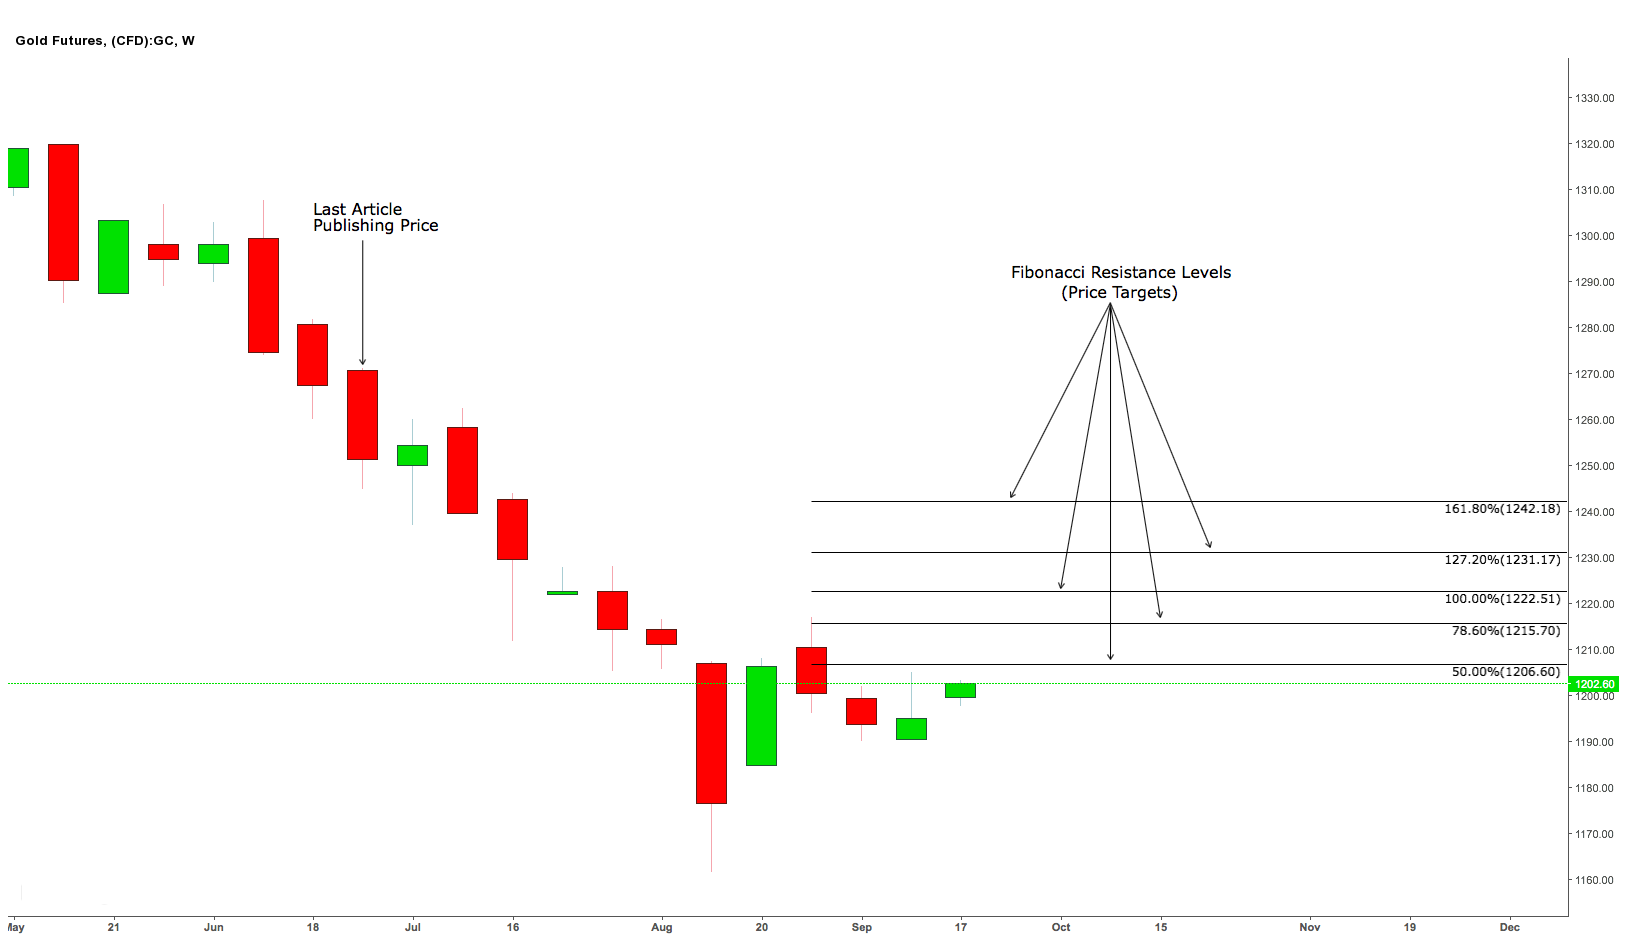 The commodity's weekly chart shows that Gold has been trading in a box range pattern for the prior four weeks. However, it shall now be breaking out of this box range pattern due to the formation an inverted hammer candle which has received bullish confirmation in the following week. This candle pattern's psychology indicates to traders that after the last burst of selling, new buying has commenced. However, for the inverted hammer pattern to be effective, it ought to receive a bullish confirmation, which did occur in the following week. This clearly indicates that a bullish reversal is on the cards. I expect the commodity to extend upwards till the 161.8% fibonacci resistance level at $1,242.18.
The Big Picture:
In conclusion, I am leaning towards the bulls being in the driver's seat until the $1,242.18 mark. This notion of mine is fuelled by the fact that the technicals and fundamentals support an ascent. However, whichever way you do decide to trade, do ensure that you utilize trailing stops, as this shall aid in capital preservation which is of prime importance.
Good luck trading.
Disclosure: I/we have no positions in any stocks mentioned, and no plans to initiate any positions within the next 72 hours.
I wrote this article myself, and it expresses my own opinions. I am not receiving compensation for it (other than from Seeking Alpha). I have no business relationship with any company whose stock is mentioned in this article.
Follow Sandeep Singh Ahluwalia and get email alerts