Gold and the Long-Term Inflation Cycle / Commodities / Gold & Silver 2024

Ofthe many factors that determine gold price trends, the long-term cycle ofinflation and deflation is of singular importance. The cycle in questioncorresponds closely to the 50-to-60-year economic periodicity known as theKondratieff Wave (or K-Wave), but is in fact a separate cycle. As we’ll discusshere, the cycle tells us to expect a gradual acceleration of inflationarypressures between now and the year 2029, with particular significance for goldinvestors.
TheK-Wave was brought to renown in the 1920s by the Russian economist NikolaiKondratieff and is widely regarded as the predominant economic super cycle.This cycle arguably represents the most casual approach to identifying the realsupply/demand conditions of any free market economy and is especiallyapplicable to the United States. (Cycle analysts have even identified thiscycle as existing as far back as thousands of years ago in Assyria and theRoman Empire.)
Commentingon the K-Wave, the late cycle analyst Samuel J. Kress—whose eponymously namedKress Cycle of 60 years duration closely corresponds to Kondratieff’s long-wavecycle—made the following observation back in 2002:
“TheK-Wave is the manifesto of economic determination. It is the ultimate boom/bustcondition. The cycle is caused by the beginning of acquisition and the endingliquidation of debt. Debt creates a false or created incremental demand inaddition to intrinsic, real demand. When debt assumption becomes excessive, thesystem becomes illiquid. At that time, debt must be reduced to alleviate thepressures of illiquidity. This waning demand is reflected in reduced overalleconomic activity and [corporate] earnings. In turn, this begins the momentumlikened to a snowball rolling downhill. Once debt is liquidated, the systemre-liquifies, debt is reacquired and the economic super cycle begins anew.”[Kress, The Reign of the Bear, 2000-2014]
Kressmaintained that the last K-Wave that bottomed in the previous decade was thefourth one since the U.S. gained its independence in 1776. He depicted theK-Wave as it pertains to consumer price inflation, dividing it into fivephases:
Inflation:1949-1965Hyper-Inflation:1965-1980Disinflation:1980-2000Deflation:2000-2010FinalBottom: 2010-2015Similarto the K-Wave, the 60-year long-term cycle of inflation/deflation identified byKress contains several smaller component cycles, each having its ownsignificance to financial markets, consumer prices and even to extended periodsof war and peace.
Indeed,Kress noted that two wars typically occur in every K-Wave: the first at the endof deflation and beginning of inflation (Parts V and I, shown above), and alsoat the end of hyper-inflation and the beginning of disinflation (Parts II andIII). In the fourth (most recent) K-Wave, World War II ended in the mid-1940sand the Vietnam War ended in the mid-1970s.
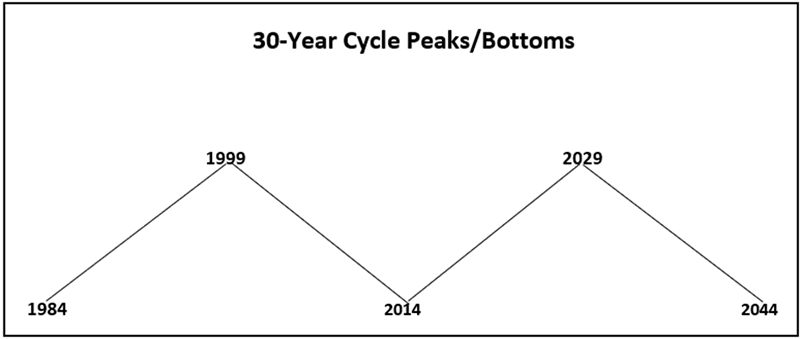
Kress’ssupposition was that the first 60-year cycle of any significance for the UnitedStates can be identified as beginning in the year 1774, which closely coincidedwith America’s Revolutionary period between 1775 and 1783. The 60-year cycle iscomprised of two 30-year cycles, each of which has a peak at the midway pointof 15 years (an important point to remember when analyzing inflationary anddeflationary periods).
Thecomposite 60-year cycle carries not only the seeds of economic expansion andcontraction (inflation and deflation), but the bottoming of its 30-yearcomponent cycle is sometimes accompanied, or followed, by war. This was true inthe immediate wake of the years 1774 (Revolutionary War), 1864 (Civil War),1894 (Spanish-American War) and 1954 (Vietnam).
Evenwhen the 30-year cycle’s bottoming doesn’t produce “hot” wars, a “cold” waroften accompanies it which is characterized by heavy war-time spending levels.This point is worth emphasizing, for it serves as a key impetus forstrengthening gold prices.
Themost recent 60-year cycle of deflation—as well as its 30-year component—bottomedaround 2014-15, and with it a new long-term cycle of inflation was born. As the60-year cycle can be divided into two 30-year cycles, so the 30-year cycle canbe divided into two 15-year half-cycles. This is an important variable for goldinvestors to keep in mind, for its upcoming peak of the latest 30-year cyclethat should produce some intensive upside pressure for the yellow metal’sprice.
Unlikebonds and real estate, which each benefit and fail from the former and latterstages of the long-term cycle, gold benefits from both stages of it. Kressexplained gold’s ability to benefit from both runaway inflation and deflationas follows:
“Whenthe latter stages of inflation begin, gold is perceived as the ultimate hedge.During the hyper-inflation of the 1970s, gold increased in value approximately20-fold, and then began its bear market in the early 1980s with disinflation.When deflation/depression begins, the price of gold is perceived as theultimate storehouse of value.” [Kress, Taming of the Bear, 1999]
Withdeflation long since in the rearview mirror, a new inflationary super cycle hasbeen underway for the last several years and is approaching the first of atleast two acceleration phases: the first one is scheduled for around the years2029-2030 when the 30-year component of the super cycle is due to peak. Inother words, we should begin to see consumer price inflation accelerate higheras we draw closer to the end of the current decade.
Withinflation’s intensification should come growing demand for gold as a hedgeagainst higher living costs, just as it did in the prior inflationary period ofthe 1970s. Accordingly, gold or a derivative thereof, should constitute atleast a conservative weighting in one’s portfolio with a dollar averagingapproach during the coming two years.
Aboutthe author: Clif Droke is a veteran gold market analyst and published author. He can becontacted at clifdroke@protonmail.com
By Clif Droke
www.clifdroke.com
Clif Droke is the editor of the daily Gold & Silver Stock Report. Published daily since 2002, the report provides forecasts and analysis of the leading gold, silver, uranium and energy stocks from a short-term technical standpoint. He is also the author of numerous books, including 'How to Read Chart Patterns for Greater Profits.' For more information visit www.clifdroke.com
Clif Droke Archive |
© 2005-2022 http://www.MarketOracle.co.uk - The Market Oracle is a FREE Daily Financial Markets Analysis & Forecasting online publication.