December 30, 2024
Year in Review 2024
Author - Ben McGregor
Gold tops metals even with key drivers mixed
Gold had the strongest performance of the metals this year, even with its key drivers mixed, while was silver close behind it, copper and aluminum saw more moderate gains and the other major metals declined, with iron ore particularly weak.
Year In Review 2024
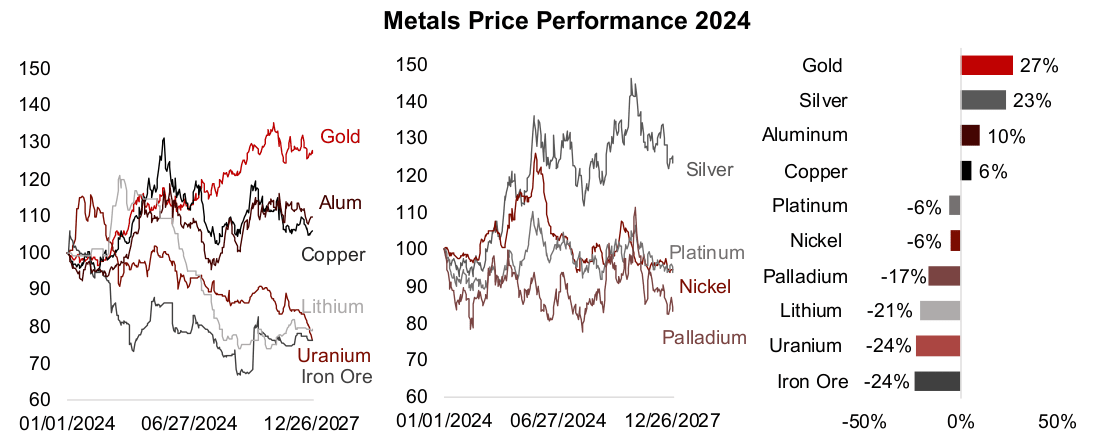
Gold clearly beat out all the major metals this year, rising 27%, after silver pulled back
from leading the sector in Q4/24 for a 23% gain (Figure 1). The performance of the
other precious metals and base metals were comparably weak, with losses for most,
and only moderate gains for aluminum and copper. Iron ore was the worst performer,
with lithium and uranium performing only slightly better as they continued reversals
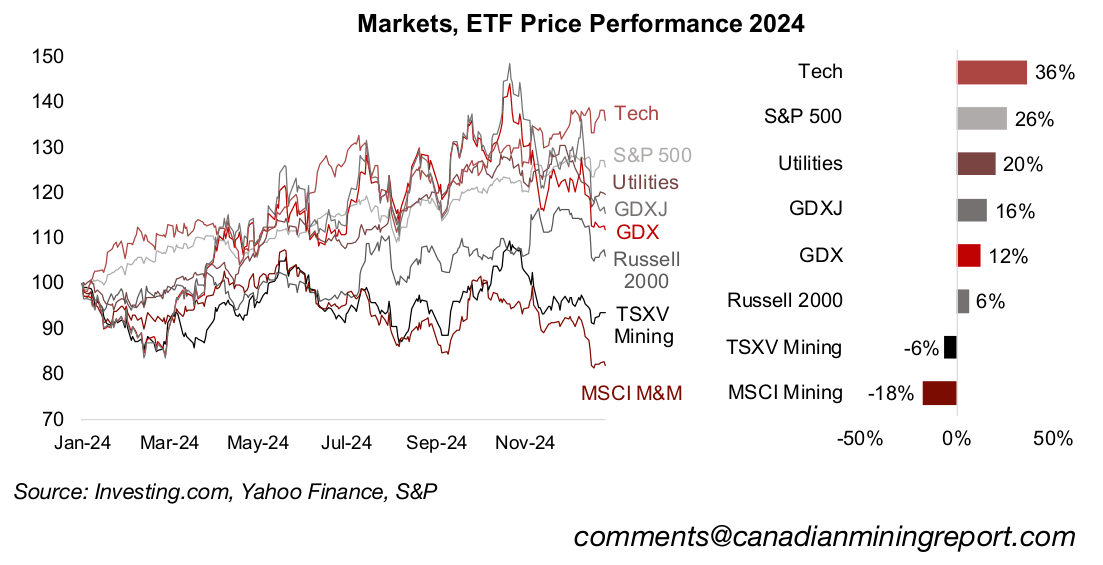
of parabolic moves in recent years. Gold stocks were driven up by the strength of the
metal price, with the GDX ETF of large gold producers rising 16% and the GDXJ ETF
of gold juniors up 12% (Figure 2).
The other large cap mining stocks suffered this year, with the MSCI Metals & Mining
ETF slumping -18%, especially because of its large weighting to stocks heavily
exposed to the iron ore decline. The TSXV Mining ETF declined -6%, outperforming
MSCI Mining, but underperforming the GDX and GDXJ. This was partly because its
heavy weighting to gold stocks was offset by a high exposure to the weakening
lithium sector. However, there was also a broader shift in the markets towards a more
defensive stance including caution on small caps, with the Russell 2000 index up just
6.2%, significantly underperforming the large caps.
The big risk taking remained focussed on the tech sector, which still led the markets
this year, up 36.3%, and was the main driver of the 25.9% gain in the S&P 500.
However, there were periods this year that indicated the markets were increasingly
hedging their bets, with safe haven sectors like gold, the gold stocks and utilities
actually briefly outperforming tech. The utilities sector, which is considered one of the
most defensive sectors, ended the year up a strong 19.7%, not far behind the large
caps overall.
Gold surges even without universal support from all drivers
Interestingly gold outperformed without the universal support of all its core drivers,
with both the US$ and real yields rising, and these tending to move inversely to the
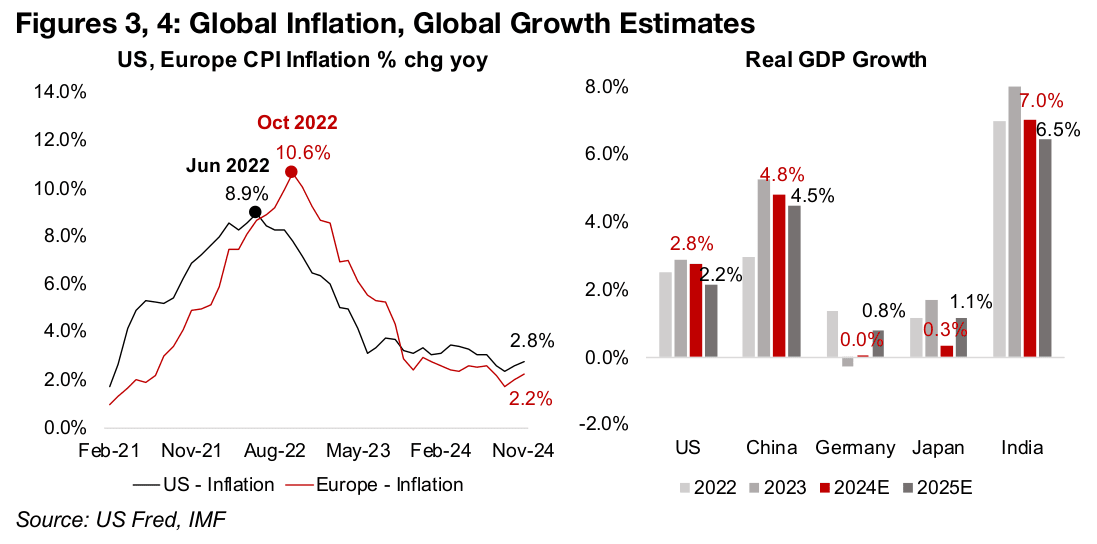
metal. However, the major decline in the year on year rise in the US and EU CPI
indices that occurred in 2023, after a huge spike in inflation in 2022, shifted to only a
gradual easing in 2024 (Figure 3). This kept the markets on edge as to whether there
could be a resurgence of inflation, which could have potentially dragged down both
the US$ and real yields, and likely supported the gold price.
After a global economic recovery in 2021 and 2022, this year growth started to cool,
with the IMF estimating a decline in real GDP growth for most of the largest
economies for 2024 and 2025 (Figure 4). Relatively high inflation, which is still above
US and EU central bank targets of 2.0% and slowing growth forecasts have reared
the spectre of stagflation, a period of low growth with high inflation. This could have
also supported the gold price this year, as the metal saw strong gains during the last
period of extended stagflation from the mid-1970s to early 1980s.
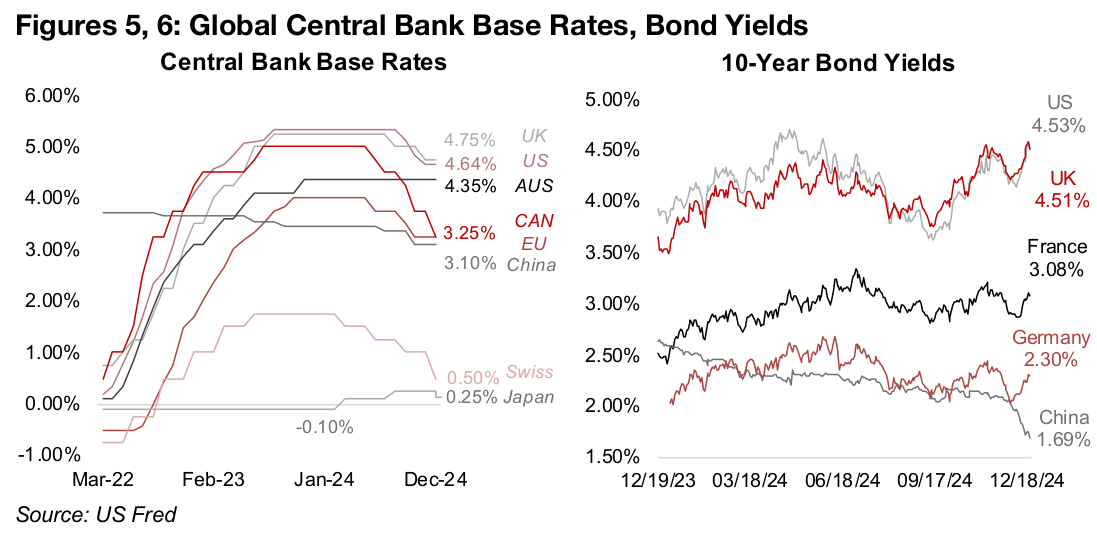
This year also saw a major shift in central bank policy on interest rates, with a rate
cutting cycle starting, following a long period where rates were on hold after the
aggressive hikes through 2022 (Figure 5). This implies an expansion of the money
supply, which is one of the core long-term drivers of the gold price, as the value of
the global stock of gold tends grow along with the size of the fiat money base.
Interestingly, however, the 10-year bond yields of many of these countries rose even
as these base rate cuts occurred (Figure 6). This was because these longer-term rates
had actually been below the base rates for some time. This was a relatively rare case
of yield curve inversion, with long rates typically higher than short rates, which is often
a warning sign of an upcoming economic downturn.
Geopolitical risk was in favour of gold for most of the year, with major conflicts in
Eastern Europe and the Middle East escalating and the price likely incorporating over
a US$400/oz premium for this given the metal’s gains at the start of these two
situations. However, following the US election in early November 2024 there was
about a month of extreme geopolitically driven volatility in gold. This came as markets
questioned whether these conflicts could ease under the new president, followed by
an escalation of one conflict and a de-escalation of the other. The geopolitical risk
seems to have stabilized in the last month of the year.
Polarized gold and iron ore moves, moderate aluminum and copper gains
Gold and iron ore are the two largest metals markets and the wide split between their price performances were the two defining poles for the space, with gold the big outperformer and iron ore the big underperformer (Figures 8, 9). The iron ore price slumped through most of the year given a contraction in growth for steel demand, which accounts for the majority of iron ore demand. This was especially driven by China, which accounts for well over half of global steel demand, and faced slowing growth in its property and infrastructure sectors, which have been a key source of global iron ore demand for more than a decade.
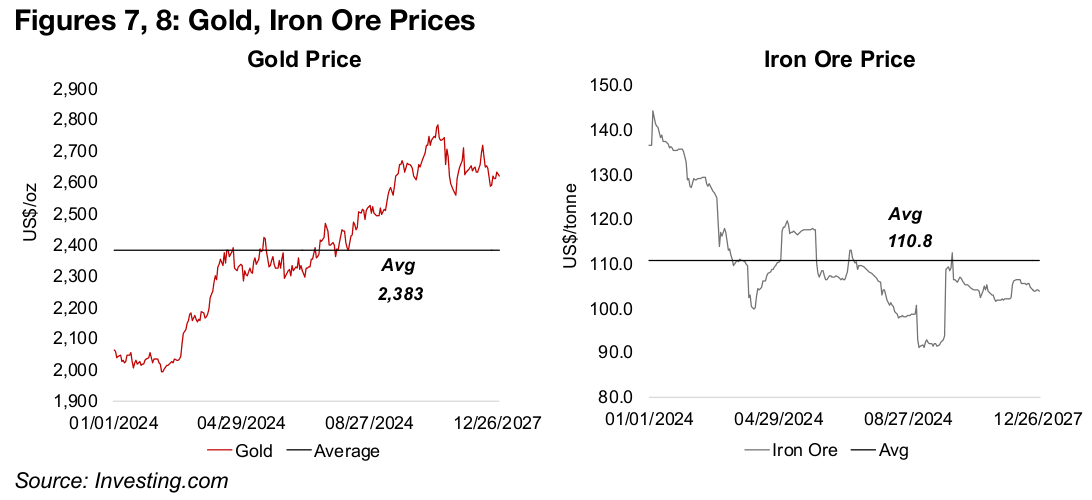
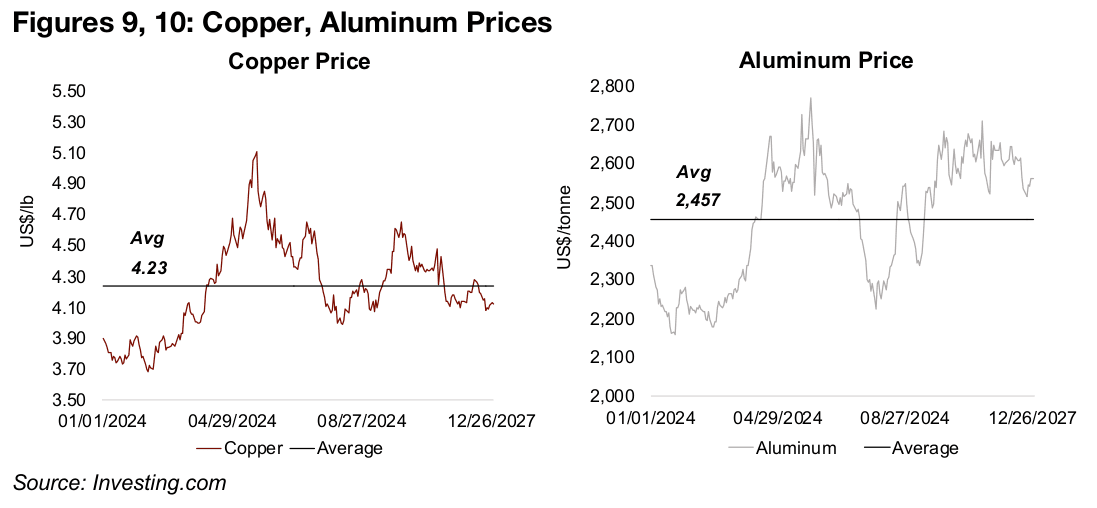
The performance of copper and aluminum were much more moderate, falling in between gold and iron ore, with both seeing moderate gains, up 6% and 10% for the year, respectively. These metals are both considered global bellwethers for the industrial cycle and seemed to indicate that a decent, but not outstanding, expansion of the world economy continued. Both of these metals had seen large upswings in the second quarter of 2024, at which point global growth expectations had been more bullish than later in the year. However, there was a significant pullback from these highs as the moves were viewed as increasingly speculative and not backed by particularly strong underlying economic fundamentals.
Silver strong, other precious metals struggle, lithium and uranium slump
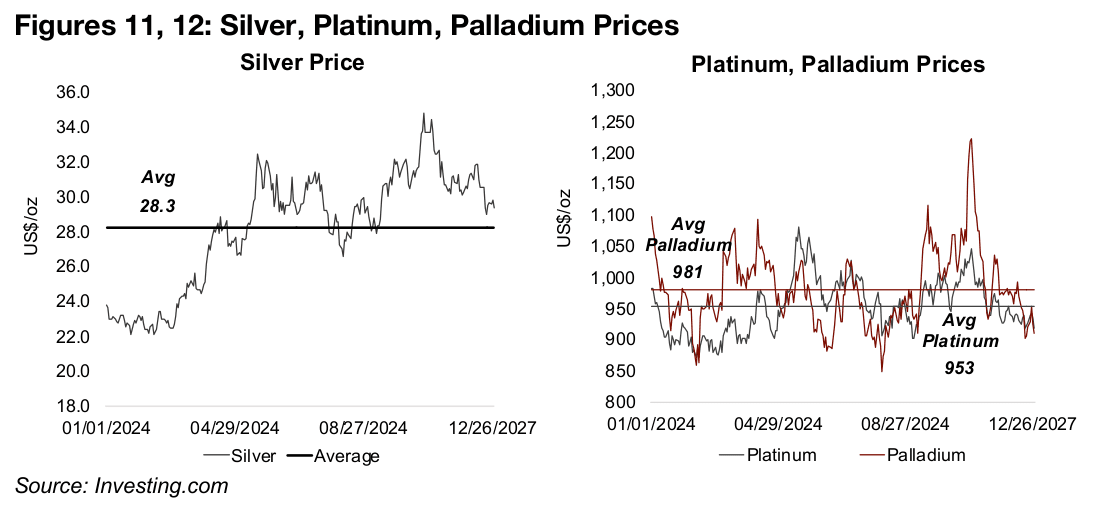
Of the other precious metals, only silver has a strong year, with a fourth year of a
large deficit, and its ratio versus gold starting the year quite low (Figure 11). With silver
partly driven by monetary factors similar to gold, there was some pressure for this
gap with gold to contract, although industrial factors are also key to the metal, similar
to copper, which can see the ratio move away from its average for long periods.
While platinum and palladium saw considerable volatility, both repeatedly reverted to
their means and the two actually moved in tandem for most of the year (Figure 12).
This convergence is a new trend in 2024, with the palladium price far outperforming
platinum from 2017 to 2023 and the reverse happening prior to 2017. The main driver
for both is autocatalyst demand, and with the performance of this industry weakening
this year it was not enough to drive a sustainable pick up in the two metals.
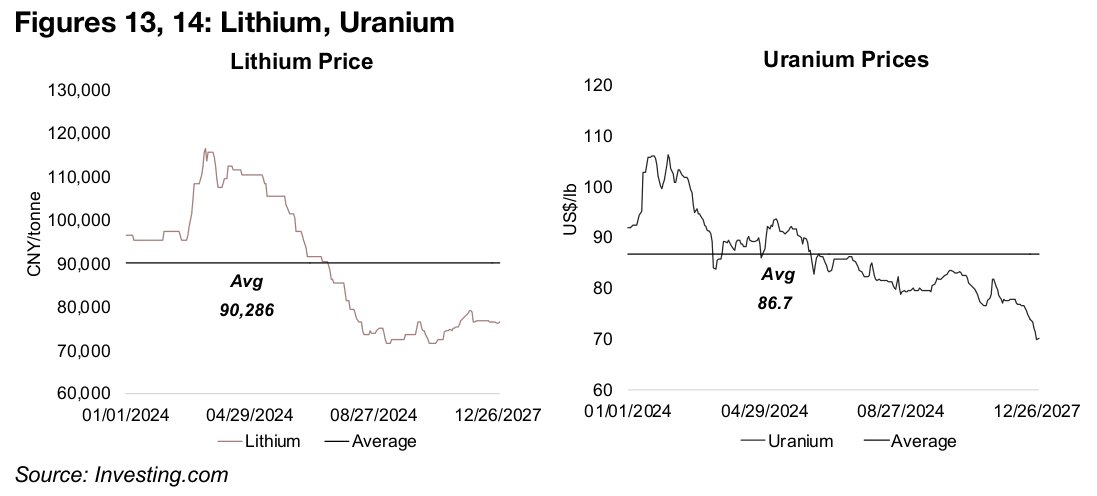
Two metals that had seen extreme gains in recent years, lithium and uranium, slumped this year, after brief surges for both early in the year were not sustained (Figures 13, 14). Lithium faced a decline in EV demand growth, and in turn for the metal in batteries, while production capacity, mainly concentrated in China, rose significantly. For uranium, there was less of a clear shift in underlying fundamentals against the price. The decline may have simply been the market viewing the previous parabolic move as unsustainable short-term, even given the long-term secular trend of increasing support for nuclear power as a part of green energy plans.
Big Gold outperforms Big Mining
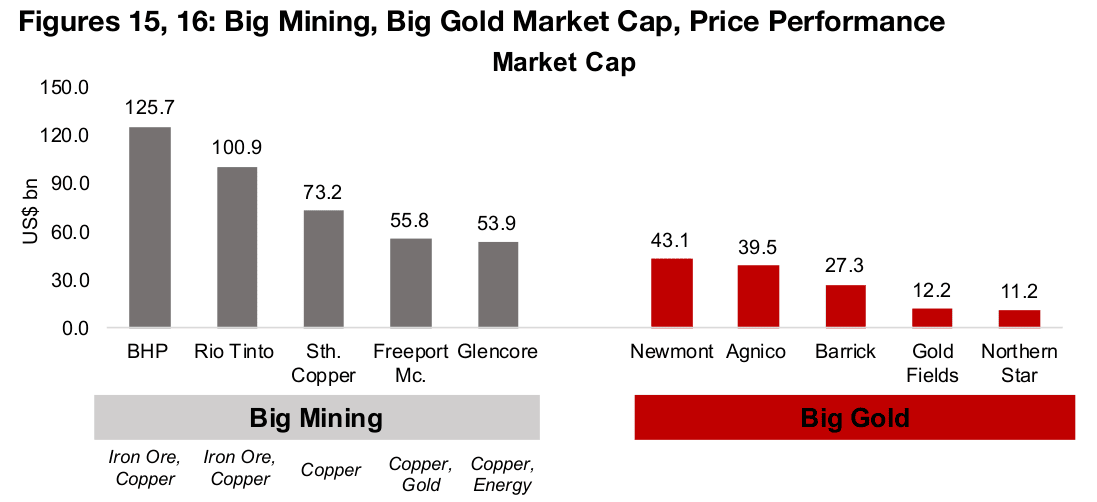
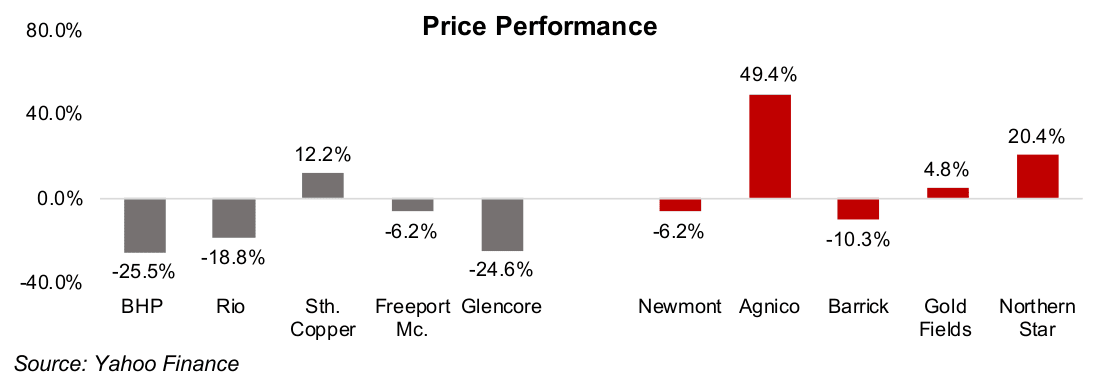
Big Gold outperformed Big Mining overall, driven by the rise in the gold price,
although many of the major gains were for mid-tier names (Figures 15, 16). For the
top five Big Gold stocks, only Agnico Eagle and Northern Star saw large gains and
Gold Fields a slight rise. Two of the largest gold stocks, Newmont and Barrick,
actually declined this year, as the markets became concerned over rising costs for
both, even though earnings rose substantially. For Big Mining, stocks with a large
exposure to iron ore declined most, including BHP, Rio Tinto and Glencore, as could
be expected given the slump in the metal. The two companies with a majority of their
revenue generated from copper, Southern Copper and Freeport McMoran, performed
better, with a moderate gain for the former and only a slight loss for the latter.
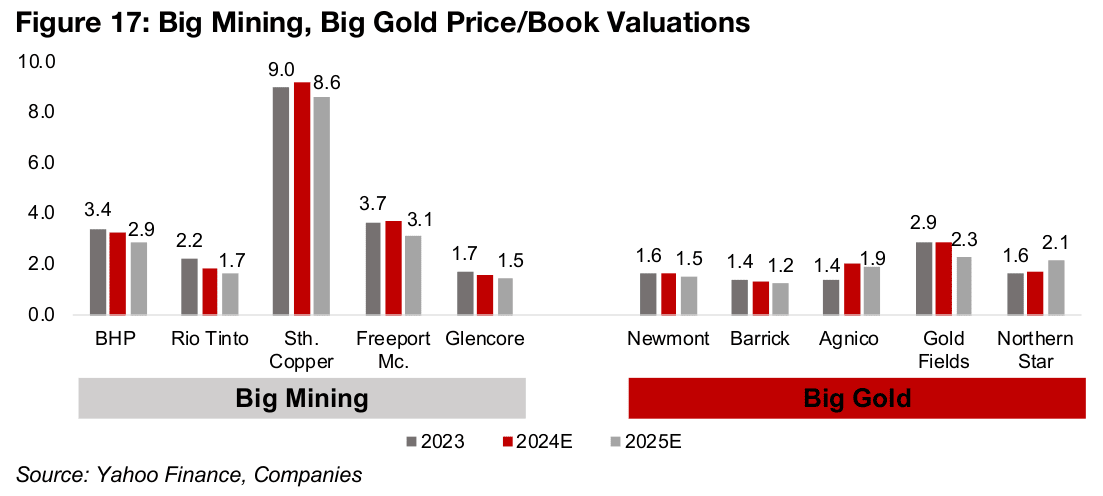
The price to book valuations for all the top five Big Mining stocks declined, which
might have been expected given the exposure to iron ore, and concerns over the
outlook for copper next year as global growth estimates are being reduced (Figure
17). However, the multiples for Big Gold also came down, even as the gold price has
surged. This seems to indicate that the market remains wary not only of the outlook
for base metals next year, but also for the gold price.
Large TSXV stocks driven mainly by company specific factors
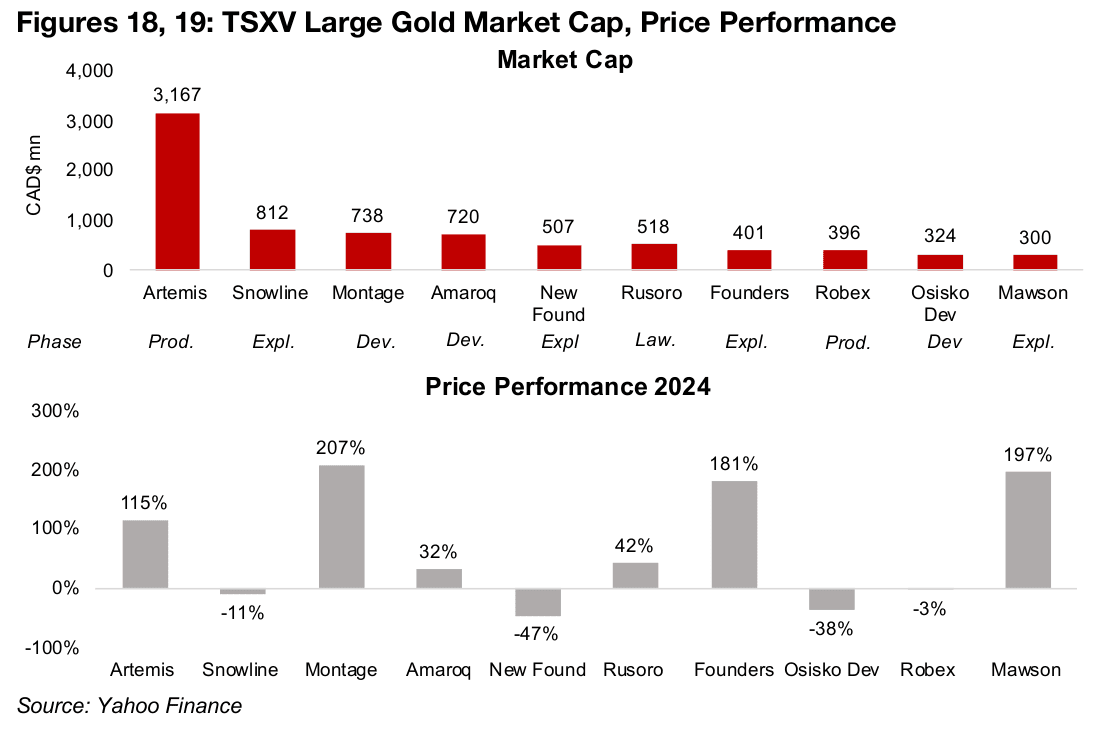
The large TSXV gold stocks performed quite well overall, although this seems to have been mainly because of company specific drivers and less about broader industry trends (Figures 18, 19). Even the major rise in the gold price did not lead to universal gains across the sector, with four of the top ten declining. While two of the decliners were exploration stage firms, which could be expected given a market more averse to riskier, early-stage companies, some in this stage saw the highest gains on outstanding drill results. In general the market seemed to back companies showing extremely strong fundamentals, contrasting with the previous gold jump of 2019- 2020 when smaller riskier juniors saw more of an across the board boost.
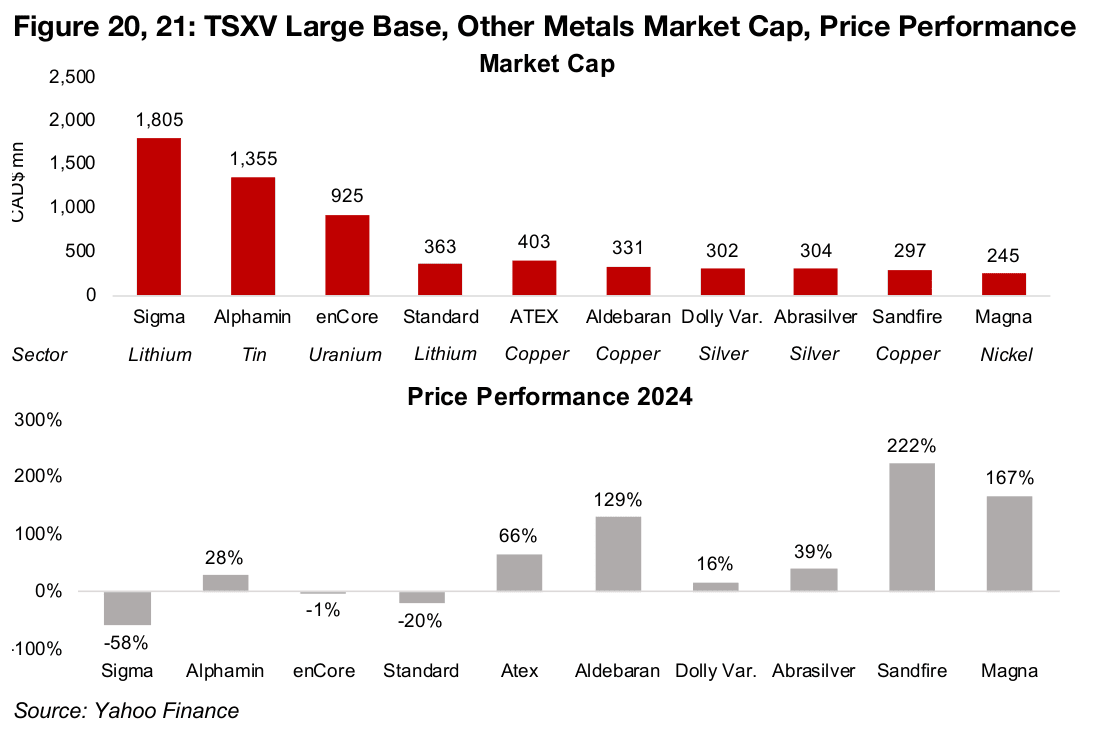
While for the TSXV large base and other metals stocks the market also seemed focussed on outstanding company specific drivers, there appeared to be some broader sector effects weighing on stock prices (Figures 20, 21). This was seen in the substantial declines in the two largest lithium stocks, although the largest uranium stock was near flat even as the metal price declined. The rise in all three of the copper stocks was far ahead of the gains in the metal price, again indicating fundamental strength at the company level. Both silver stocks rose, but with a wide spread between the gains, and the rise in the tin and nickel stocks significantly outperformed their underlying metals prices.
Overall it was a strong year for gold earnings and stock prices, but not as good as might have been expected for many companies given the huge rise in the metal price, and valuations actually declined. While silver also had a strong year, other precious metals and base stocks struggled with price performances ranging from moderate to heavily down, and their stocks declined substantially overall. It shows a market that is considerably more cautious overall than it had been in the previous two years, and particularly bearish on the mining sector, especially in contrast to its clear continued bullishness on the tech sector.
Disclaimer: This report is for informational use only and should not be used an alternative to the financial and legal advice of a qualified professional in business planning and investment. We do not represent that forecasts in this report will lead to a specific outcome or result, and are not liable in the event of any business action taken in whole or in part as a result of the contents of this report.


