Moderate 2025 metals forecasts for major institutions
The AOCE and WB have moderate overall forecasts for the metals in 2025 inline with IMF forecasts for a decline in economic growth and inflation, although we see the probability of a stagflationary scenario as still reasonably high.
Gold at an inflection point, high risk for base metals remains
Gold remains at an inflection point, and we are more cautious on the metal than over the past five years after its huge run last year, while we continue to see high risk for base metals if industrial growth disappoints already relatively low expectations.
Low valuations offer a cushion to mining sector
While tech has driven large cap US valuations to extremely high levels, multiples of most other markets and sectors remain low, including mining, which has priced in significant risks, offering the sector a cushion heading into a potentially difficult year.
Year Ahead 2025
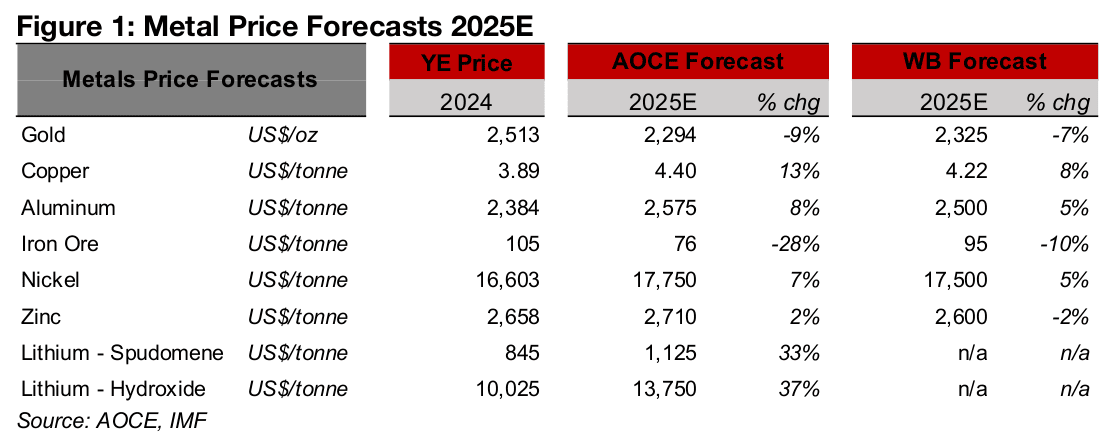
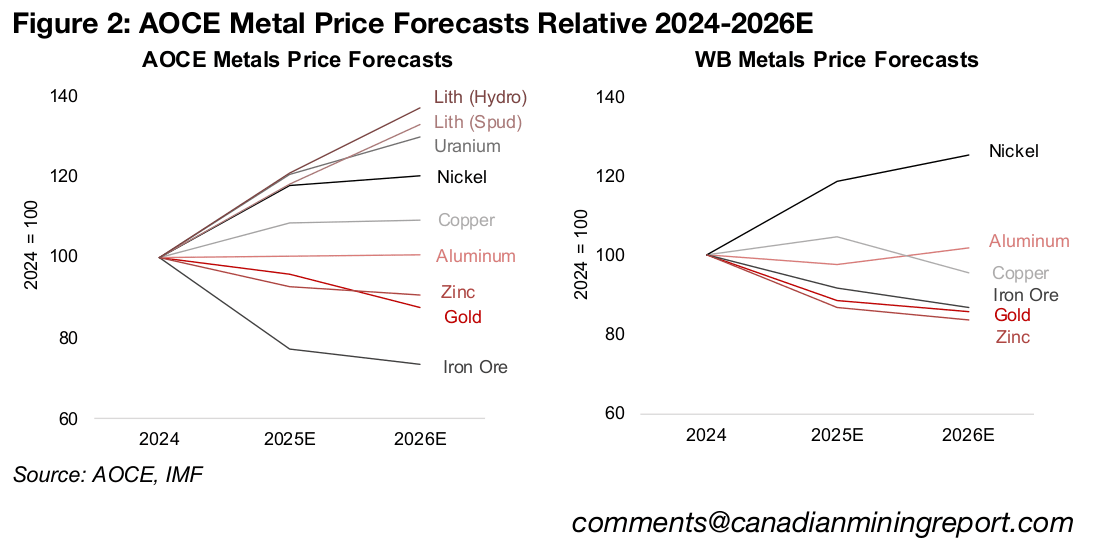
The forecasts of the major institutions supplying regular metal price updates,
Australia’s Office of the Chief Economist (AOCE) and the World Bank (WB), imply
decent, but not particularly strong, growth for the global economy in 2025. Both
estimate moderate gains for copper and aluminum, the bellwethers for industrial cycle,
and a decline in gold, implying a decline in risk or slower monetary expansion, for
2025, then flat copper and aluminum prices and a gold drop for 2026 (Figures 1, 2).
The institutions are both bearish iron ore for this year and next, driven by expectations
for continued slowing steel demand, especially from China. For the mid-sized metals
markets, both sources expect a recovery for nickel off a very weak 2024, and a
decline for zinc, with both of these trends forecast to persist into 2026. For the smaller
metals markets, only the AOCE has forecasts for lithium and uranium prices,
expecting rebounds from recent slumps which are forecast to continue into 2026.
Forecasts for falling growth and inflation, rising unemployment
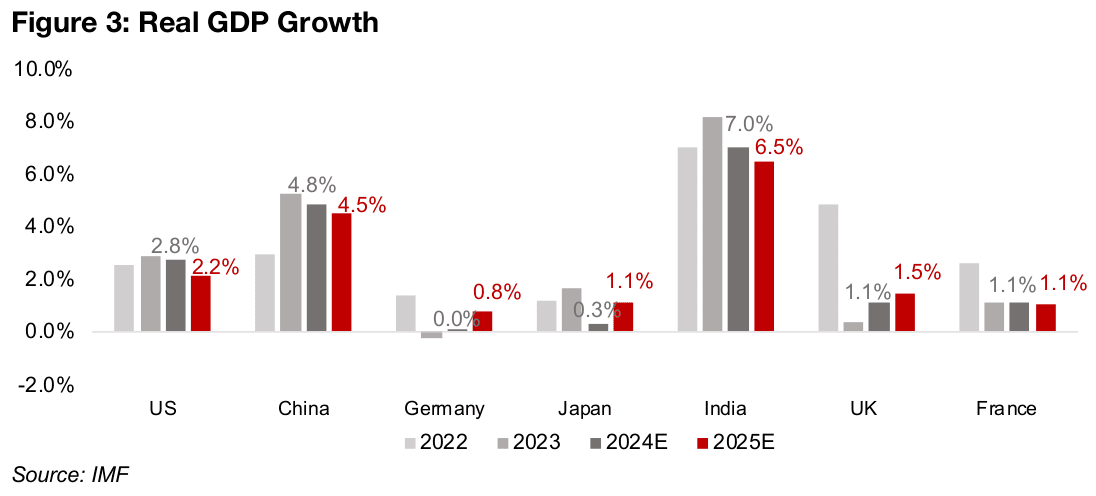
This moderate outlook for the metals corresponds to estimates from the International Monetary Fund (IMF) for a slowdown in growth for 2025 for most of the major economies. For US, China, Japan and India, growth most recently peaked in 2023, declined in 2024, and is expected to fall further in 2025 (Figure 3). For Germany and the UK, while growth is expected to pickup this year, this is off a near zero expansion last year, and growth in France is expected to be low, and flat year on year.
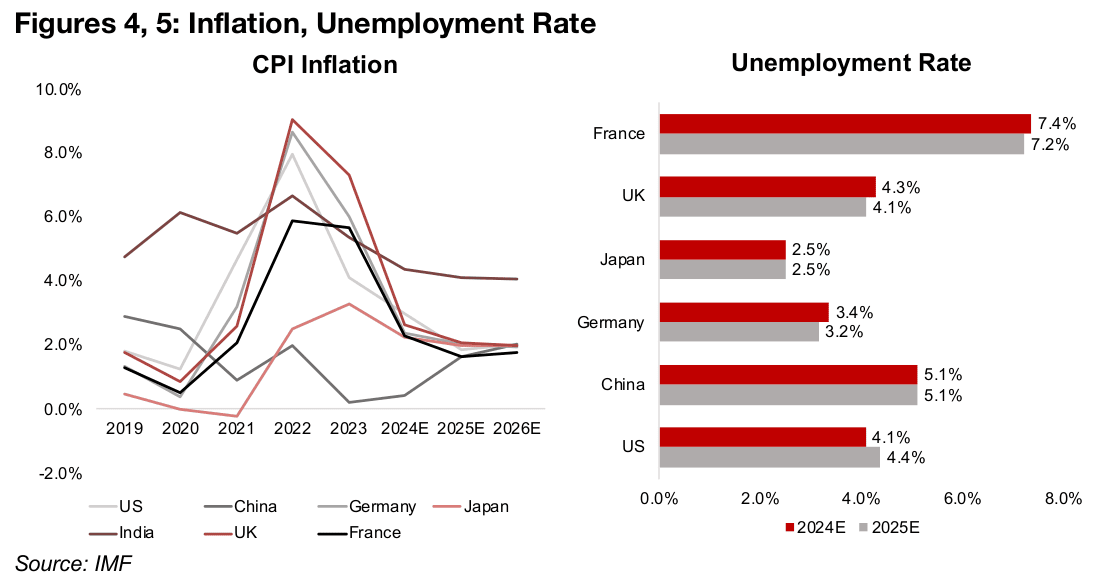
The slowdown in inflation is expected to continue in 2025, but at a more gradual rate than the huge 2024 decline, consistent with expectations for a slowdown in growth and converging to around 2.0% for most major economies (Figure 4). However, even with the declining growth forecast, the IMF expects unemployment to be flat or down for all of the major economies except the US (Figure 5).
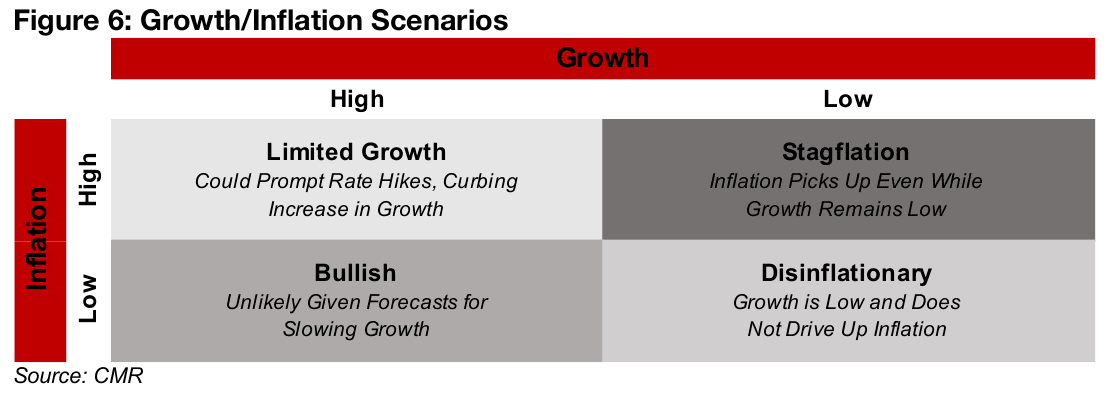
We believe that the biggest chance for a divergence from these forecasts could come
from rising inflation, with central banks cutting rates through 2024 and there being a
potential lag of a year or more between such cuts and when they boost the CPI. High
inflation typically corresponds to high growth, and could force central banks to boost
rates, potentially curbing the expansion, for a Limited Growth scenario (Figure 6).
However, there could be a Stagflation scenario of sluggish growth and high inflation
which while negative overall has historically been supportive of gold. The ideal Bullish
scenario would of course be high growth and low inflation, similar to the mid-2010s,
although this was rare historically and seems unlikely to be repeated this year. This
is partly because inflation expectations have risen significantly and employers and
workers will be quicker to demand higher prices and wages than in the prior decade.
That the IMF is estimating a growth slowdown is a concern as most large institutions
tend towards forecasting improvement in forward years except during extreme crises.
If these forecasts already incorporate a bullish tendency, actual growth could be
worse, and could push up unemployment. The current IMF forecasts effectively
indicate a Disinflationary scenario, where growth is low but so is inflation.
In weighting these four scenarios for 2025, we would put a higher probability on the
Stagflation and Disinflationary outcomes, only a moderate weight on the Limited
Growth outcome, and have quite a low expectation for the Bullish scenario. For both
the economy and metals prices overall this would not indicate a strong year ahead,
and could lead to weaker outcomes that than those currently estimated by the AOCE,
WB and IMF for 2025.
Potentially higher risk for gold in 2025 compared to recent years
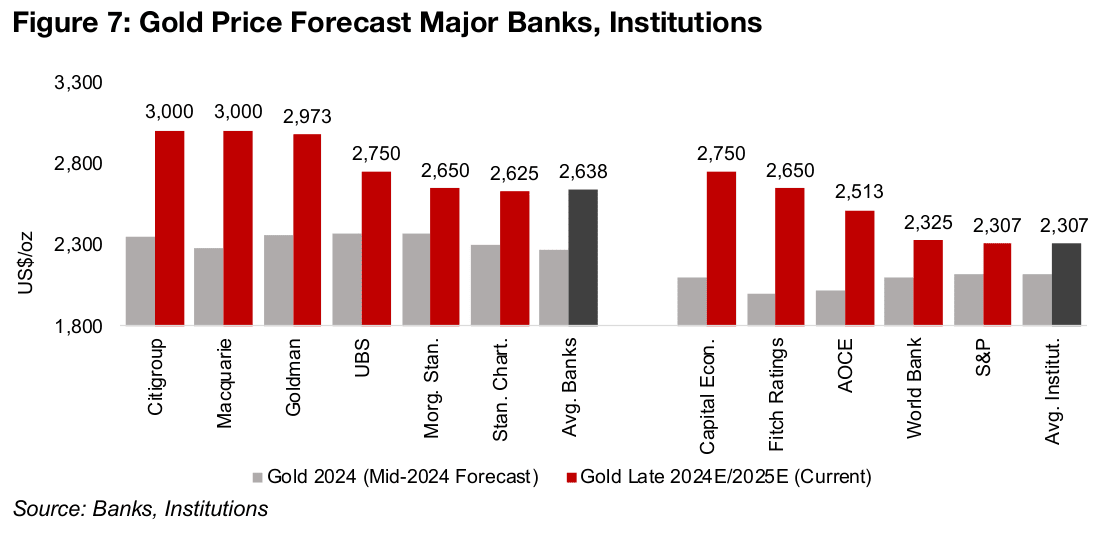
At the start of the past few years we have had a reasonably bullish outlook for gold and viewed the forecasts of the major institutions and the major investment banks as underestimating the gold price. This is the first year in several where we are more cautious on gold, especially given its huge run in 2024. One interesting change this year is that many banks and institutions have boosted their late 2024-early 2025 targets to levels near, or above, the current price (Figure 7). This is the first time we have seen broader forecasts ‘catch up’ with the gold price in many years, in contrast to 2019-2023, when the broader market remained somewhat disinterested in gold even as it surged. When the wider market finally starts to get behind a trade like this it is often a warning that the bull market is nearing its end.
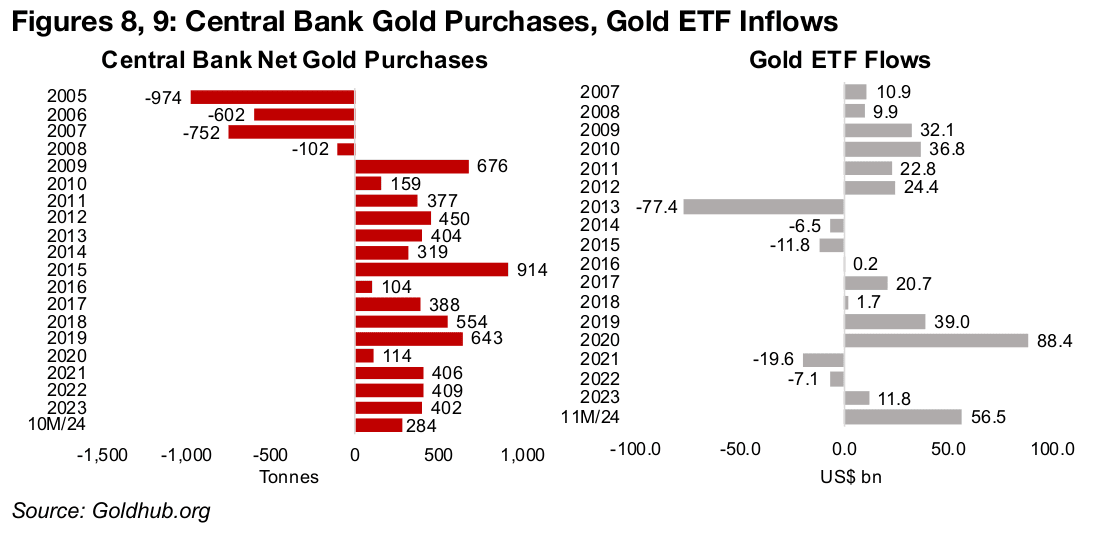
While net central bank gold purchases remained strong in 2024, at 284 tonnes over
the first eleven months of the year, this is on track for a significant decline from over
400 tonnes per year from 2021 to 2023 (Figure 8). A further slowdown in purchases
by central banks this year could indicate that they are seeing the gold price as getting
a bit overextended. These purchases have been a key driver of the gold price in recent
years, and if they slow in 2025, it could be a downward driver.
While central banks have eased off, there is evidence of rising retail interest in gold
from high investment inflows into sector ETFs, at US$56.5bn in 2024 (Figure 9). This
is the second highest in two decades, after US$88.4bn in 2020, representing a major
comeback from sluggish inflows from 2021 to 2023. This sets a high bar for 2025,
and if inflows match or beat 2024, it could be a sign of an unsustainable bubble.
Geopolitical risk outlook unclear after US election
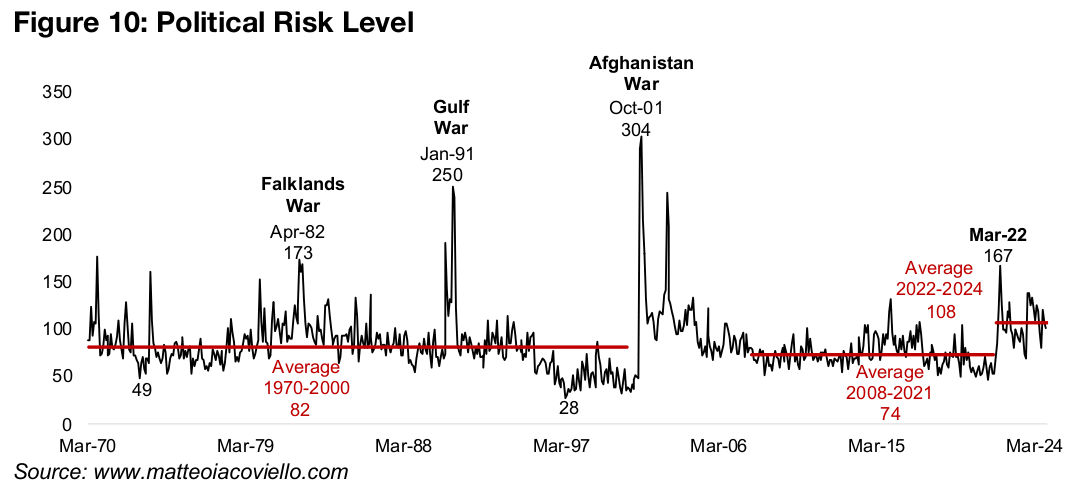
Geopolitical risk has been a major driver for gold for the past three years, and we
estimate a premium of US$400-US$500/oz for this factor in the price from the
Russia/Ukraine and Middle East conflicts, based on the rise in gold when they first
erupted. The political risk index remains at relatively high levels, especially in contrast
to the mid-2010s (Figure 10). A major swing factor for geopolitical risk this year is the
new US president, who oversaw a period of relative calm in international relations in
this first term, which if repeated, could see the gold price take a major hit.
However, a more peaceful period is certainly not guaranteed, and economically the
new President’s second term could be more volatile, given threats of major tariff
increases. This could prompt retaliations by other countries, and such trade wars
have historically sometimes preceded actual wars. There is at least some probability
that geopolitical risk could be higher during Trump’s second, versus first, term.
Still a potential bullish case for gold in 2025
While we have outlined a more cautious take for gold this year, we are not entirely
discounting a scenario where the bull run continues. This could come from an upside
inflation surprise, as central banks cut rates considerably in 2024 and this may only
show up in the CPI this year, and further cuts could follow if growth disappoints. This
could potentially reverse the hawkish stance proclaimed by the Fed after its latest
rate cut, when it indicated that further reductions would be far more gradual, and
certainly no hikes were indicated. This implies that global money supply growth,
which exited negative territory in 2024, could continue to rise.
This monetary expansion is the key root driver gold in our view, with the value of the
global gold stock maintaining a relatively steady proportion of the global money
supply over the past decade. However, there could also be geopolitical shocks that
particularly take the markets by surprise, especially as this contrasts with the wide
perception that the second Trump term will cool tensions. Overall, we see gold at an
inflection point heading into 2025, where we are more cautious on the upside
prospects for the metal than at any time in the last five years.
Silver supported by deficits, platinum and palladium face sluggish auto sector
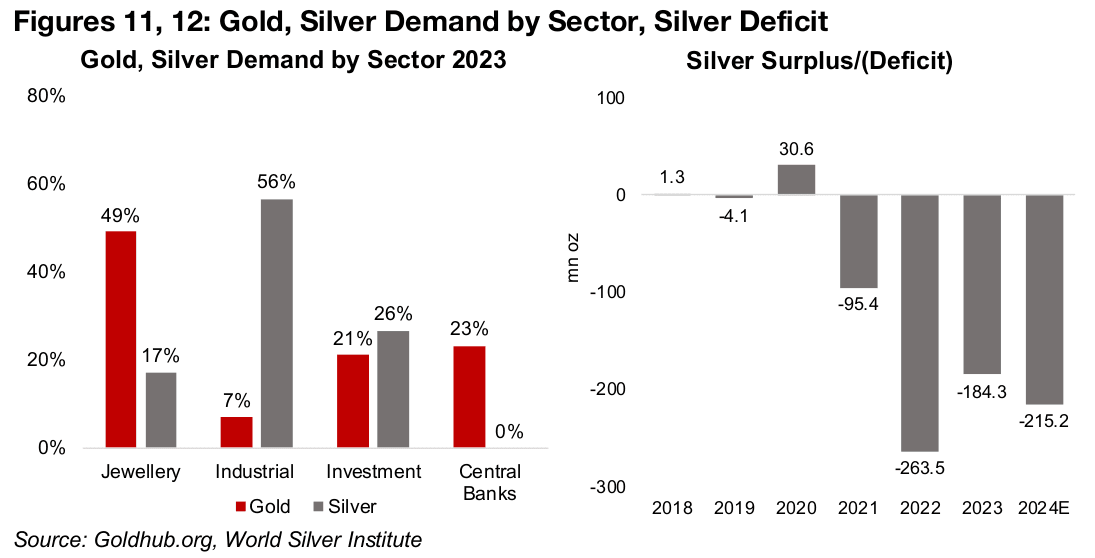
While silver also has a large proportion of its demand from monetary factors, over half of its demand is from industrial drivers, making it a hybrid, sometimes tracking gold, and sometimes copper (Figure 11). For silver the demand side could be balanced this year, with some support from a continued monetary expansion and potential upside inflation surprise, offset by the chance of a sluggish industrial cycle. However, the supply side is particularly weak for silver, with 2024 the fourth year of a major deficit, which is expected to persist in 2025 (Figure 12).
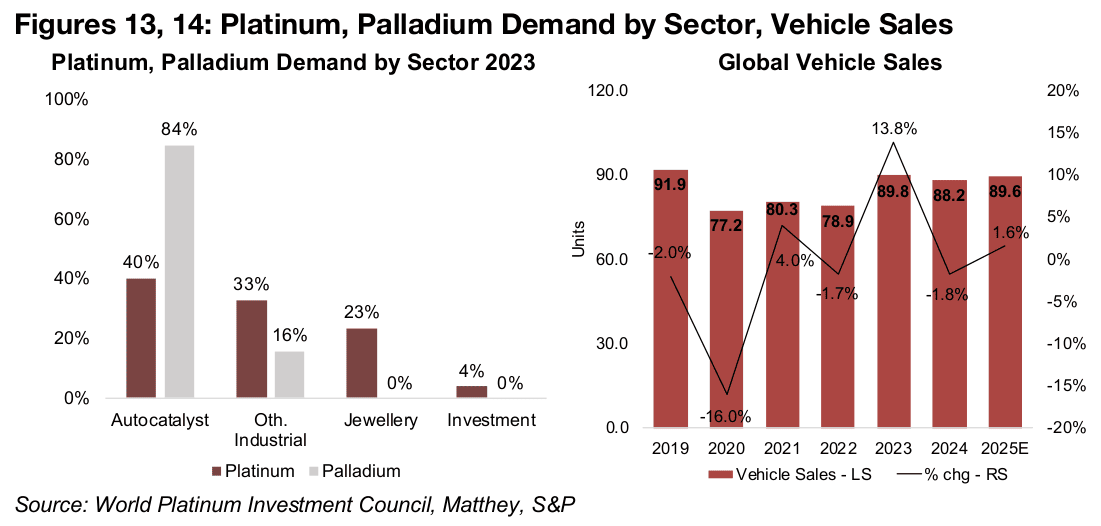
Platinum and palladium have the highest proportion of their demand from the auto industry, given their use in autocatalysts, although this is much more critical for the latter, at 84% of demand, versus 40% for the former (Figure 13). Palladium therefore could be particularly affected this year by expectations for slow global vehicle sales growth of 1.6%, after a -1.8% decline this year (Figure 14). While platinum has some demand from the more monetary jewellery and investment factors, these are far below the levels of gold and silver, and 70% of its demand is still industrial.
Broad demand for copper, aluminum, several base metals steel-driven
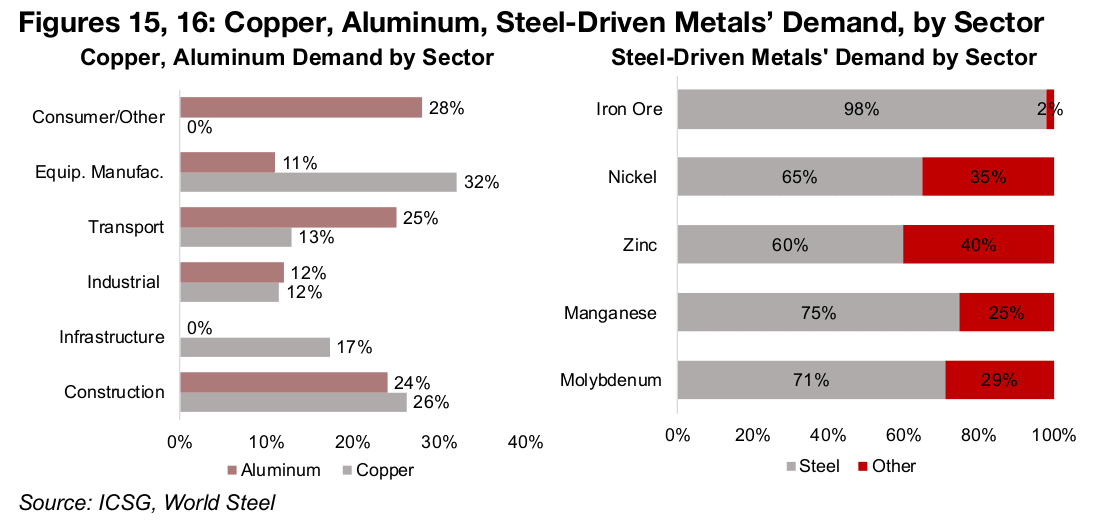
For the base metals, copper and aluminum have broad uses across many sectors
with a near similar demand proportion from the construction and industrials segments
and large contributions from transport and equipment manufacturing for both. While
the sources used in Figure 14 officially put aluminum use in infrastructure at 0% and
copper use in the consumer/other sector at 0%, in practice these metals will also be
used in both of these sectors to some degree. For 2025, the copper and aluminum
price will therefore mainly be a play on industrial demand, with neither facing extreme
supply issues currently, and the risk for this still remains to the downside.
Most of the rest of the major metals, iron ore, nickel, zinc, manganese and
molybdenum, have the majority of their demand coming from their use in the steel
industry, with nearly 100% of demand for the former coming from the sector (Figure
16). Steel production growth will therefore be key in 2025 for all of these metals, and
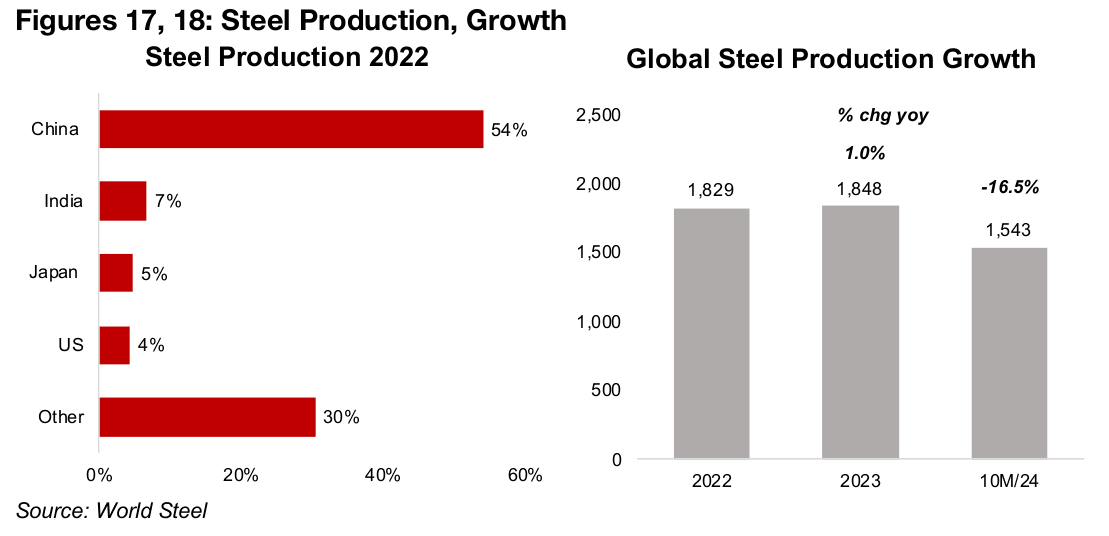
overall the outlook for the sector remains weak. The majority of steel demand comes
from China, where the two key sectors driving this, property and infrastructure, have
slowed considerably (Figure 17).
While there have been stimulus measures by the country, they have not boosted
these steel-related metals much so far and could take time to drive a significant
revival of these sectors. Steel demand growth has also been slow from the rest of the
world, especially in H2/24, and steel production slumped -16.5% in 2024 through to
October 2024, after rising just 1.0% in 2023 (Figure 18). With both the AOCE and WB
forecasting a considerable continued decline for the iron ore price in 2025, it implies
that neither are expecting a dramatic rebound in steel demand for 2025.
Valuations high for broader market but low for mining sector
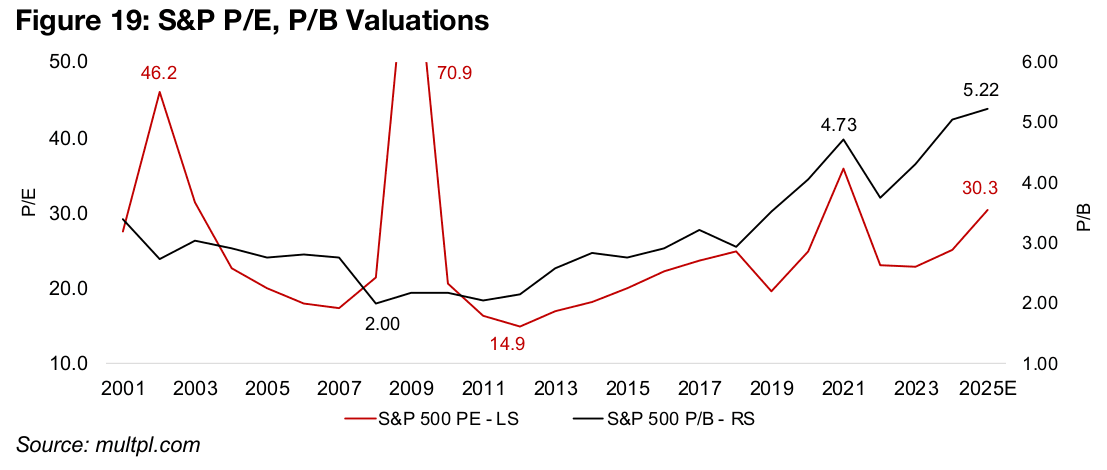
For the mining stocks, potential weakness in the metal prices will obviously be a key negative driver. Another major issue for stocks more broadly is high valuations levels, with the price/book ratio (P/B) of the S&P 500 at 5.22x, by far the highest in the past two decades (Figure 19). The S&P price to earnings ratio (P/E) is also elevated at 30.3x, having been surpassed only during extreme periods including the dot.com bust in the early 2000s, the 2008-2009 financial crisis and 2021 health crisis.
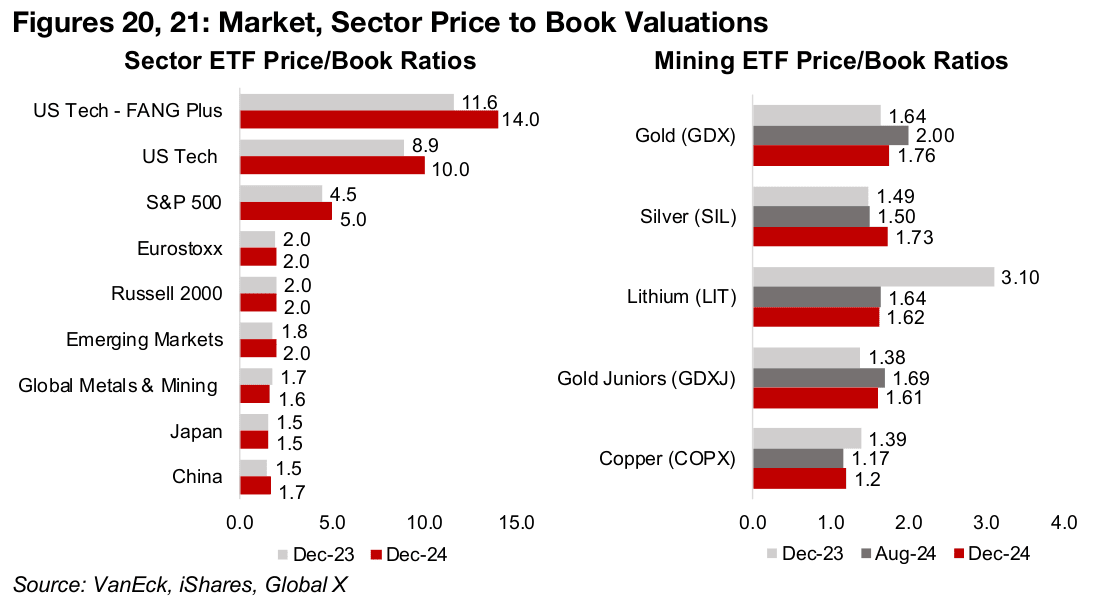
However, these high multiples have been driven largely by a few megacap tech
stocks, with the P/B valuation of the FANG ETF (Facebook, Apple, Netflix, Google
(Alphabet)), and US Tech rising this year, and pulling up the S&P 500 multiple. This
contrasts with the multiples of US small caps and other global markets and sectors
which have been flat overall and are at less than half the level of the S&P 500.
The mining stocks are certainly not showing any signs of investor exuberance, with a
P/B for the Global Metals and Mining ETF of just 1.6x in December 2024, down from
1.7x at the end of 2023, and near the bottom of global valuations. Even the surge in
gold and silver prices did not drive up these sectors’ stock valuations much, with the
P/Bs of the GDX ETF and SIL ETF of gold and silver producers and the GDXJ ETF of
gold juniors only edging up slightly. Even though the copper price saw a moderate
rise, the P/B of the COPX ETF of copper producers declined to just 1.2x, and the
valuation of the LIT lithium and battery tech ETF collapsed by about half to 1.6x this
year. The copper sector valuations look particularly low given that P/Bs of below 1.0x
for non-distressed companies are generally considered very inexpensive.
Caution on the gold bull market for the first time in five years
We had been bullish on gold at the start of last year, and the metal did not disappoint. While we were cautious on the base metals, some in this group performed reasonably well in 2024, but there were slumps for several others. For 2025, we are less certain on the gold outlook, although a shock in inflation or geopolitical risk could drive up the metal. For the base metals we see continued high risk, even more than already cautious major institutional forecasters, and overall see one of the most opaque outlooks for the metals in years. However, for the mining stocks we see a great deal of this risk as having been priced in, given low valuations which could provide a cushion for the sector heading into a particularly risky looking year.
Disclaimer: This report is for informational use only and should not be used an alternative to the financial and legal advice of a qualified professional in business planning and investment. We do not represent that forecasts in this report will lead to a specific outcome or result, and are not liable in the event of any business action taken in whole or in part as a result of the contents of this report.


