April 02, 2021
Valuations in a time of gold consolidation
Author - Ben McGregor
Gold rebounds off another bond-yield induced dip
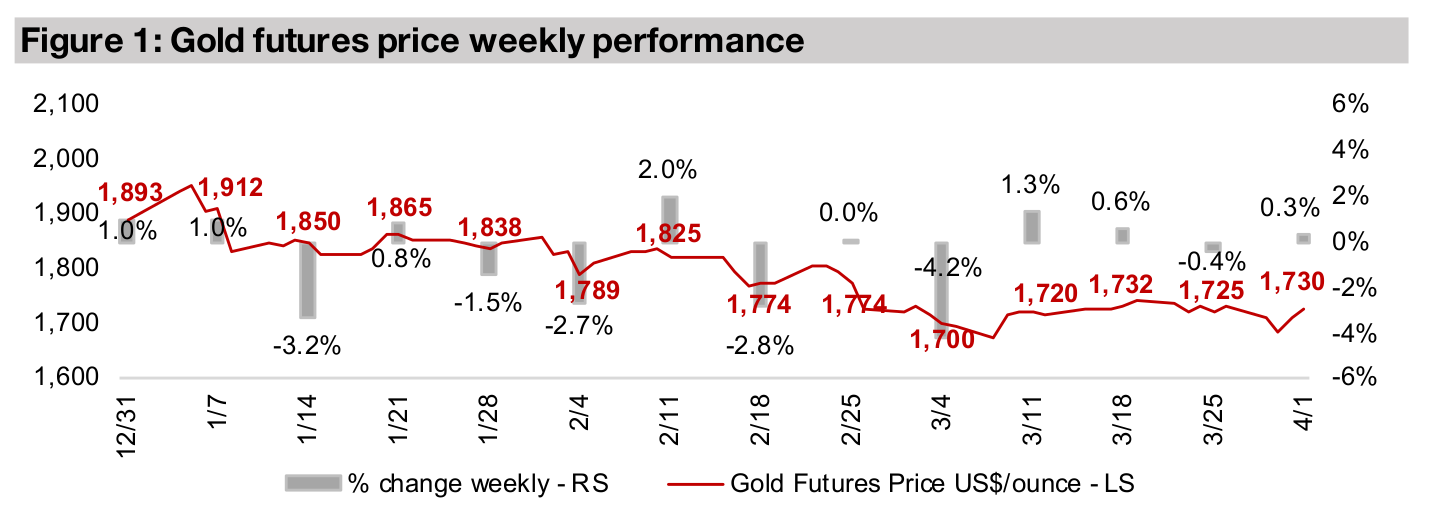
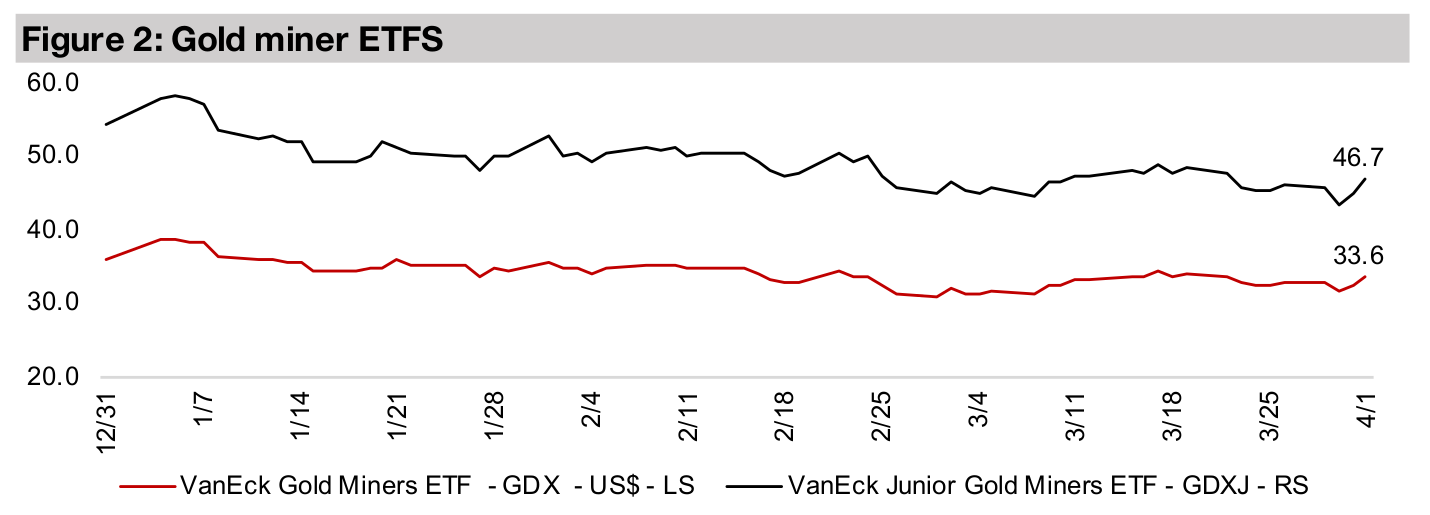
Gold edged up -0.3% this week to US$1,730/oz, bouncing off inter-week lows of $1,684/oz as a continued massive global major monetary expansion continues to offer strong support for the gold price.
Valuation changes for Canadian juniors as gold consolidates
This week we look at changes in the valuations of the larger Canadian junior gold miners in light of the gold price consolidation over the past few months, and find only a moderate contraction in multiples, and they are still well above late 2019 levels.

Gold rebounds hard off another bond-yield induced dip
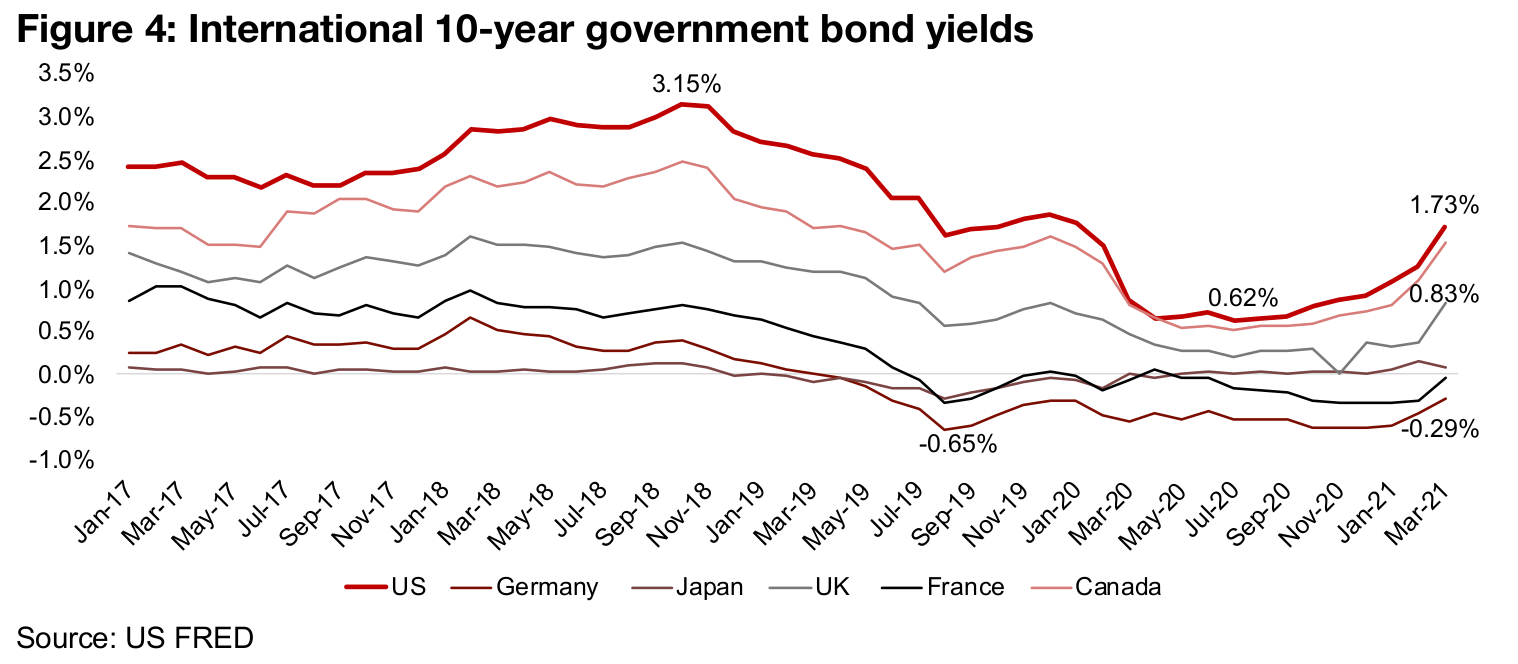
The gold price edged up 0.3% to US$1,730/oz, bouncing off lows during the week of US$1,684/oz, as gold again found considerable support below US$1,700/oz. The main driver for the ongoing decline in gold over the past few months has been a major rise in bond yields. Ten-year yields have jumped for most of the major global bond markets, with the US 10-year with the highest yield, at 1.73% in March 2021, nearly tripling from just 0.62% at the trough in July 2020 (Figure 4). The idea is that this has been driven by rising inflation expectations, which has in turn been driven by the recovery in the economy. In normal times, inflation might indicate an underlying secular improvement in demand, and be a 'natural' part of a growing economy, and in this case there could be an argument to exit yieldless gold and move into assets offering a yield, like bonds, or even equity.
An abnormal upcycle artificially inflated by monetary deluge
However, these are far from normal times, and in contrast to a virtuous, natural
economic upcycle, this recovery has been entirely driven by an absolutely epic
increase in the money supply, especially in the US, but also across other major
economies, including Europe and Japan. Yields have risen because of a massive
oversupply of bonds coming onto to the market driven by this monetary expansion,
and this is hardly a time for investors to rush into bonds for yields, but rather a time
to pull back further, and move to safer assets that can't easily be devalued by money
printing. And gold is the number one asset (for the past 3,000 years) to do just that.
Figures 5 to 7 shows the epic proportions of the monetary expansion, especially in
the US, based on the M3 money supply. We had previously used the M1 money
supply for similar charts in earlier reports, which is more up to date as it is reported
weekly, but this series was discontinued over the past month, and the monthly M1
was recalculated, so that yoy comparisons can't really be made currently, which was
interesting timing.
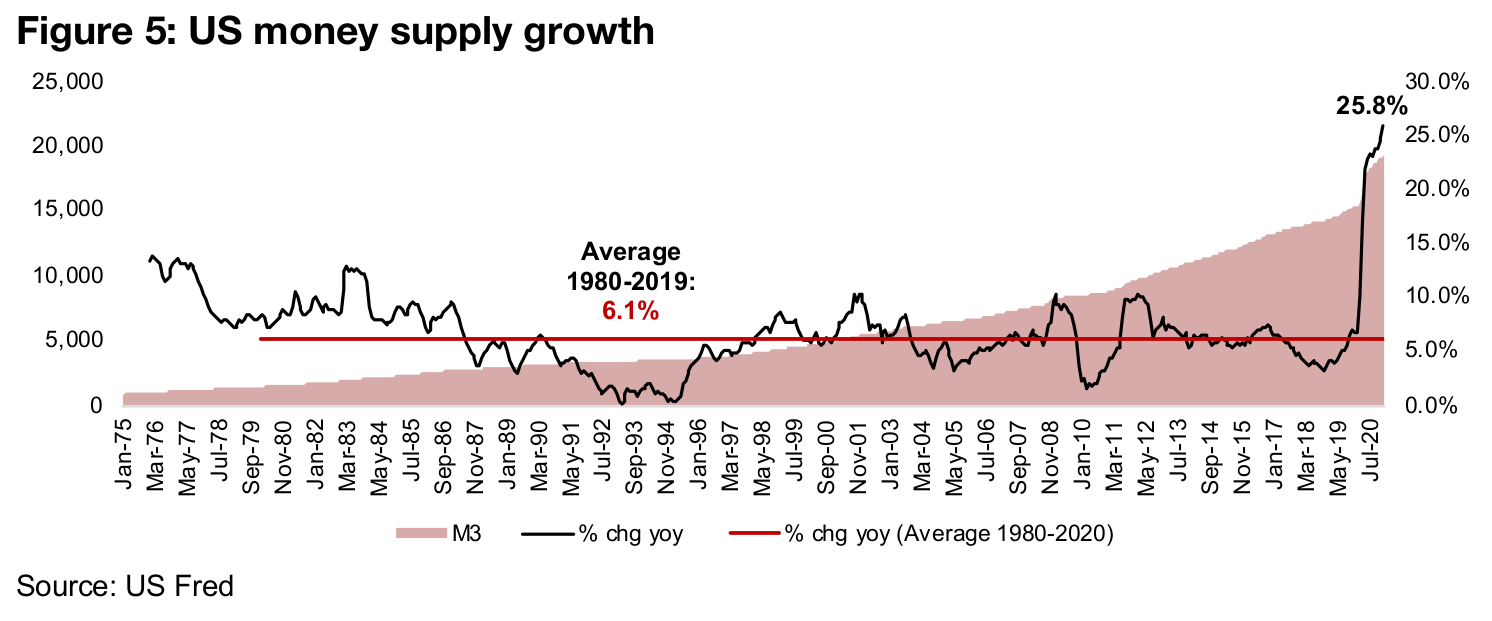
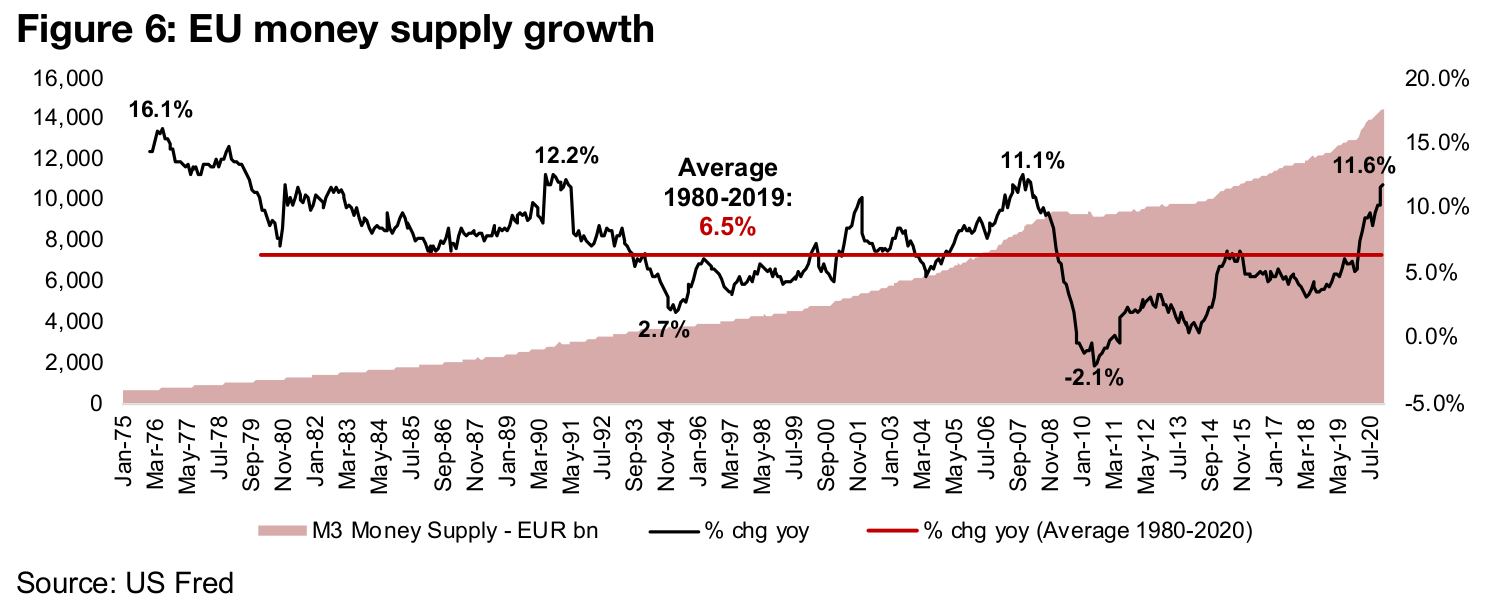
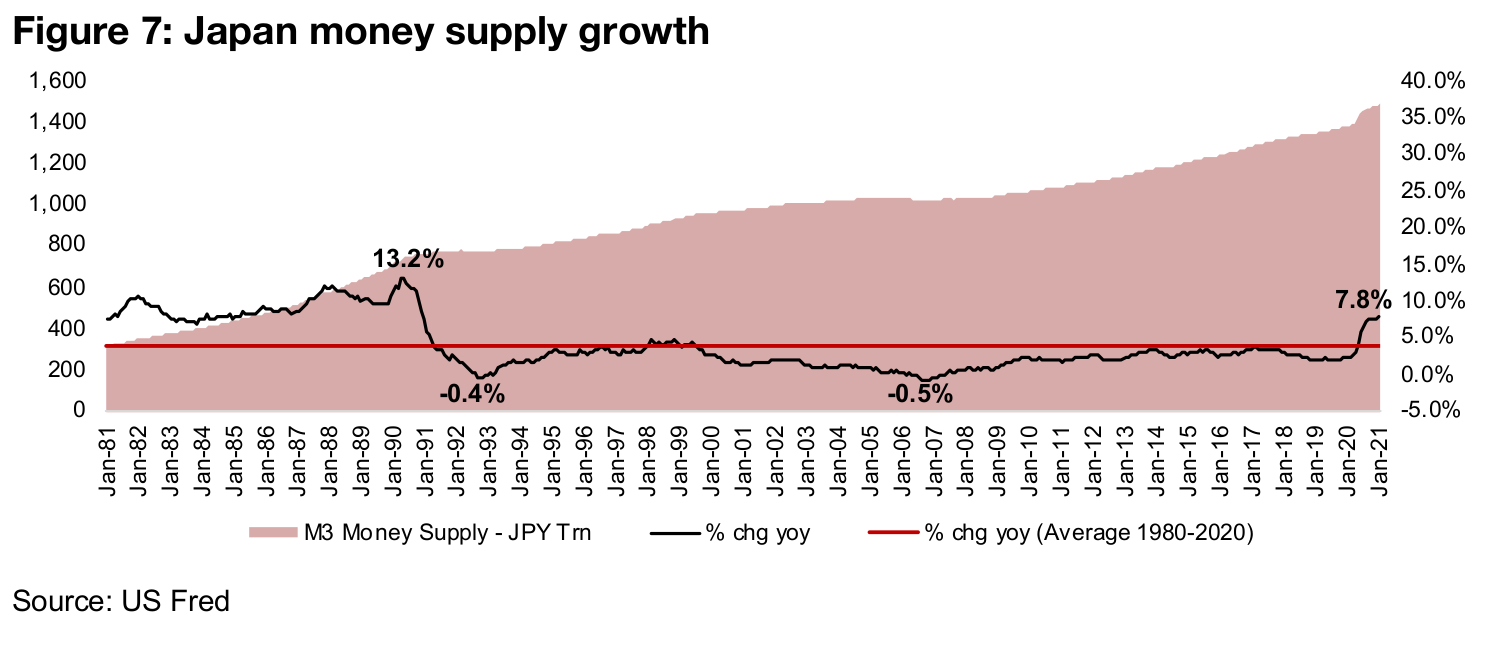
M1 had been growing at a massive 70% or more in the US as of our last calculation,
and while M3 growth is far lower at 25.8%, it is still extreme versus its history, and
while M3 growth for Europe and Japan are not as severe as in the US, the growth is
clearly already far above historical averages. And this data runs only to February 2021,
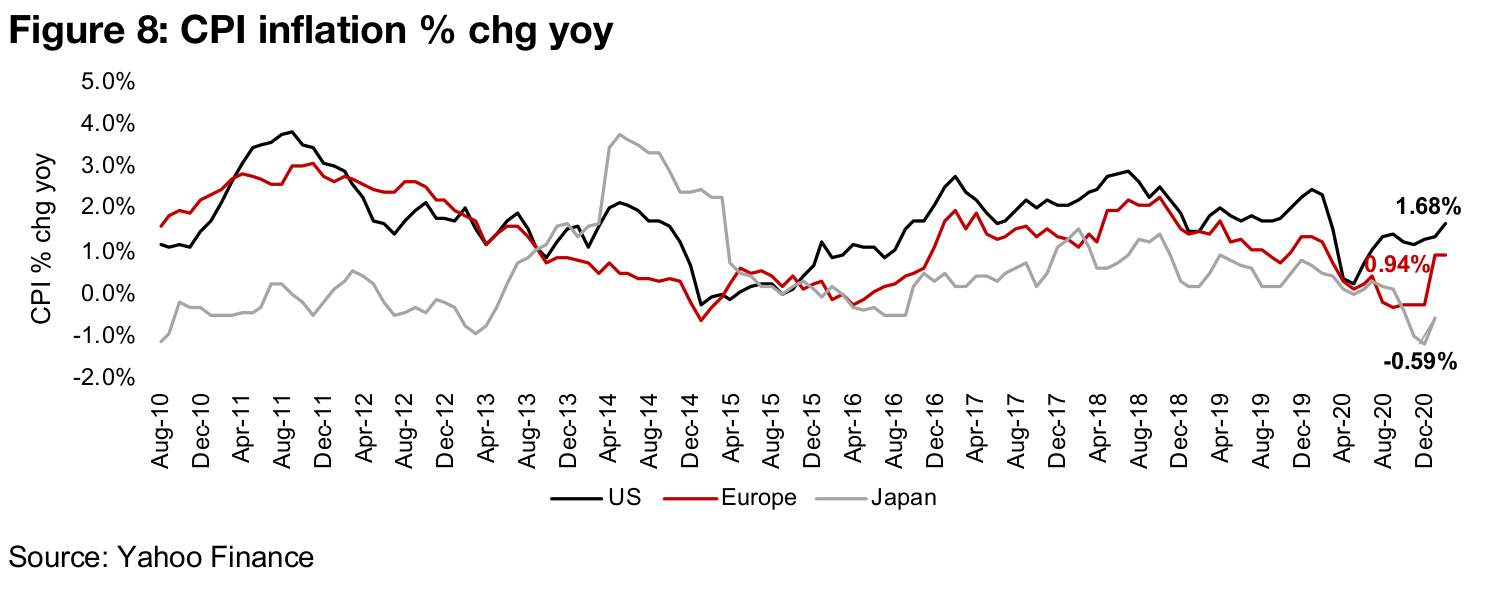
and the pace of growth may have continued to increase in March 2021. As has been
the case for the last decade or more, the money supply is not translating strongly into
rises in consumer price inflation, as shown by the CPI growth of US, Europe and
Japan in Figure 8.
It has however, clearly shown up in equity prices, which continue to hit news highs in
many global markets, and in alternative assets like Bitcoin, which has surged in recent
months (apart from its typical bouts of short-term volatility). All of this has translated
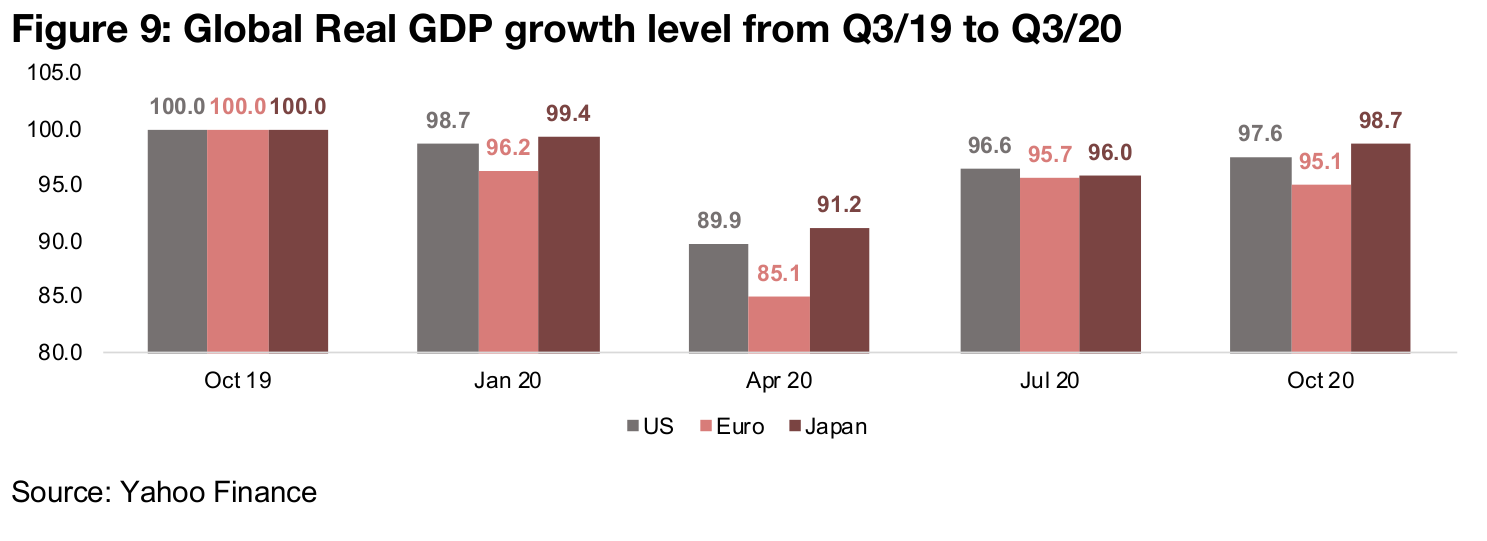
to a strong economic rebound, with US, Europe and Japan real GDP growth heading
back near their pre-crisis levels as of Q3/20, and could breach this levels as early as
Q4/20 (Figure 9). In our view, if a major inflation that does move into consumer prices
is indeed on the way, it is hardly time to run to fixed income to pick up some still very
low yields, even considering the recent rise, and more a period to consider expanding
protection. And few assets are better than gold for this, given the current situation.
Canadian junior gold drilling results so far
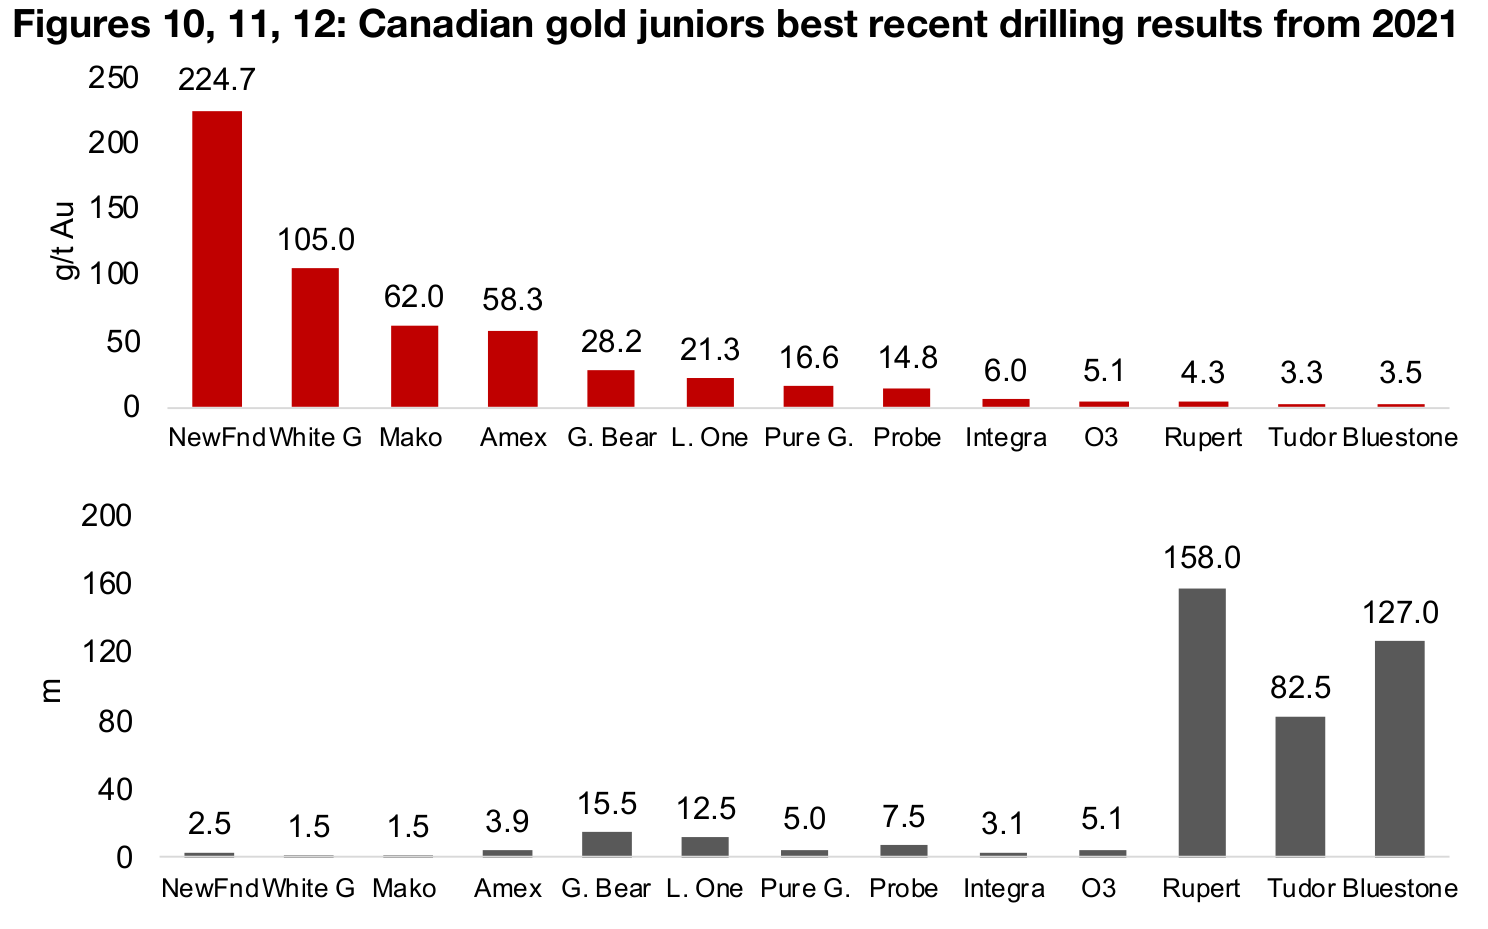
As gold prices continue to remain high for their second consecutive year, and there is increased availability of capital and opportunity to expand exploration, strong drill results are an important driver in drawing in funding. Figures 10, 11, and 12 show the top drill results from the larger TSXV-listed gold juniors since the start of 2021. Newfoundgold's Queensway project, has produced by far the best result, at 224.7 g/t Au, although over a short interval of just 2.5 m, and is the only leading result from a larger cap firm. There were also strong grade results from smaller cap companies White Gold, with 105.0 g/t Au over 1.5 m, Mako Making, 62.0 g/t Au over 1.5 m and Amex, 58.3 gt Au over 3.9 m. The other outstanding results were low grade, but over larger intervals, all from mid-cap companies, 4.3 g/t Au from Rupert over 158.0, 3.3 g/t Au from Tudor over 82.5 m, and from Bluestone 3.5 Au g/t over 127.0 m.

Canadian junior multiples down only moderately on lower gold
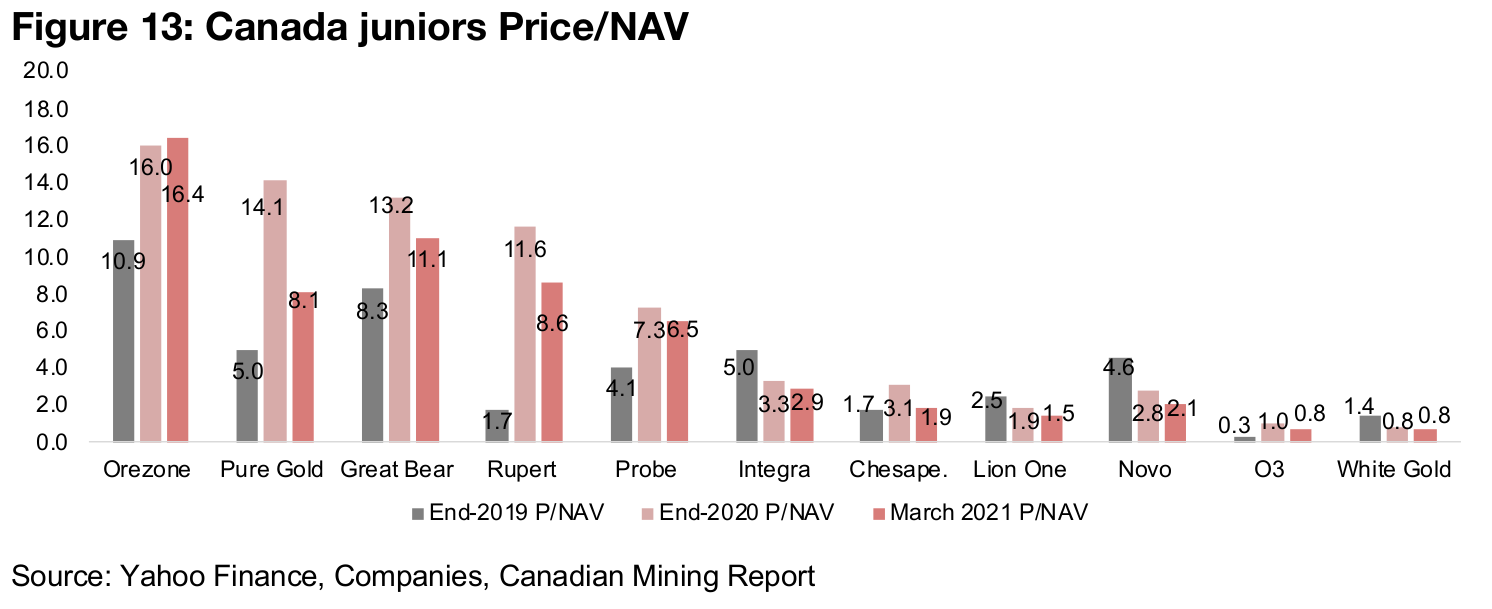
Given the run up in the gold price to Q3/20, and then the subsequent decline, we would expect to see considerable shifts in valuation multiples. Looking at Price/NAV, a commonly used multiple for juniors, we see considerable expansion from end-2019 to end-2020 driven by the gold price (Figure 13). Interestingly, however, even though the gold price has declined to levels closer to early 2020, multiples for most of these juniors have only contracted moderately, with Orezone, Great Bear, Probe and Integra especially seeing only slight declines in their Price/NAV since the end of 2020.
Novo, Lion One and Pure Gold see highest EV/Resource valuation
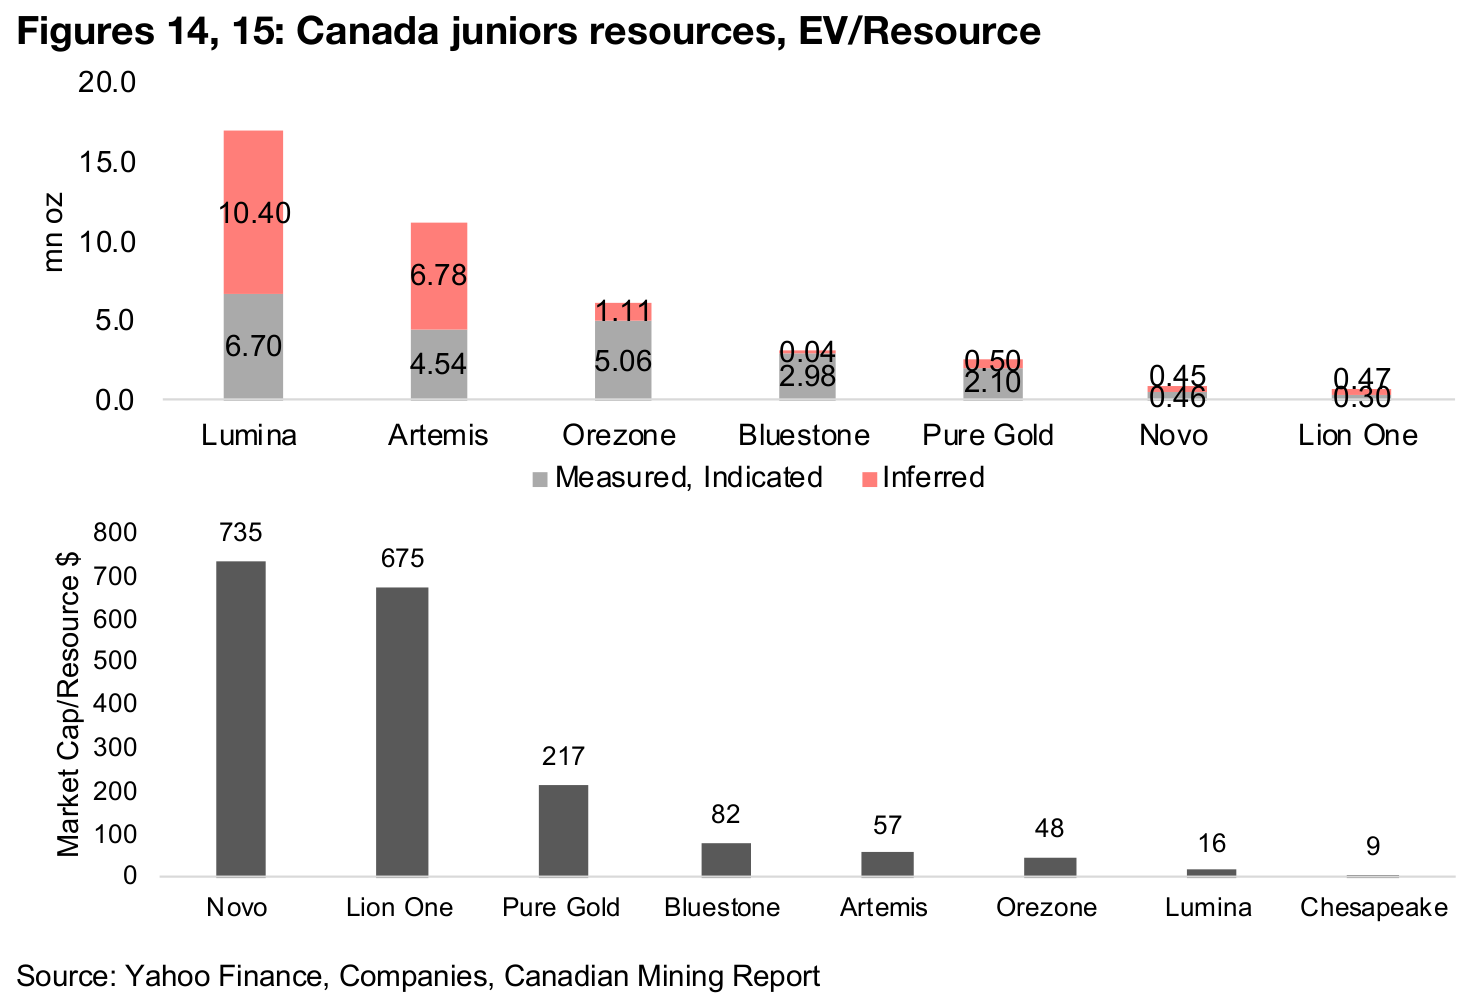
Figures 14 and 15 show the Canadian junior gold stocks that have reported Resources, both Measured, Indicated and Inferred, and Market Cap/Resource. While Lumina, with 17.1mn oz of gold, Artemis, with 11.3 mn oz and Orezone, with 6.2mn, have the largest reported resources, although the market is only paying $16/oz, $58/oz and $45/oz in market cap per ounce. The market is paying the highest Market Cap/Resource for Novo, at $786, with 0.90 mn oz, Lion One, at $670 with 0.77 mn oz and Pure Gold, at $267, with 2.6mn oz.
Producing miners nearly all up on gold rebound
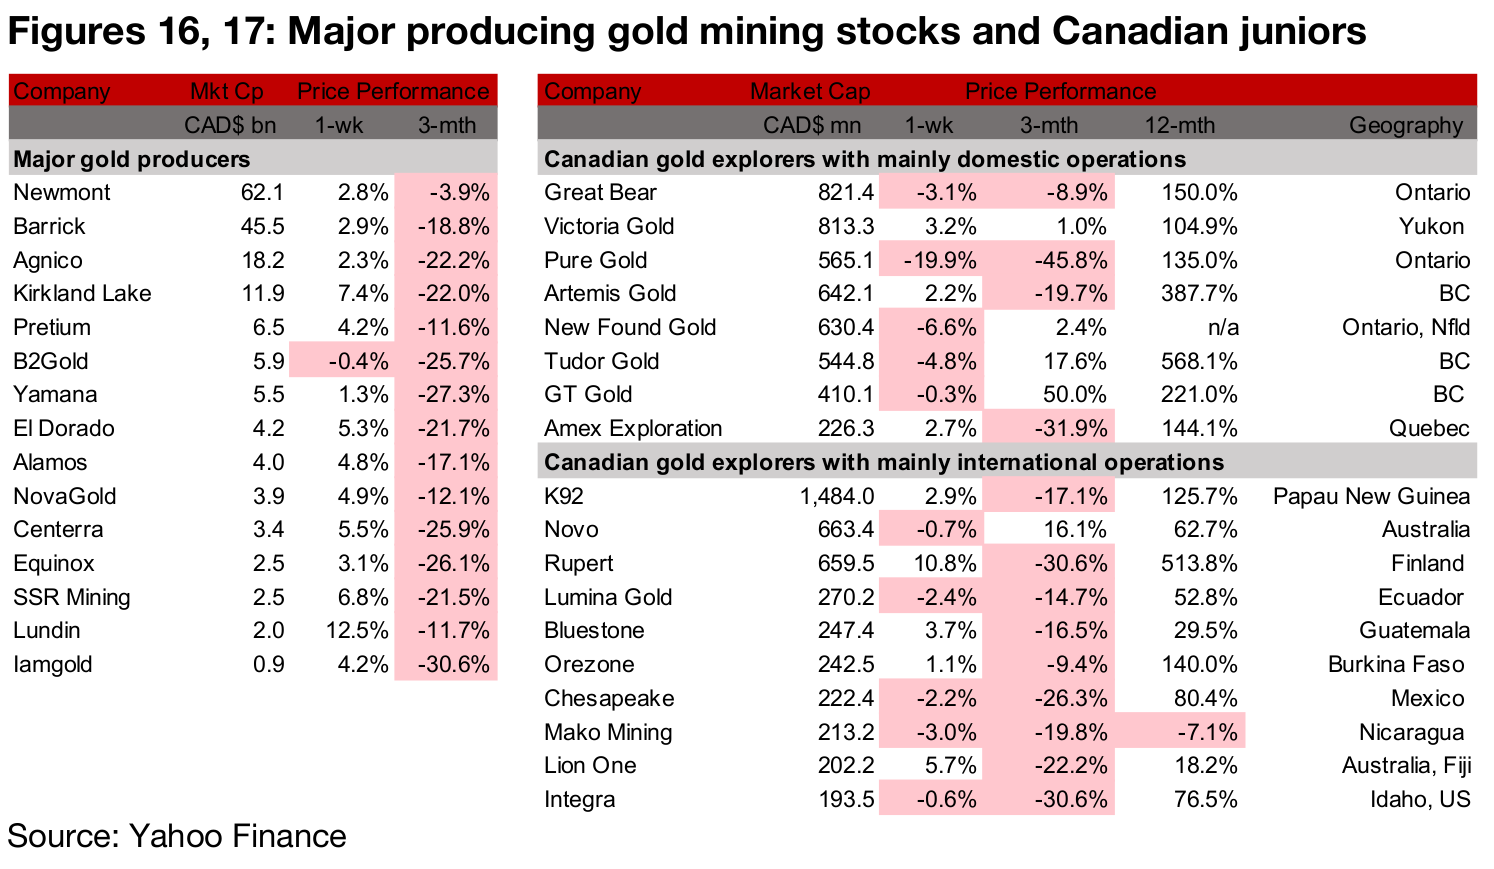
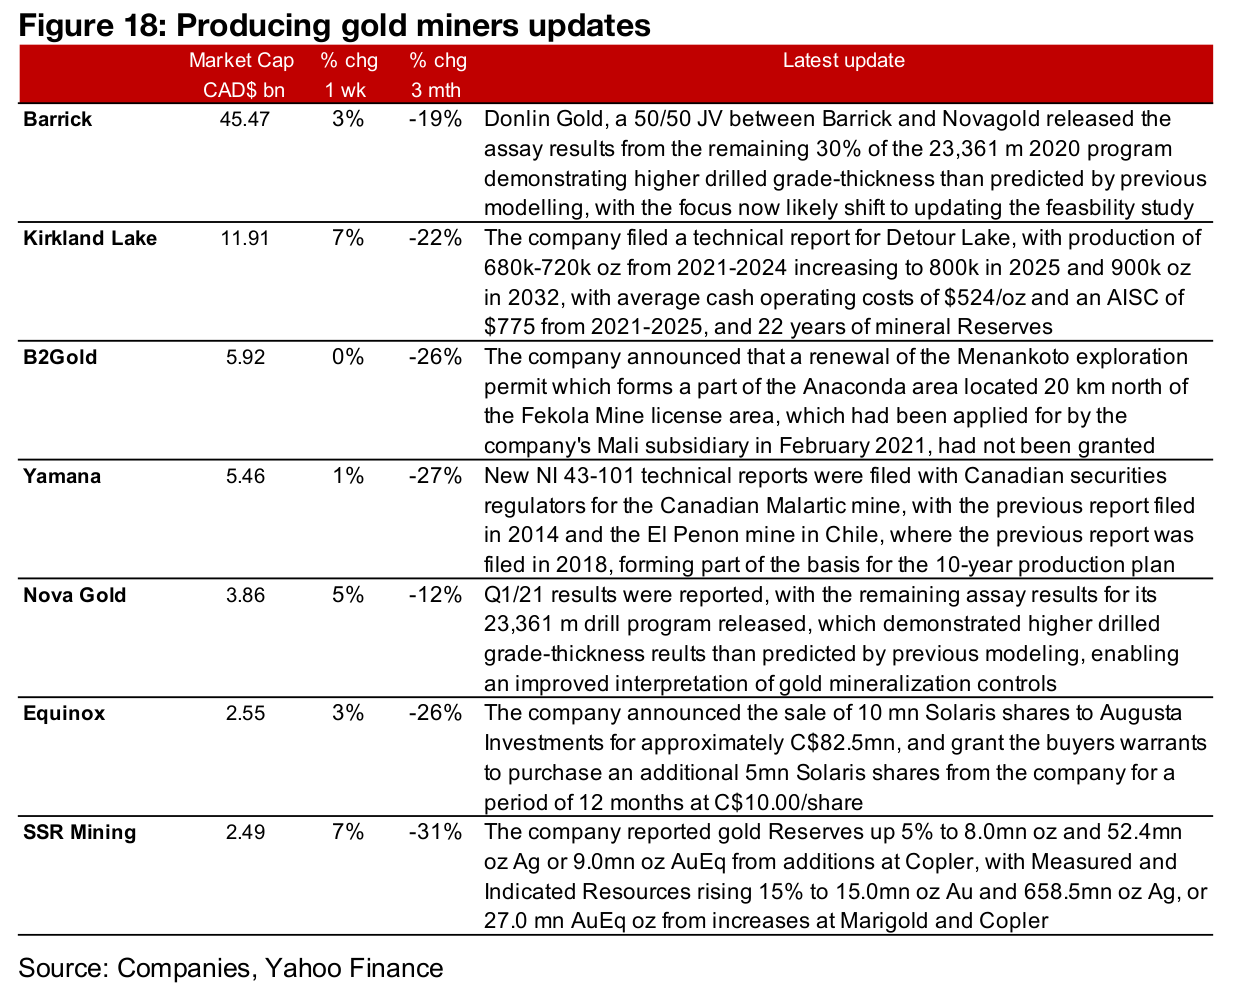
Almost all of the large gold producers were up this week as the gold price bounced (Figure 16). Barrick and Novagold announced assays from the remaining 30% of the 2020 drilling program at its 50/50 Donlin JV, Kirkland filed a technical report for Detour Lake, and B2Gold reported that a permit renewal for Menankoto had not been renewed. Yamana issued new technical reports for Canadian Malartic and El Penon in Chile, Equinox announced the sale Solaris shares to Augusta Investments and SSR Mining reported an increase in its gold reserves for 2020, after accounting for the effect of its merger with Alacer Gold (Figure 18).
Canadian juniors mixed even as gold recovers
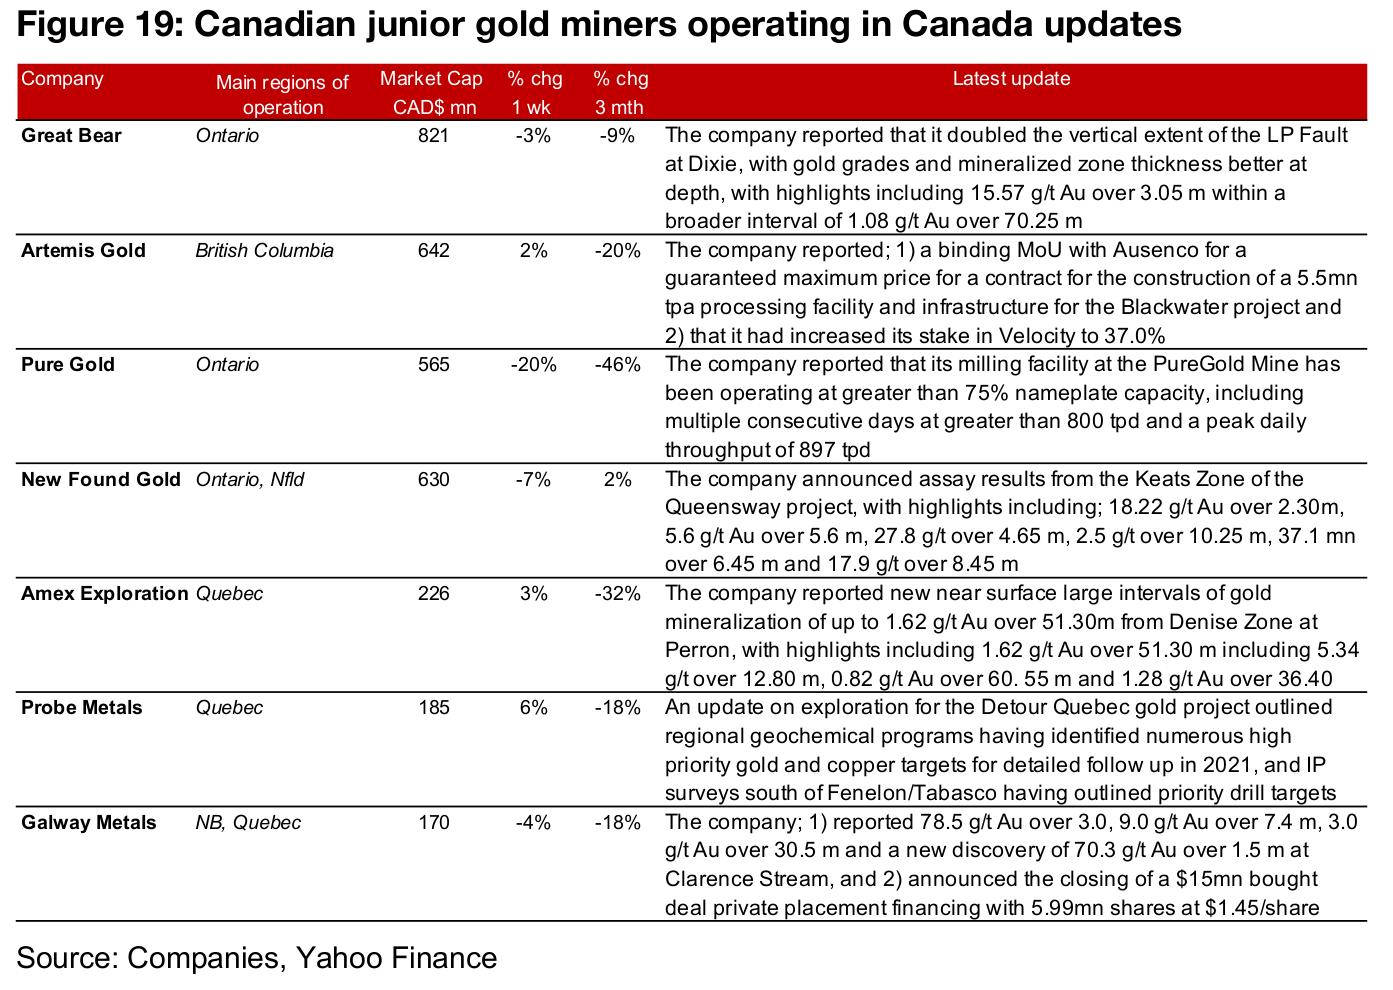
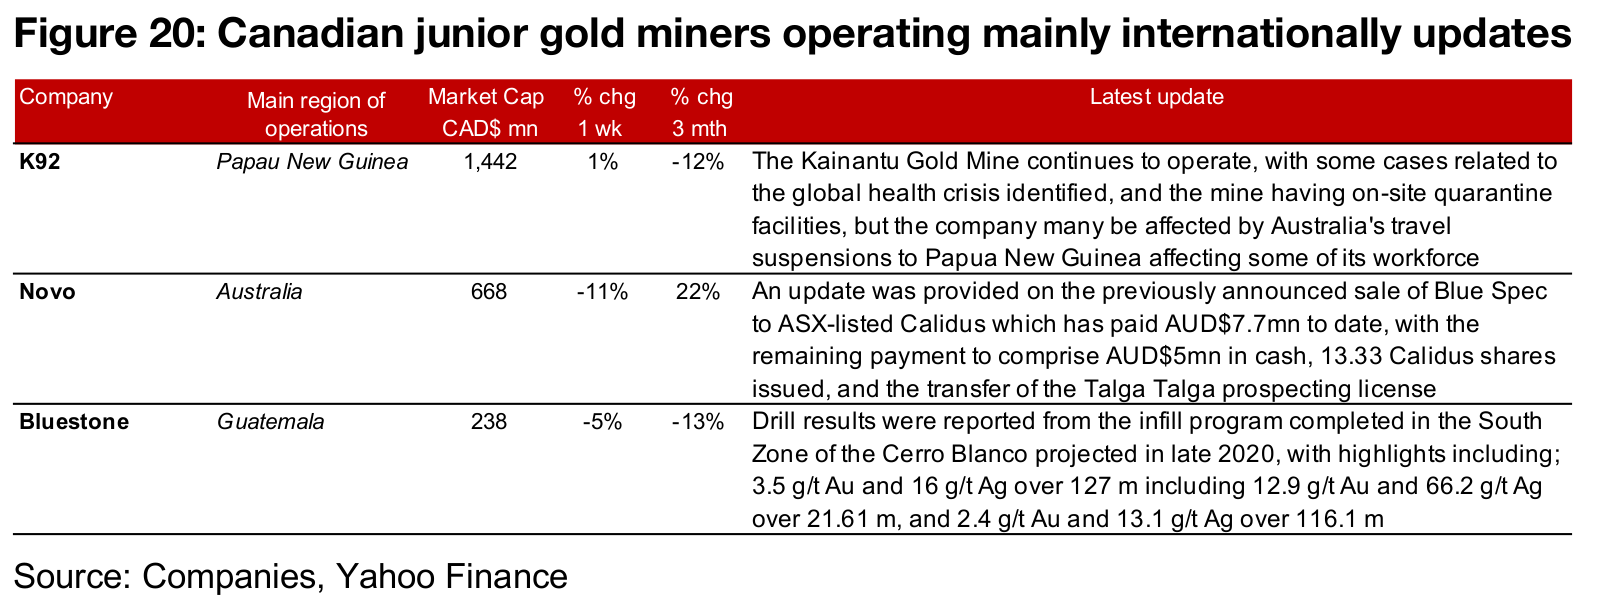
The Canadian juniors were mixed this week even on the rise in gold price as there was a series of company specific news (Figure 17). For the Canadian juniors operating mainly domestically, Great Bear reported drill results at its Dixie project, Artemis Gold reported a binding MoU with Ausenco for project construction and purchased shares of Volatility, Pure Gold provided an update on operations at their mine. Newfoundgold and Amex announced exploration results, Probe announced its exploration plan for Detour Gold and Galway reported drill results and the completion of its private placement (Figure 19). For the Canadian juniors operating mostly internationally, K92 Mining reported Q4/20 results, Orezone gave on update on progress at Bombore and Mako reported results from infill drilling at San Albino and the sale of the Marlin Gold Mine in Mexico (Figure 20).
Disclaimer: This report is for informational use only and should not be used an alternative to the financial and legal advice of a qualified professional in business planning and investment. We do not represent that forecasts in this report will lead to a specific outcome or result, and are not liable in the event of any business action taken in whole or in part as a result of the contents of this report.


