February 24, 2025
TSXV Mining Outperforms
Author - Ben McGregor
Gold rebounds on continued high global risk
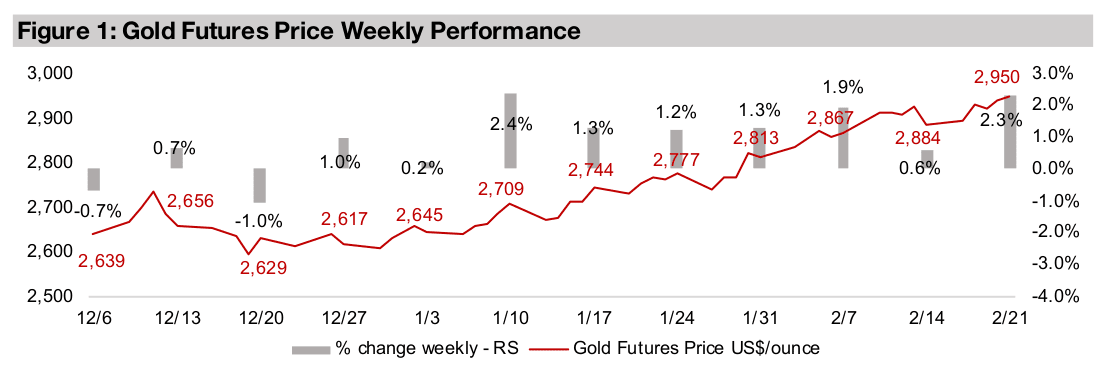
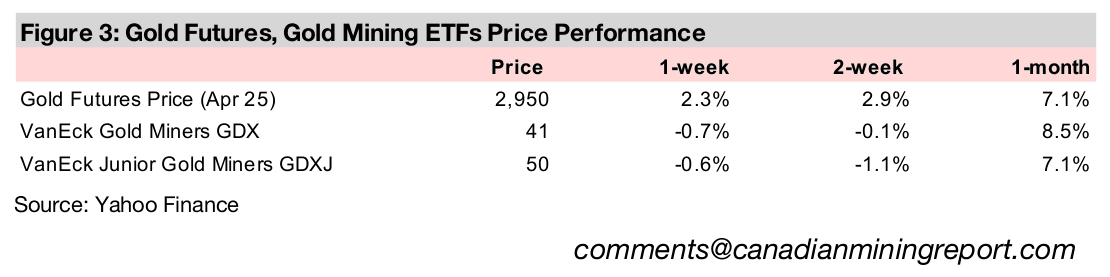
Gold rebounded from a brief slide last week, gaining 2.3% and reaching a new all- time high of US$2,950/oz as market concerns of an economic slowdown and rising inflation and geopolitical risk continued to drive hedging with safe haven assets.
Central banks pull back on gold, retail piles into metal’s ETFs
While central banks’ net gold purchases of -8.1 tonnes turned negative in December 2024 for the first time since early 2023, inflows into gold ETFs surged to US$23.6bn in January 2025, which was nearly half the US$56.5bn total for all of 2024.
Gold stocks dip, TSXV mining outperforms, tech bull shifts to China
Gold stocks dipped as the metal gain did not offset an equities decline, although the metal’s rise for the past two months has continued to drive up the TSXV mining sector, while the tech bull market is faltering in the US and seems to have shifted to China.


TSXV Mining Outperforms
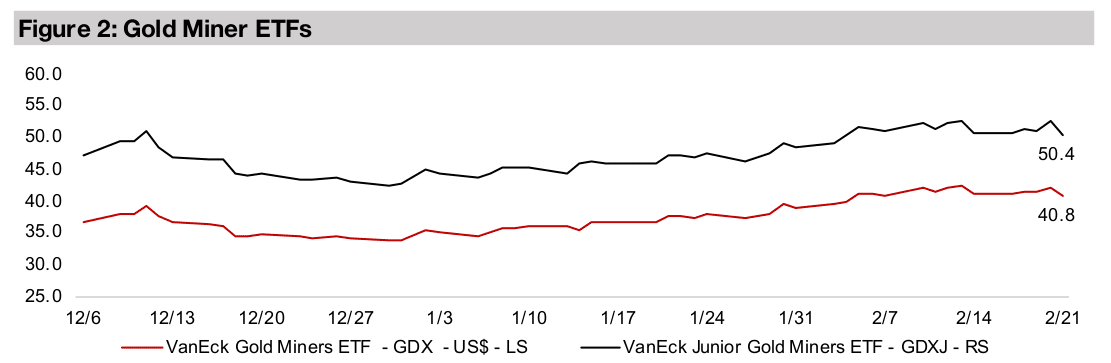
The gold price rebounded from a brief dip last week, gaining 2.3% and setting a new high at US$2,950/oz with market concerns over a slowdown in global growth and rising inflation and geopolitical tension continuing to boost the safe haven asset. These increased risks had the opposite effect on equities, with the S&P 500 off -1.7%, the Nasdaq down -2.2% and Russell 200 slumping -4.0%. While gold stocks outperformed the broader indices on the metal’s strength, they still declined moderately, with the GDX and GDXJ down -0.6% and -0.7%, respectively.
Tech bull leaves the US and moves to China
One of the big issues driving the decline in the US markets has been weakness in the
tech sector, which through 2023 and 2024 had been the major driver of the S&P 500
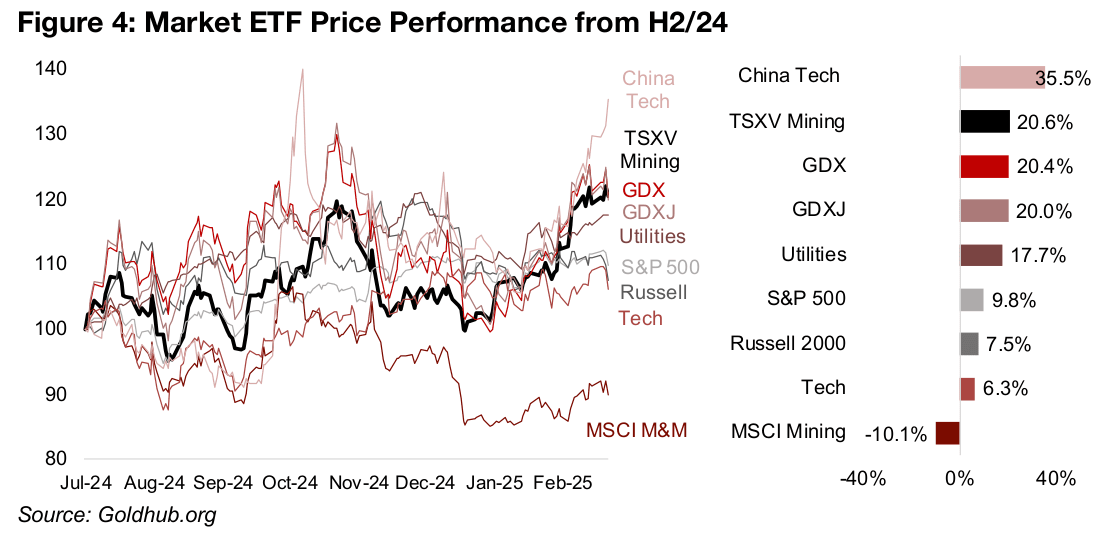
and the Nasdaq. The US tech sector has gained just 6.3% since H2/24, significantly
underperforming the 9.8% gain in the S&P 500, the first time this has happened for
an extended period in several years (Figure 4). Even the Russell 2000 small cap index
has outperformed tech, up 7.5% since H2/24, showing that the market is finally
shifting its focus towards risky assets in other sectors.
However, the tech bull market is not necessarily over, and it seems to have just shifted
over to China, after news of a much lower cost AI from Deepseek in late January 2025
caused the entire sector to surge. China tech is up 35.5% since H2/24, with most of
this in just the past two months, and this is six times the gains in US tech over the
same period. The China tech boom could also still have more room to run, given that
valuations in the sector have not gotten that extreme, even after the big gains. The
price to book (P/B) for China tech is just 2.5x and the price to earnings (P/E) is 19.2x,
which is not that much of a gap with the China market overall, at a 1.9x PB and 17.1x
PE (Figure 5).
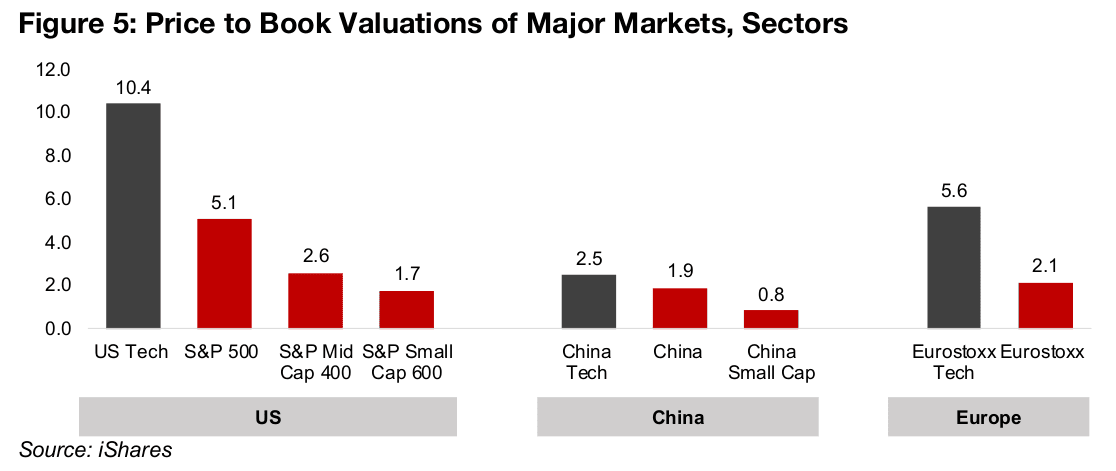
This contrasts the US tech sector multiple at more than double the S&P 500, at 10.4x
versus 5.1x. We also need to consider that big tech is a huge proportion of the S&P
500 and pulling the average up significantly. Looking at the S&P beyond big tech
shows that valuations for the broader market are much more subdued, with a price
to book of 2.6x for the Mid Cap 400 and 1.7x for the Small Cap 600. While European
tech at a 5.6x P/B is also about double the broader market, with the Eurostoxx at just
2.1x, both these figures are only about half the respective US levels.
Overall it appears that US tech especially, but also European tech, do not seem to be
pricing in much downside, increasing the risk that these valuations eventually
contract back towards the broader market. That China is starting to divert some of
the tech inflows could be a catalyst for this, especially given the much lower
valuations in the sector. It is also not just the shift to China that is a risk for Western
tech, but also wider move towards more hedging of positions that has gained pace
especially since mid-2024. This has included the clear outperformance of utilities,
considered one of the most defensive sectors, up 17.7% since H2/24, nearly three
times the level of US tech. This is a major turn around from tech’s major
outperformance of utilities in 2023 and into early 2024.
TSXV Mining’s gold-driven outperformance
The strong performance of the gold stocks since H2/24 has also been part of this
move towards risk hedging by the markets, and both major producers and juniors
have benefited, with the GDX and GDXJ up 20.4% and 20.0%, respectively. One
interesting development has been that the TSXV Mining sector has actually
outperformed both of the sectors, rising 20.6%. The sector might have been
expected to lag major gold ETFs driven a drag from a large market cap weighting to
weakening copper and lithium stocks, but also as the index comprises mostly
particularly risky pre-revenue juniors. However, apparently, this has been more than
offset by the gold sector, by far the largest TSXV Mining sector by market cap.
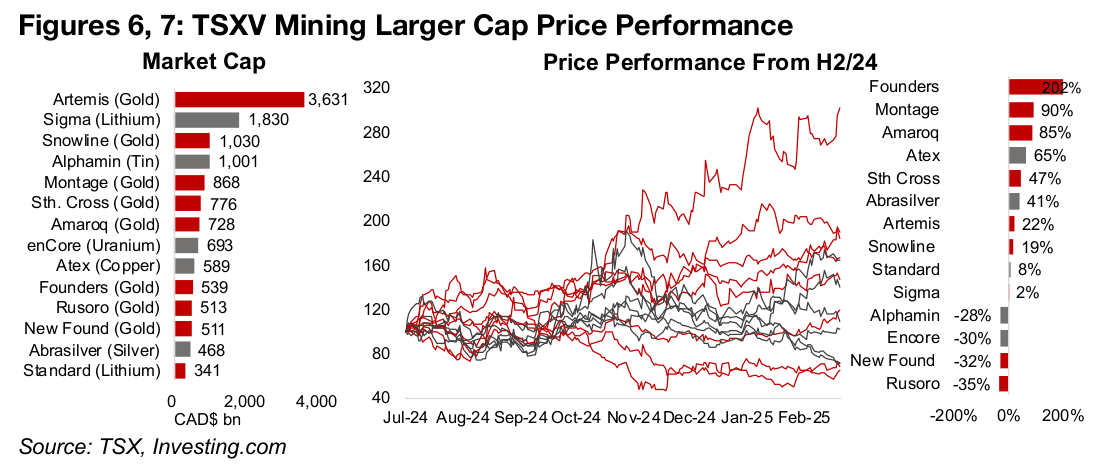
Much of the gains in TSXV Mining since H2/24 have been over the past couple of
months, which is a period when many of the top fifteen stocks in the index,
comprising about 30% of the total market cap, have been relatively flat or even down
(Figures 6, 7). Only the gold stock Founders Metals and copper stock Atex Resources
have seen major gains over the past two months, and are both are in the bottom half
of the group in terms of market cap. This indicates that the gains in the TSXV have
not been concentrated in these top stocks and have are coming at least from the
mid-caps and potentially down into even the small caps on the index. This shows
that the market is finally moving more broadly into junior gold stocks.
Pullback in Central Bank gold buying in December 2024
While the gold trade seems to be going more mainstream and likely attracting more
retail interest, including for some of the smaller and riskier juniors, central banks have
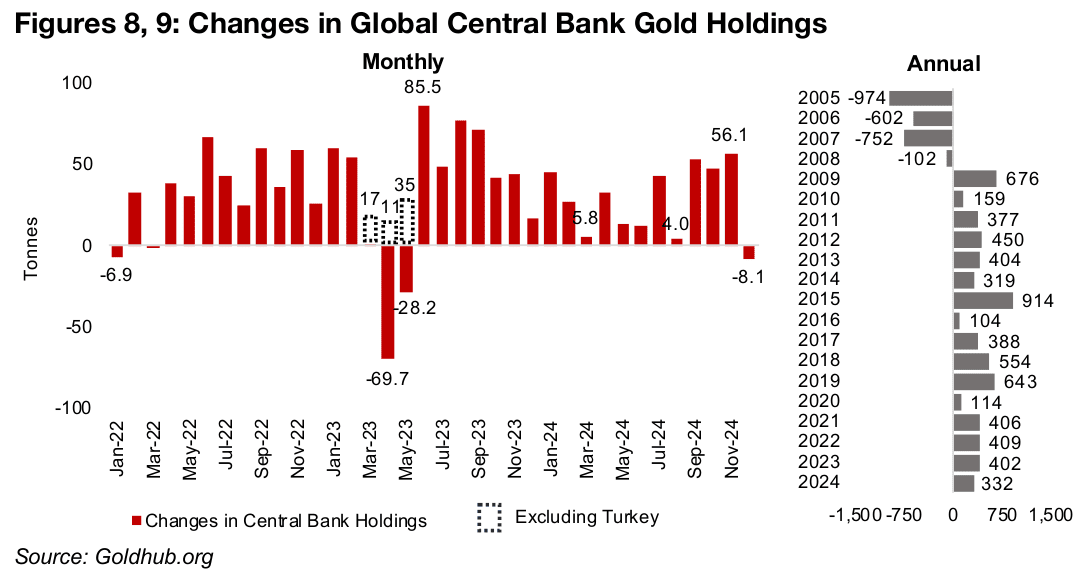
actually pulled back on purchases as of the most recently reported data. Central
banks sold a net -8.1 tonnes of gold in December 2024, its lowest in three years,
since -6.9 tonnes in January 2022, excluding the extraordinary declines in early 2023,
driven almost entirely by financial system issues in Turkey (Figure 8).
The timing is interesting as central banks had been such major buyers from 2021 to
2023 at over 400 tonnes per year even as gold saw less interest from the wider
markets and remained range bound at around an average US$1,800/oz (Figure 9).
They have been buyers since the financial crisis started in 2009 and continued to add
positions throughout the gold bear market. This included the largest net purchases
of the past two decades in 2015, at 915 tonnes, which was near the bottom for the
gold price. Given central banks’ solid track record of well-timed gold purchases over
the past fifteen years, that they eased off on net purchases in 2024 to 332 tonnes
could be a sign that the bull market is maturing. They may be viewing the apparent
widening of gold’s popularity to the broader market in recent months as a sign that
the price is less of a great deal than it was a few years ago.
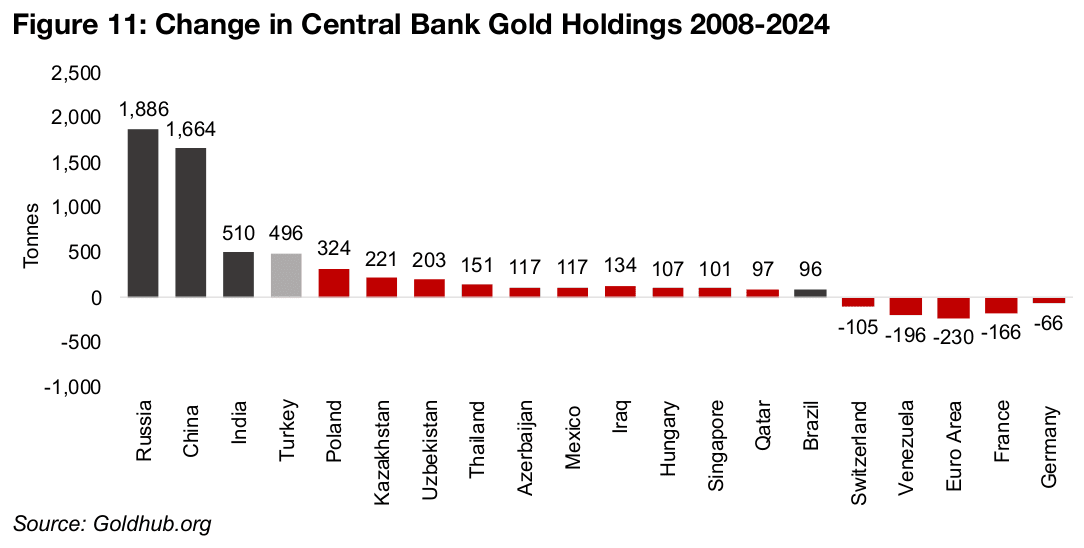
BRICs countries the big gold buyers over past fifteen years
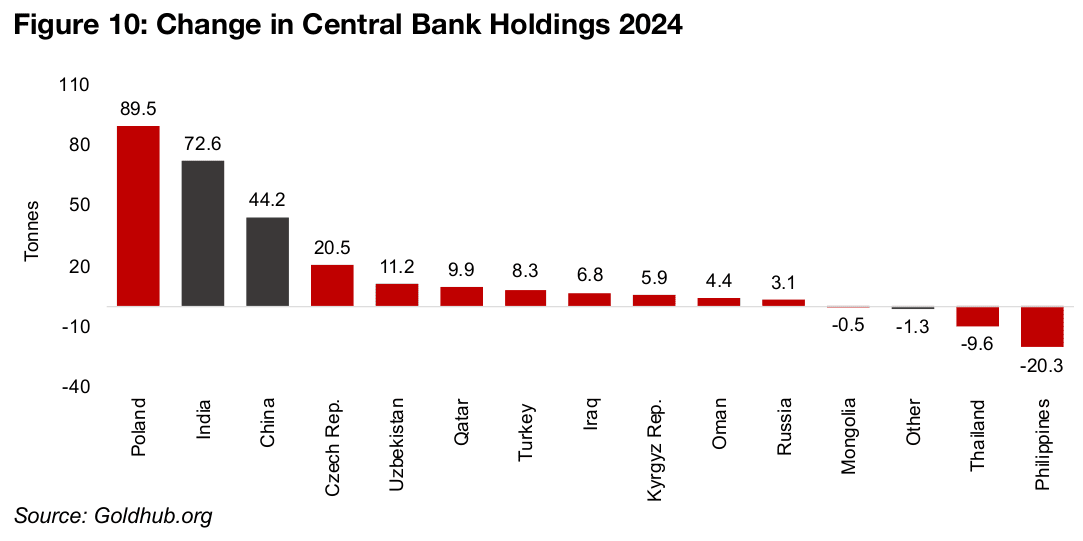
Central bank net gold purchases in 2024 were concentrated in Poland, India, China, and the Czech Republic, with 89.5, 72.6, 44.2 and 20.5 tonnes, respectively (Figure 10). There was comparably smaller net buying by several other countries and significant net selling by Thailand the Philippines, at -9.6 and -20.3 tonnes. However, the leading countries for net gold purchases in a single year can vary considerably, and the longer-term aggregate purchases give a clearer picture of which banks are doing the big buying.
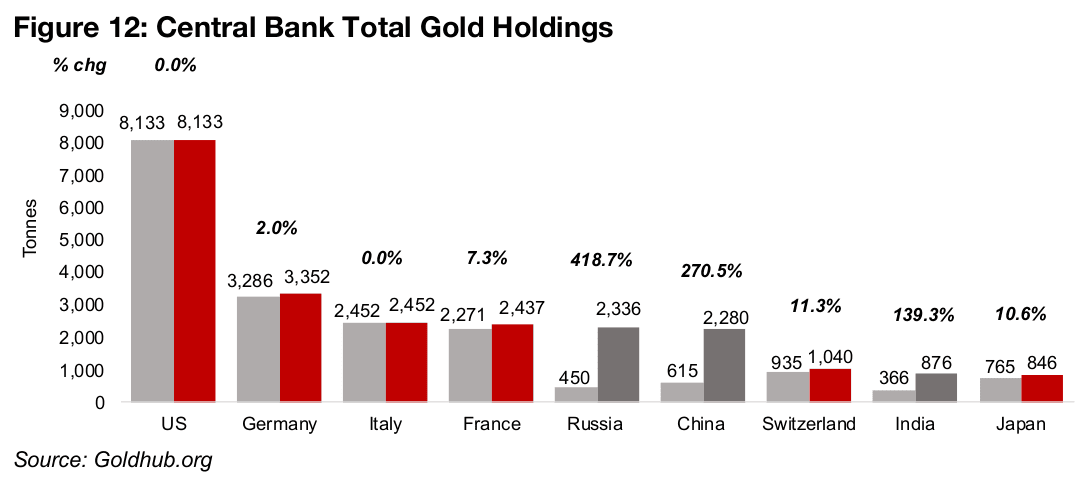
This has clearly been concentrated in the BRICs countries, with Russia, China and India leading from 2008-2024 at 1,886, 1,664 and 510 tonnes, respectively (Figure 11). The other major BRICs nation, Brazil, has seen comparably low net buying, at 96 tonnes, but Turkey, which is not a full member, but a ‘partner country’ has the fourth highest purchases at 496 tonnes. This has actually changed the rankings of the leading central banks in terms of gold holdings considerably over just the past fifteen years. Russia, China and India all had relatively small holdings in 2008, but these have increased 418.7%, 270.5% and 139.3% percent since, and become the fifth, sixth and eighth largest players globally (Figure 12). Historically the level of relative gold reserves has tended to be correlated with a country’s power in international affairs and implies gains for the BRICs nations over the past two decades.
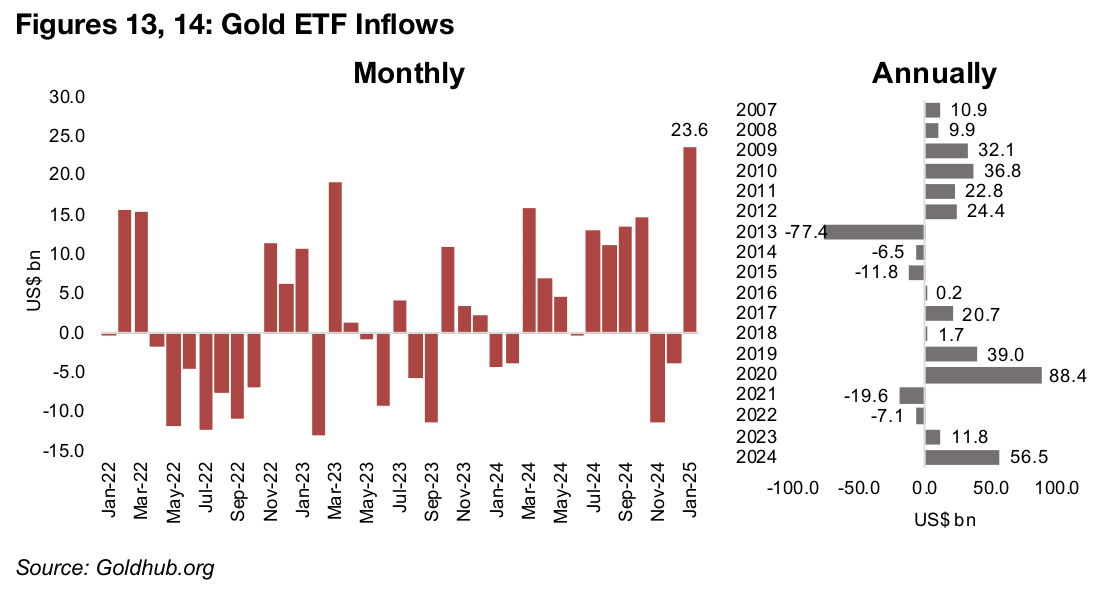
Gold ETF flows surge in January 2025
While the central banks have eased off recently on gold purchases, the broader retail market has piled into the metal. Inflows into gold sector ETFs spiked to US$23.6bn as of the most recently reported January 2025 data, which is already about half the entire 2024 inflows of US$56.5bn (Figures 13, 14). This is by far the strongest month in recent years and given the continued surge in the gold price in February 2025, the inflows this month could also be strong. The most recent highs for gold ETFs inflows was in 2020, at US$88.4bn, the second year of gold’s exit from the 2013-2018 bear market. The flows turned negative in 2021 and 2022 to US$-19.6bn and US$-7.1bn, before recovering to US$11.8bn in 2023.
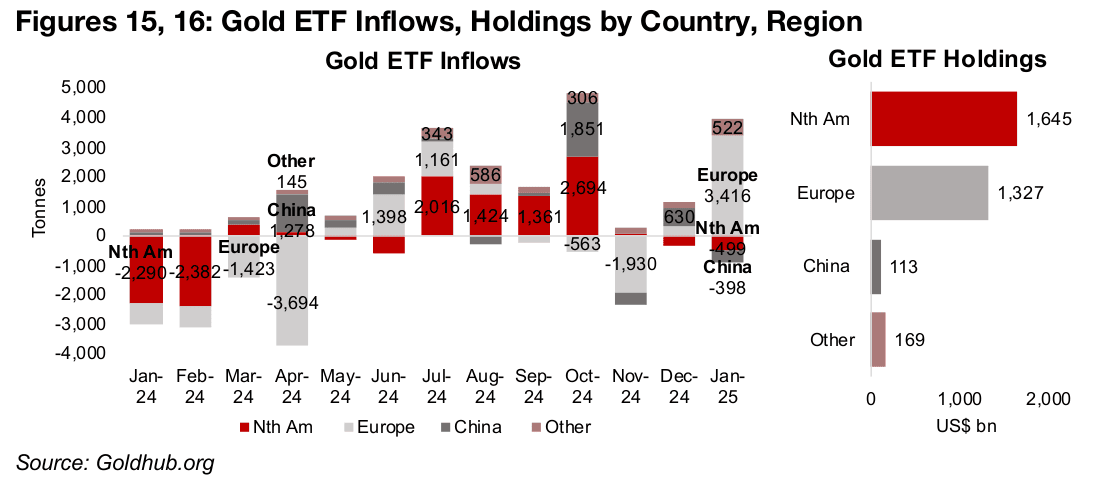
The ETF inflows in January 2025 were concentrated mainly in Europe, and this has more than reversed major net outflows in November 2024, with December 2024 seeing relatively small inflows (Figure 15). From July 2024 to October 2024 inflows were mainly concentrated in the US, with China also seeing a large rise in the last month of that period. Most of the gold ETF holdings remain concentrated in North America and Europe, at US$1,645bn and US$1,327bn, respectively, with China and the rest of the world at just US$113bn and US$169bn (Figure 16). However, China is one of the world’s two largest markets for gold jewelry along with India, and this could divert some of the gold investment from the retail market in the country that in the US and Europe would tend to flow into ETFs.
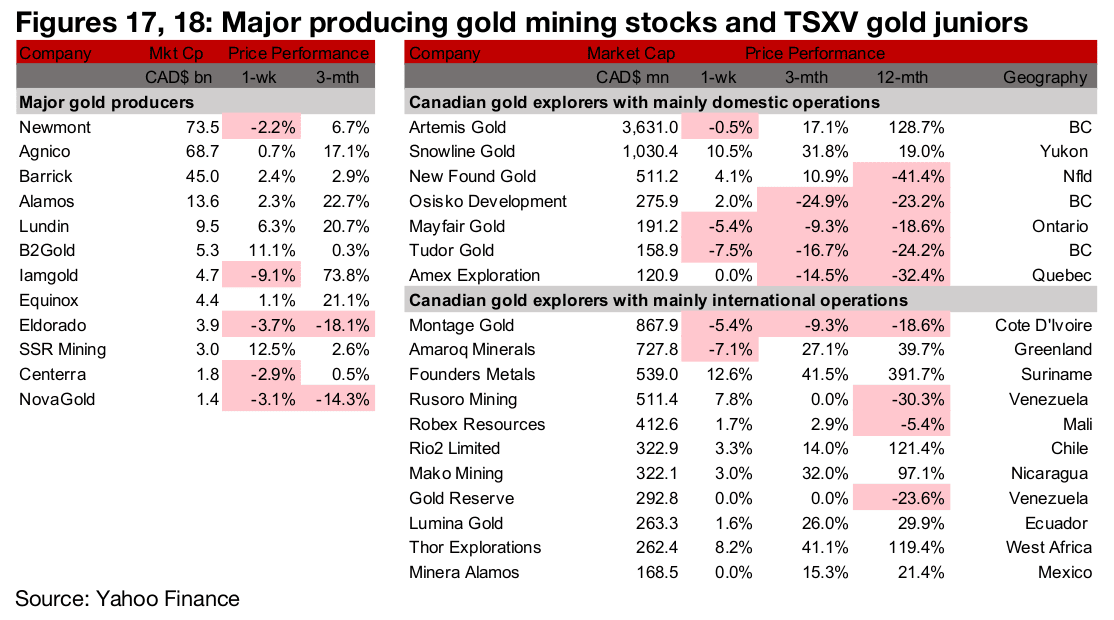
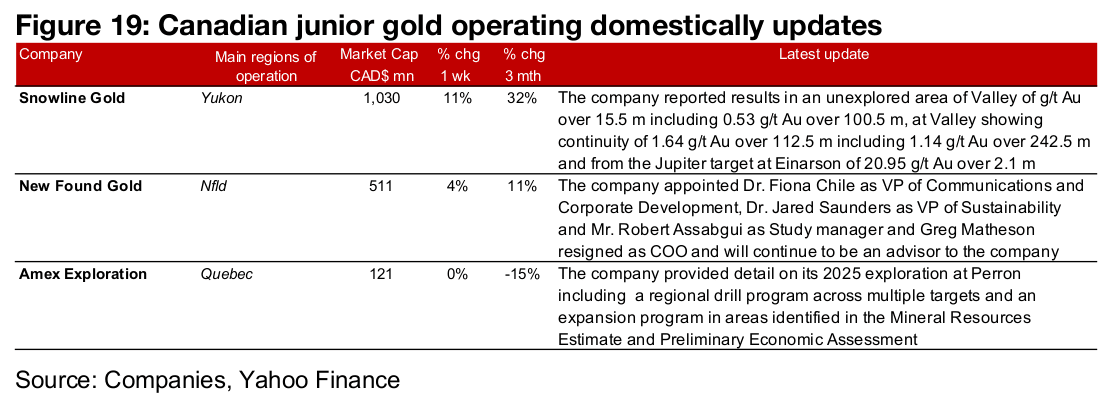
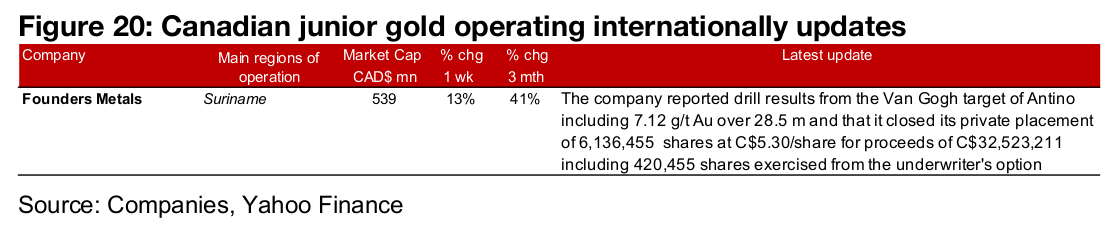
Major gold producers mixed and TSXV gold mostly gain
The major gold producers were mixed and there were gains for most of TSXV gold (Figures 17, 18). For the TSXV gold companies operating domestically, Snowline Gold reported drill results from Valley and Einarson, New Found Gold announced new management appointments and Amex Exploration provided detail on its 2025 exploration program at Perron (Figure 19). For the TSXV gold companies operating internationally, Founders Metals reported drill results from Antino (Figure 20).
Disclaimer: This report is for informational use only and should not be used an alternative to the financial and legal advice of a qualified professional in business planning and investment. We do not represent that forecasts in this report will lead to a specific outcome or result, and are not liable in the event of any business action taken in whole or in part as a result of the contents of this report.