June 19, 2023
TSXV Big Ten Gold
Author - Ben McGregor
Top Ten TSXV gold stocks mixed over past twelve months
The share price performance of the Top Ten TSXV gold stocks were mixed over the past twelve months, with the gold price not a huge driver, with only a 7.4% rise over the period and company specific issues becoming more crucial to gains or losses.


TSXV Big Ten Gold
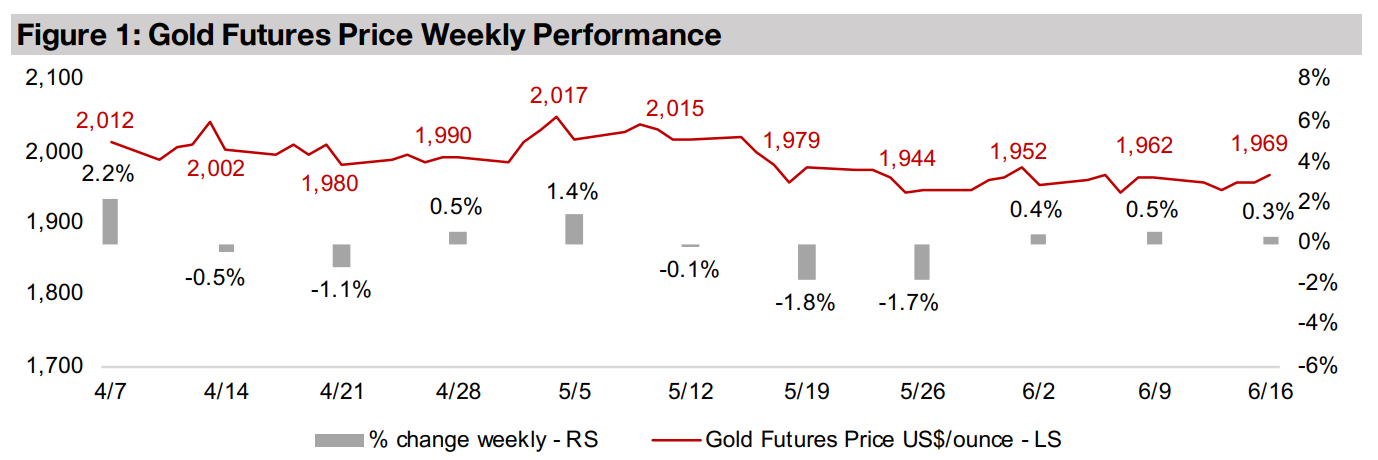
Gold was up 0.3% to US$1,969/oz, rising slightly for the third week as markets likely remain wary of the recent 'risk on' shift in markets and added protection. The gains in equities have certainly not been balanced, being concentrated in a few large AI and other tech names, and valuations for the S&P 500 remain elevated versus long-term averages. Stocks initially shrugged off hawkish monetary policy announcements from the US Fed and European Central Bank, and even rose substantially by mid-week. However, in the last trading session of the week there was a pullback as finally markets seemed to be considering that maybe the recent run was too much too fast, given growing evidence of cracks in the global economic edifice.
Fed pauses, ECB hikes, but both hawkish, focussing on core inflation
The big macro news this week were the pauses in rates hikes by the US Fed and a hike by the European Central Bank, with both inline with market targets, although the outlook in discussions after the moves by both was more hawkish than expected. The Fed Effective Funds rate has been at 5.08% through June, and averaged 4.75% so far this year, the highest since 5.02% in 2007, with the peak prior to that at 6.24% in 2000 (Figure 4). So this leaves US interest rates clearly towards the historically high end of the range of the last three decades.
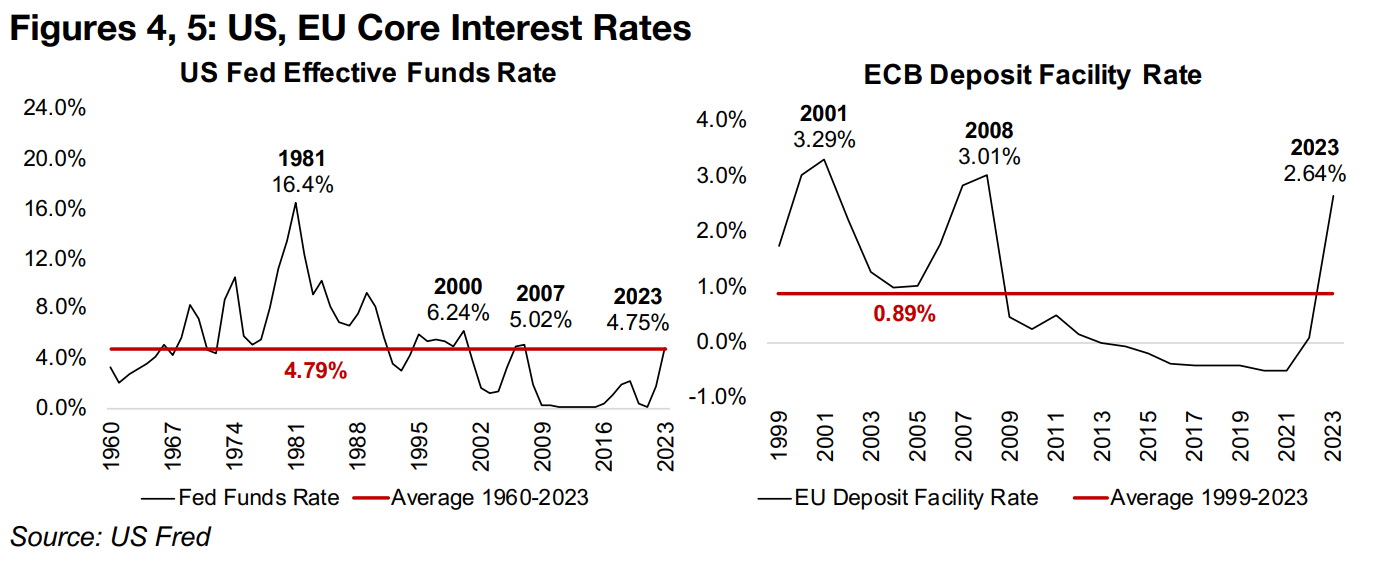
While the current level is actually only moderately above the average since 1960 of
4.79%, this figure had been substantially skewed up by high inflation of the 1970s
and early 1980s. In contrast, the average since 1993 has been just 2.47%, about half
the current level. The ECB hiked its Deposit Facility Rate 0.25% to 3.50%, and it has
averaged 2.64% this year, which, similar to the US, is nearing previous historic highs
around roughly the same periods, with a peak at 3.01% in 2008 and prior to that at
3.29% in 2001 (Figure 5).
It is concerning that last two periods when rates were getting this high in the US and
Europe were followed by quite extreme economic downturns in both cases, with the
dot.com crash and recession from 2000 to 2003 and the global financial crisis from
2008 to 2009. We believe that this further puts into question the justification of the
recent equity rally and whether this could be another period of irrational exuberance
before a significant pullback.
While the pause by the Fed and hike by ECB were not a surprise, there was an initial
plunge in US markets after the Fed announcement, before a quick recovery, with the
Fed's accompanying statement perceived as bearish. As shown by Fed Chairman's
Powell comments to the press, their outlook remains hawkish, with the Fed not seeing
the inflation fight as near over at all. It expects more rate hikes to come and none of
the eight Fed members indicated that rate cuts would be possible this year. The ECB
was similarly hawkish after its hikes, indicating that inflation was still far too elevated.
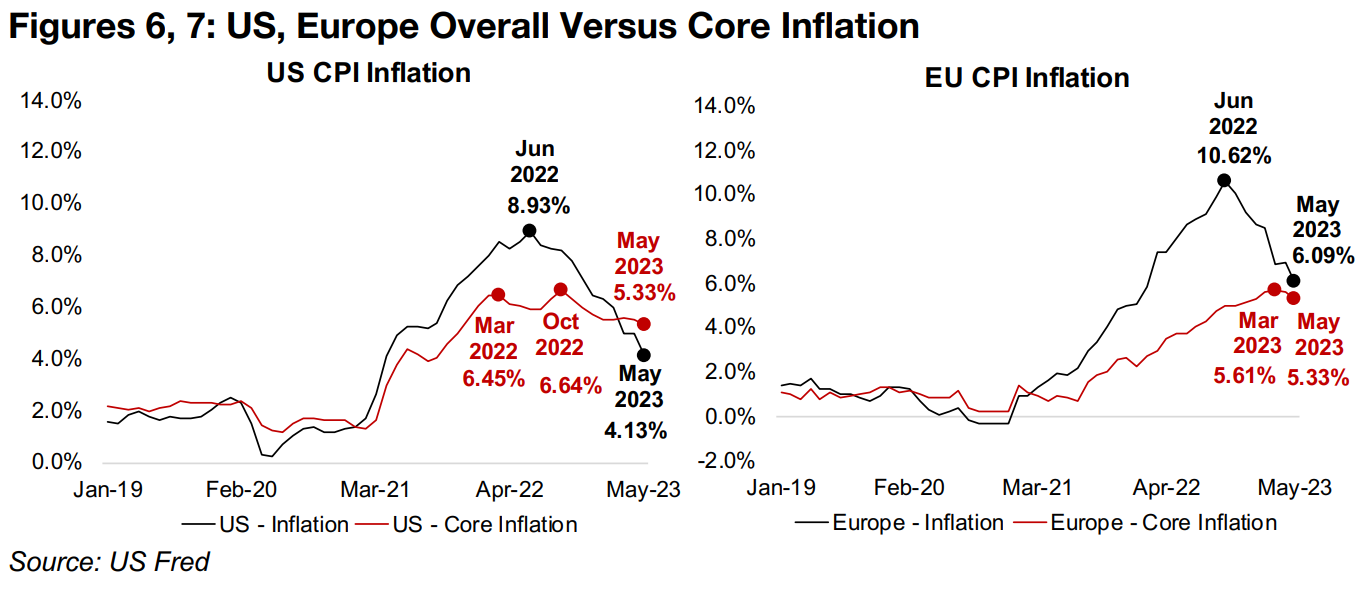
The main reason for the hawkishness appears to be the persistence in core inflation
for the two regions, which excludes volatile food and energy prices, which is the main
focus for the central banks. There has certainly been progress in curbing overall
inflation, which plunged from 8.93% in June 2022 to the 4.13% in May 2023 in the
US and from 10.62% to 6.09% in Europe over the same period (Figures 6, 7).
However, this has been mainly because of a major decline in energy prices.
Core inflation has remained remarkably persistent in the US, at well above 5.0% for
nearly the past year and a half, peaking in October 2022 at 6.64%, and declining just
over a percent since to 5.33% in May 2023. In Europe, core inflation has risen
consistently over the past two years, peaking only recently, at 5.61% in March 2023,
and declined only moderately since, to 5.33% in May 2023. With both regions
targeting core inflation at roughly 2.0%, there does appears to need to be continued
vigilance by central banks to truly curb underlying inflation.
We might expect that continued high rates, with more hikes likely to come, could put
some pressure on gold, with the implication of higher real rates, making other
investments like bonds more attractive than yieldless gold, or driving up the US$, and
inversely, pushing down gold’s price. While these fundamentals are not to be ignored,
we believe that the market is likely focusing more on the potential economic fallout
from extraordinarily high rates in the context of the past thirty years, especially in light
of the crises that occurred the last two times rates were this high. This has led to an
addition to gold positions this year overall in order to hedge against these outcomes.
Big Ten Gold Stocks see mixed performance over past twelve months
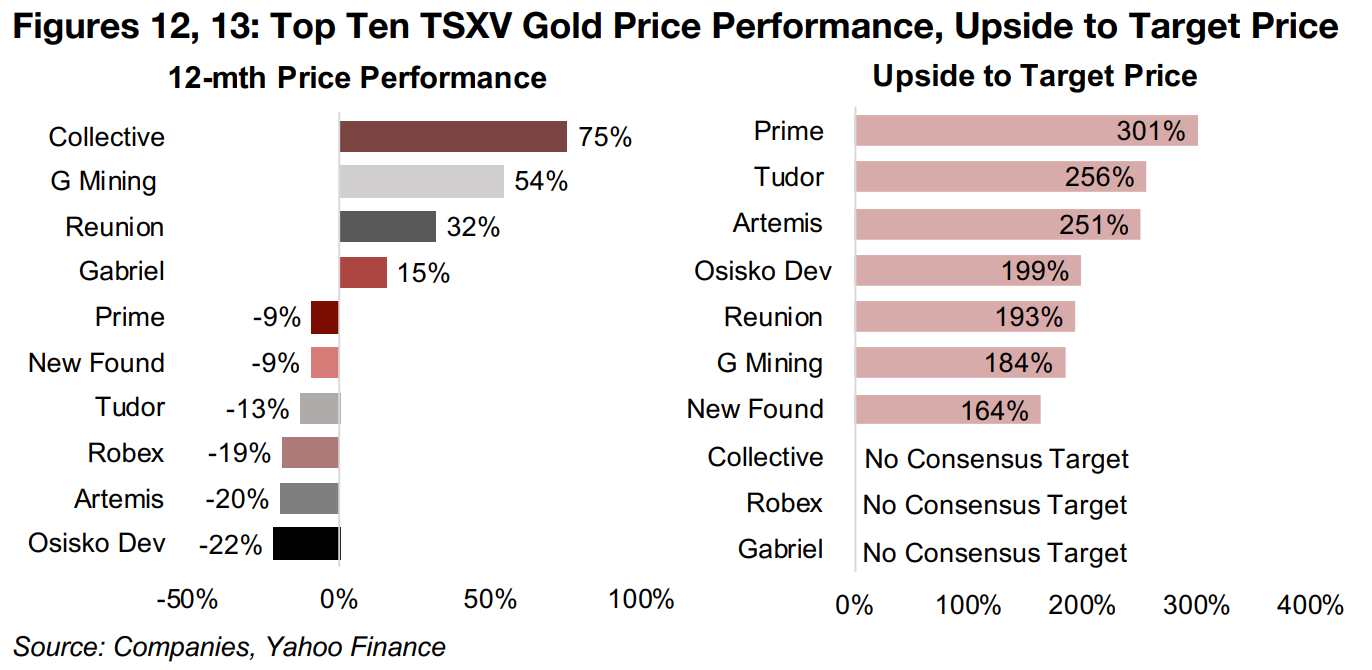
This week we look at the Top Ten market cap TSXV gold stocks, which have had a mixed performance over the past twelve months, with the moderate 7.4% gain in the gold price not enough to drive an upswing across the board. Still, four of the top ten have seen gains, all in the double digits, and while six have declined, even the worst performer is down only just over -20%. The Top Ten has shifted over the past year towards a larger proportion of producers and advanced developers and fewer earlier stage explorers as the market overall has looked to reduce risk over the past year. The market remains bullish on the group, with a range of 160% to 300% upside to the target prices of the seven of the ten which have consensus targets.
New Found Gold continues to expand pre-Resource Estimate Queensway
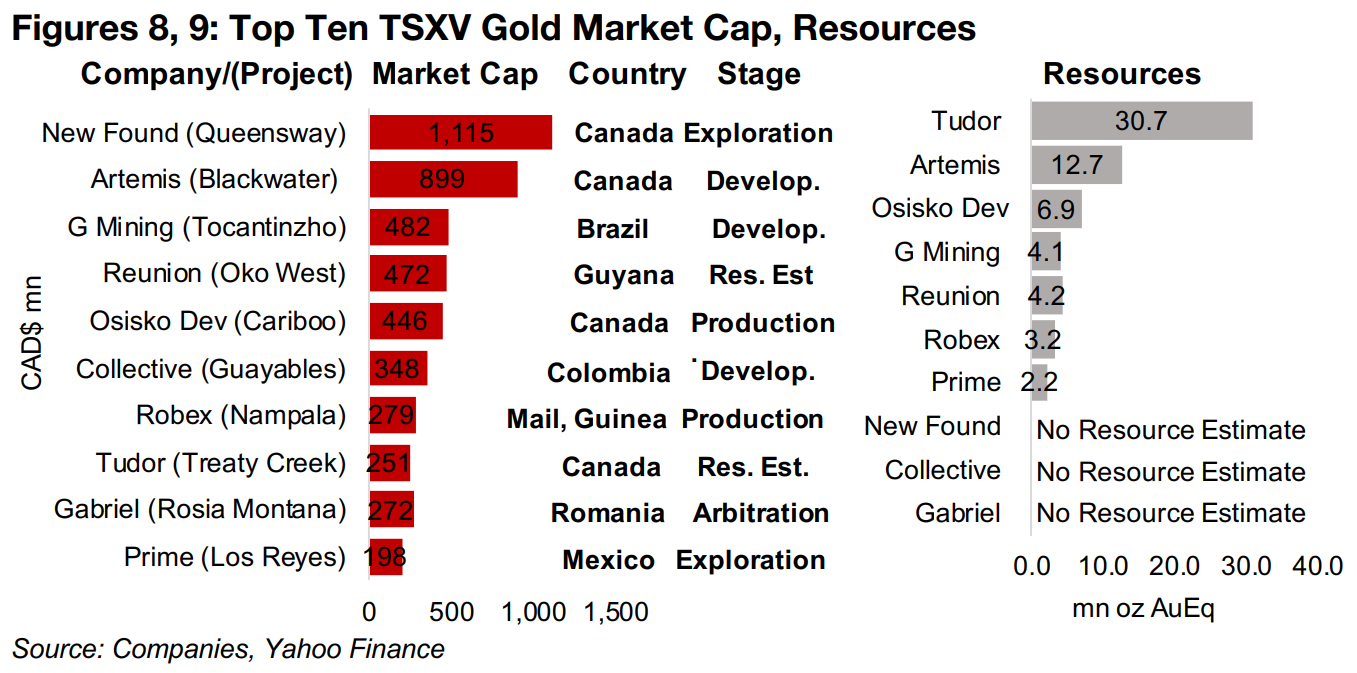
The largest of the group, New Found Gold, has an $1,115mn market cap (Figure 8),
and continues to report strong drill results from its Queensway Project in
Newfoundland and discover new high grade zones and expand previously discovered
ones. The grade implied at Queensway from the extensive series of drilling results
released over the past three years is extremely high, with an average of its strongest
headline results at 58.5 g/t Au.
While the actual grade will obviously be far below this, it does demonstrate just how
strong the results have been in contrast to other TSXV explorers. There has been no
initial mineral resource estimate released yet for Queensway, with management likely
not wanting to 'lock-in' a benchmark valuation yet, as they see room for growth
(Figure 9). This is similar to Great Bear Resources, which had not released a Resource
Estimate before it was acquired by Kinross, and New Found Gold seems a similarly
high probability acquisition target. The price declined -9% over the past year, towards
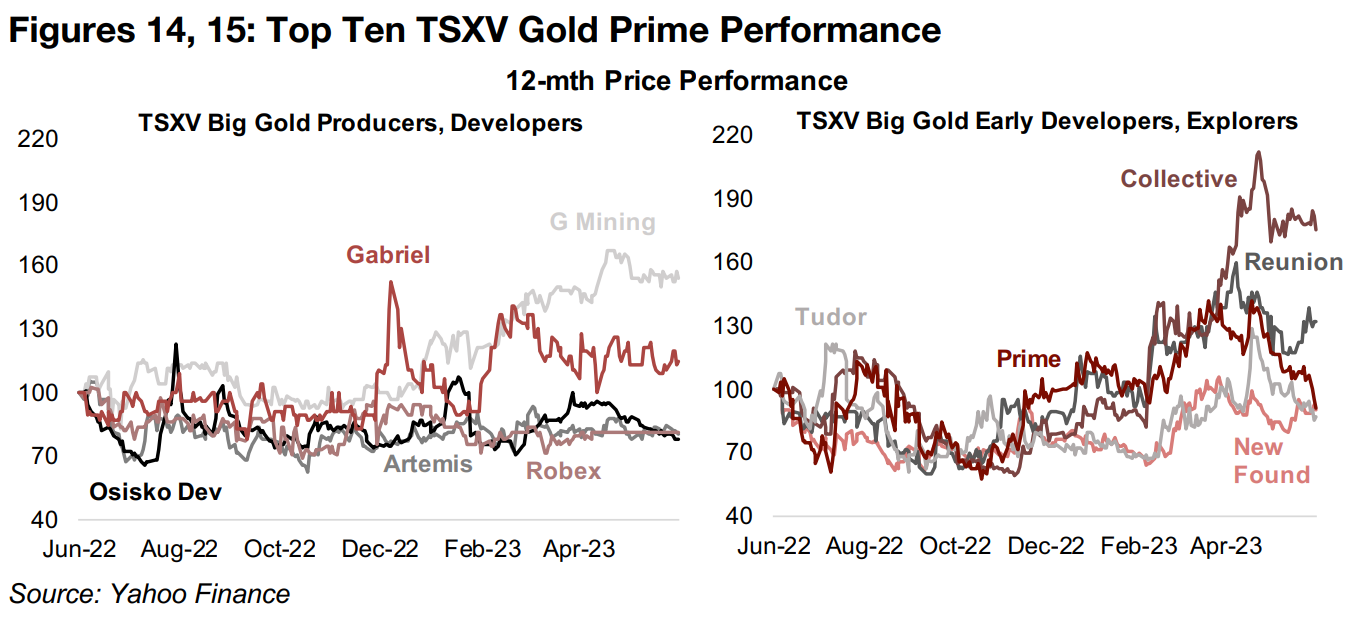
the bottom of other earlier stage developers and explorers (Figures 12, 15). While it
cannot be valued on Market Cap/Resource given its lack of a Resource Estimate
(Figure 11), the market sees 164% upside to its consensus target (Figure 13).
Construction underway at Artemis' Blackwater with H2/24 production target
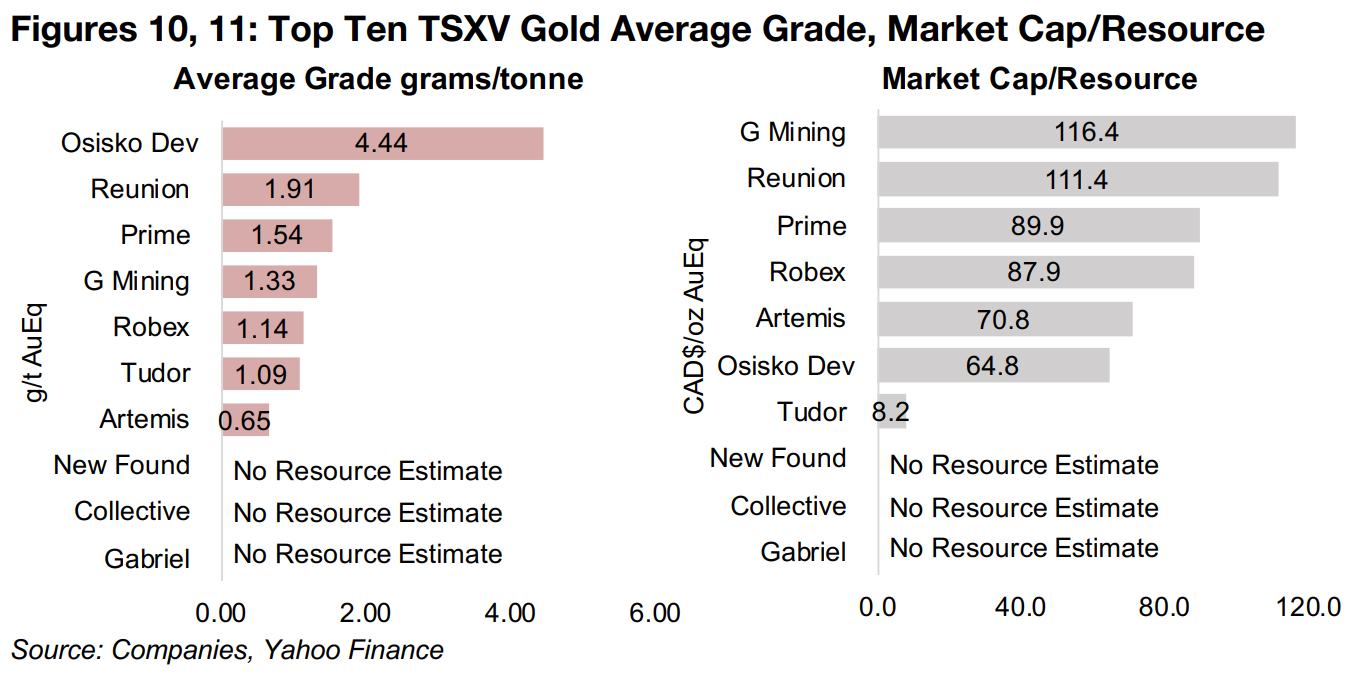
Artemis Gold is at the other end of the spectrum from early stage New Found Gold, with its large Blackwater project already in construction, with output targeted by H2/24 and four phases planned over a 22-year mine life. The company has the second highest resources of the Top Ten, at 12.7mn oz Au, but the lowest grade of the group at 0.65 g/t Au (Figure 10), which has left its Market Cap/Resource valuation a relatively low CAD$70.8/oz. While the price is down -20% over the past year (Figure 14), analysts still see a strong 251% upside to its target price and our analysis indicates that the current market cap is equivalent only to the value of the first two Phases of the project, or first eleven years.
G Mining's Tocantinzinho under construction with production target of Q3/24
G Mining is developing the Tocantinzinho project in Brazil, with Resources of 4.1 mn oz Au, and the project under construction and fully funded, with production targeted by Q3/24. While the grade is only the fourth highest of the Top Ten, at 1.33 g/t Au, the company has the highest Market Cap/Resource of the group, at CAD$116.4/oz, and the second highest share price increase, at 54%. Even with these large share price gains, the market expects 184% upside to its target price, which although the second lowest of the Top Ten, is still high in absolute terms.
Reunion Gold releases Initial Resource Estimate for Oko West
Reunion Gold has released the most recent Resource Estimate of the Top Ten, just this week, for its Oko West project in Guyana, outlining a total 4.2 mn oz Au in Resources, similar in size to G Mining at 4.1 mn oz, and has the second highest grade of the group, at 1.91 g/t Au. Continued strong drill results have driven up the stock 32% over the past twelve months, and the company is valued the second highest of the Top Ten on Market Cap/Resource given its high grade, at CAD$114.4/oz, and the market sees 193% upside to its target price.
Osisko Development producing at Trixie with Cariboo development ongoing
Osisko Development is developing three projects with a wide range of sizes and
grades and at different development stages. It is currently producing from its Trixie
Test Mine in Utah, part of the Tintic project which was only acquired last year, with a
relatively small Resource of 456 oz Au, but at an extremely high 23.2 g/t AuEq grade.
However, the major value driver for the company will be its Cariboo project in British
Columbia, with 5,313k oz AuEq in Resources, at a reasonably high 3.54 g/t AuEq
tonne, for which a Feasibility Study was announced in January 2023.
The company's third main project is San Antonio in Mexico, with an estimated 915k
oz Au in Resources, although there is still no official Resource Estimate or FS for it,
and it has a much lower grade of 1.1 g/t Au. This brings the company’s total
Resources to 6,980k oz Au at an average grade of 4.44 g/t Au, by far the highest of
the Top Ten. However, the market is only valuing the company at a CAD$64.8/oz, the
second lowest of the group, given a relatively high operating cost estimate for
Cariboo. The stock is down -22% over the past year, although the market still sees a
considerable 199% upside to its target price, given drilling ongoing to expand the
Trixie Resource and potential production from Cariboo by 2024.
Collective Mining sees largest gain of the TSXV Top Ten Gold
Collective Mining has seen the largest share price increase of the Top Ten, surging 75%, driven by strong drill results from its early-stage exploration Guayables project in Colombia, with an average grade from its headline reported results of 2.56 g/t Au. This type of significant gain is typical of juniors in the TSXV where an extended string of exceptional drill results have sent them up from mid-tier market caps based on a few early strong results into the larger cap space, indicating that the market sees significant potential for a viable project. The company’s still very early stage means it has no Resource Estimate or target consensus price.
Robex targets rise in Nampala output in 2023 and Kineiro FS announced
Robex Resources is the only 'organic' producer in the Top Ten with output over
several years, with Osisko Development’s production coming only from a recent
acquisition. The company’s Nampala mine in Mali produced 46.7mn oz Au in 2022,
growing only 0.2% as a heavy rainy season curbed production especially in Q4/22.
However, revenue was still up 8.0% yoy in 2022 on rising gold and operating income
up 10.6% yoy on improving margins. The company forecasts a 7.2% increase in
output for Nampala to 50k oz Au in 2023 and the mine has 488k oz Au of total reserves.
The company just this week also announced a Feasibility Study for its second major
project, Kiniero, which is much larger than Nampala, with 2,680k oz Au in Resources.
The FS outlines an increase in Reserves by 21% to 968k oz Au from the PFS, a 46%
increase in mine life to 9.5 years and -5.3% in AISC to US$980/oz Au. The total
Resources of two projects is 3.4 oz Au at a weighted average grade of 1.14 g/t Au,
towards the lower end of the Top Ten. The company is up 32% over the past year
month, trades around the middle of the group on a Market Cap/Resource of
CAD$87.9/oz and has no consensus target price.
Tudor developing potentially huge resource, but at low grade
Tudor Gold is developing a potentially huge resource at the Goldstorm Deposit of its Treaty Creek gold, silver and copper project, with an updated estimate in March 2023 increasing the Resource 20% to 30.7mn oz AuEq, by far the highest of the Top Ten, and over double the size of Artemis. However, the project’s grade is low, at just 1.09 g/t Au, the second lowest of the Top Ten. This has led to a Market Cap/Resource of just CAD$8.2/oz, by far the lowest of the Top Ten, with the second lowest Osisko Development nearly eight times higher, at CAD$64.8/oz. Even with the increased Resource estimate, the stock is down -13% over the past 12 months, although it still has a large 256% upside to its target price, the second highest of Top Ten.
Gabriel awaits imminent arbitration decision on Rosia Montana
Gabriel Resources is a special case versus the rest of the TSXV Top Ten Gold, as its project, Rosia Montana in Romania is effectively undevelopable. The project is in a historic gold producing area deemed a World Heritage Site by UNESCO in 2021, thus preventing the company from making operational progress. As this led to a major loss on investment for Gabriel, a claim against the Romanian State was made over the issue, with an arbitration run by the World Bank’s International Centre for Settlement of Investment Disputes (ICSID) now nearing a conclusion. The decision is expected to include an ‘arbitral award’ which the market seems to expect will come in near CAD$300mn, given the current market cap of CAD$272mn. However, the inability for the company to move forward as it awaits the decision has driven a -22% decline in the share price over the past twelve months, the weakest performance of the group.
Prime Mining doubles historical Resource Estimate
Prime Mining is at the exploration stage at the Los Reyes project in Mexico, with a 60k metre drill program ongoing with continued strong results. It is another of the Top Ten that has recently released a Mineral Resource Estimate, in May 2023, with 2.2mn oz AuEq for Los Reyes, nearly tripling a historical estimate of 0.8mn oz Au. While this Resource is the smallest of the Top Ten, it has the third highest average grade, at 1.54 g/t Au, leading to a reasonably high Market Cap/Resource of CAD$89.9/oz, also the third highest of the group. The stock has declined a moderate -9.0% over the past year, with the Resource Estimate apparently not surprising to the upside, but there is still 301% upside to its target price, the highest of the Top Ten.
Producers mainly down and TSXV larger gold mixed
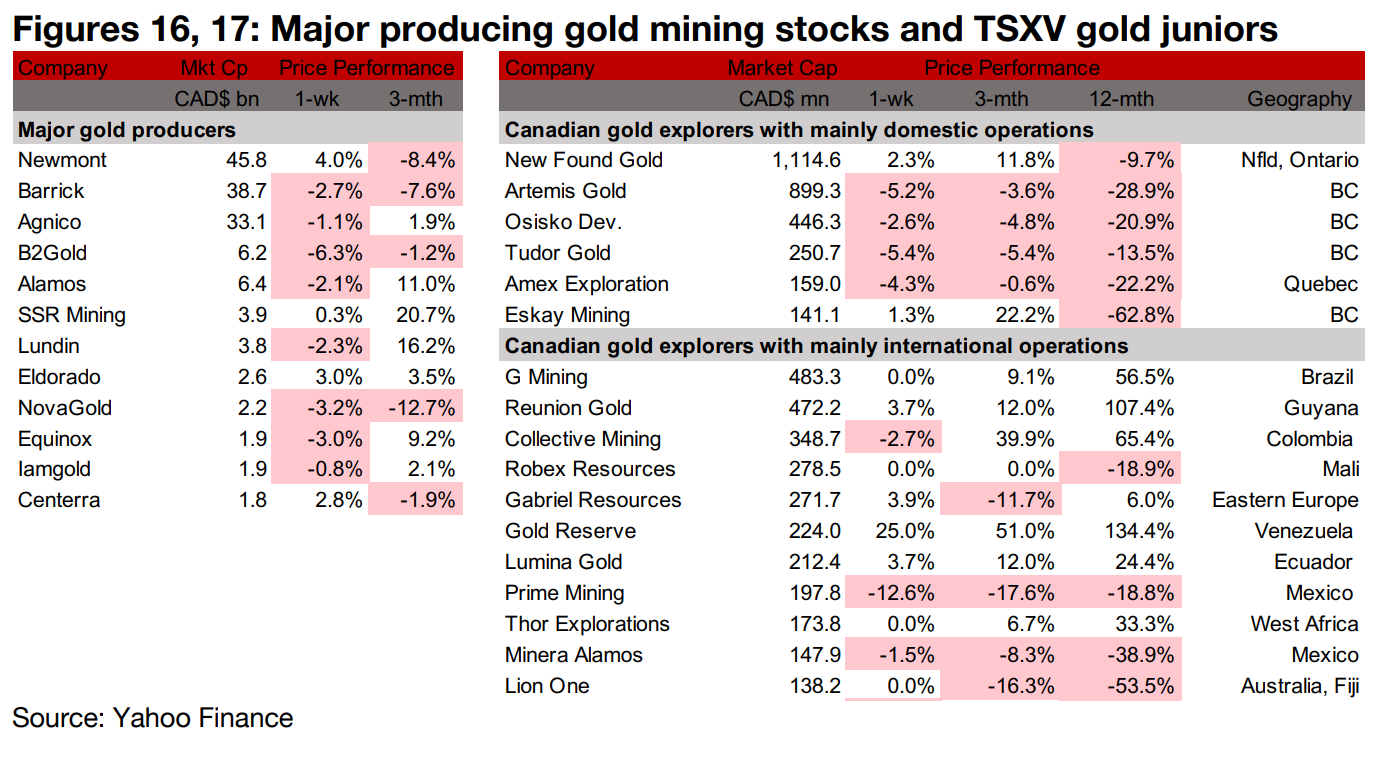
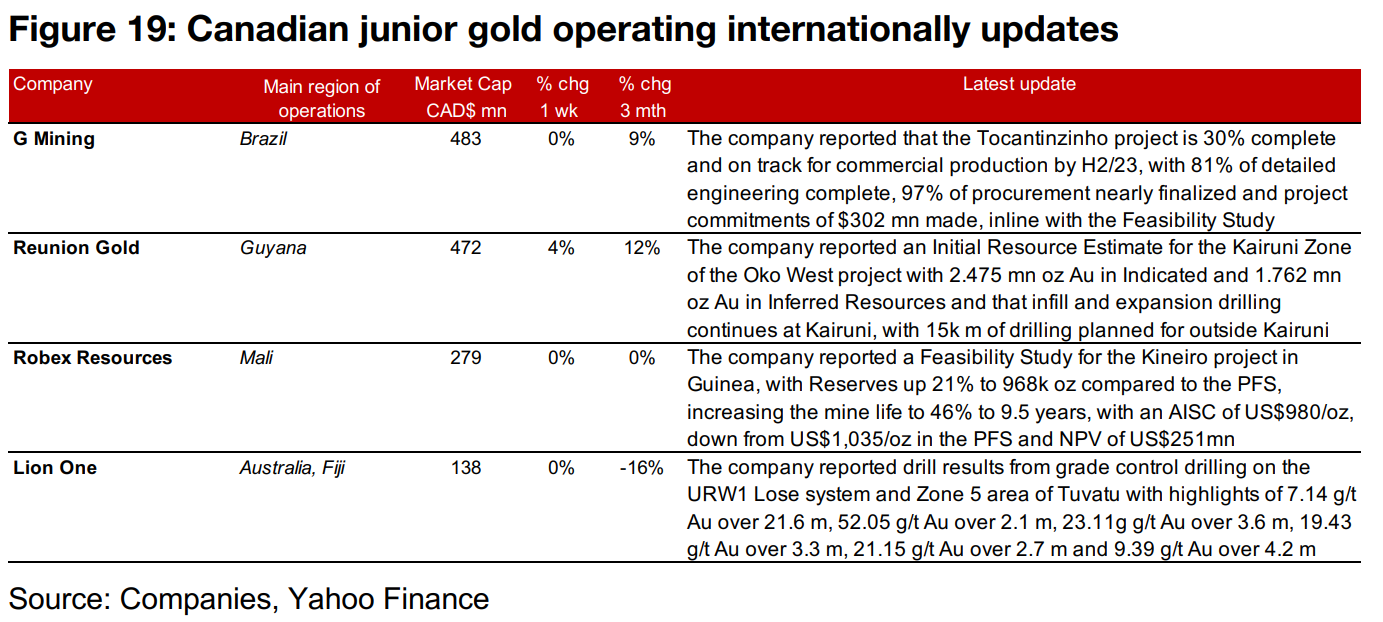
The gold producers mostly declined and large TSXV gold was mixed as the gold price continued to tick up (Figures 16, 17). For the TSXV gold companies operating domestically, New Found Gold reported drill results from Queensway and Artemis announced that a US$40mn higher Phase 1 investment would be funded by Wheaton (Figure 18). For the TSXV gold companies operating internationally, G Mining reported that Tocantinzinho construction is 30% complete, Reunion Gold announced an Initial Resource Estimate for the Kairuni Zone of Oko West, Robex Resources reported a Feasibility Study for Kiniero and Lion One Metals reported drilling results from Tuvatu (Figure 19).

Disclaimer: This report is for informational use only and should not be used an alternative to the financial and legal advice of a qualified professional in business planning and investment. We do not represent that forecasts in this report will lead to a specific outcome or result, and are not liable in the event of any business action taken in whole or in part as a result of the contents of this report.


