September 23, 2024
TSX Big Gold Valuations Remain Low
Author - Ben McGregor
Gold up as Fed comes through with big rate cut
Gold rose 1.7% to US$2,611/oz as the Fed finally joined the rest of the major global central banks in interest rate reductions this year with a 50 bps cut, although it talked down the potential for a further aggressive decline, leading to moderate market gains.


TSX Big Gold Valuations Remain Low
The gold price rose 1.7% to US$2,611/oz, continuing to breakout far above the
US$2,284/oz average year to date, driven by an aggressive 50 bps rate cut from the
US Federal Reserve. The Fed had been the last holdout of the major global central
banks in reducing rates, with cuts from the European Central Bank, Bank of England
and Swiss Central Bank all having started earlier this year. This boosted the gold price
short-term by driving down the US$, which tends to move inversely with the metal,
and also implies a rising US money supply, which is major long-term driver for gold.
While equity markets surged initially on the day of the announcement, they pulled
back on follow up comments from the Fed that this was not necessarily the start of
an aggressive rate cutting cycle, as it highlighted the strength of the US economy.
This caused confusion in markets as such a large 50 bps cut instead of just 25 bps
seemed to indicate the central bank had some concerns about the US growth outlook.
However, by week’s end markets seemed to view the move as bullish overall with the
S&P 500 rising 1.6%, the Nasdaq up 2.1% and the Russell 2000 gaining 1.9%.
While there was clearly a move back towards risk assets on the rate cut, with the tech
sector rising 1.7%, the defensive utilities sector was still right behind it with a 1.4%
gain, and safe haven gold producers also increased with the GDX ETF up 1.0%. This
continues a trend in 2024 of the markets shifting more towards defensive sectors
than last year. This tendency has made gold stocks one of the strongest performing
sectors this year, with the GDX and GDXJ ETF of gold juniors up 32.6% and 33.6%,
respectively (Figure 4). US utilities have also outperformed, up 25.2%, almost exactly
inline with US Tech’s 25.0% rise.
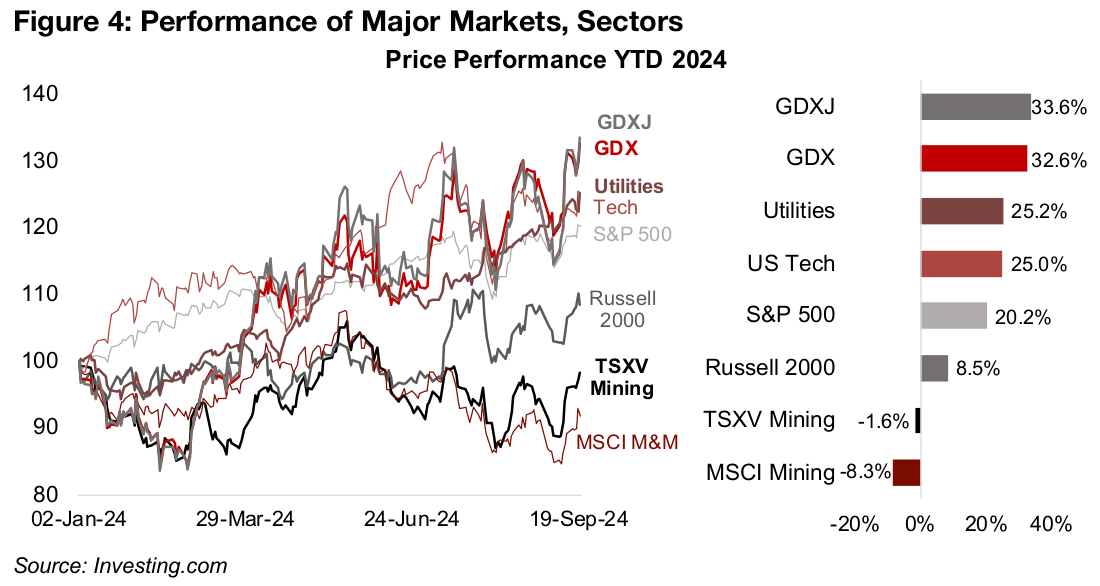
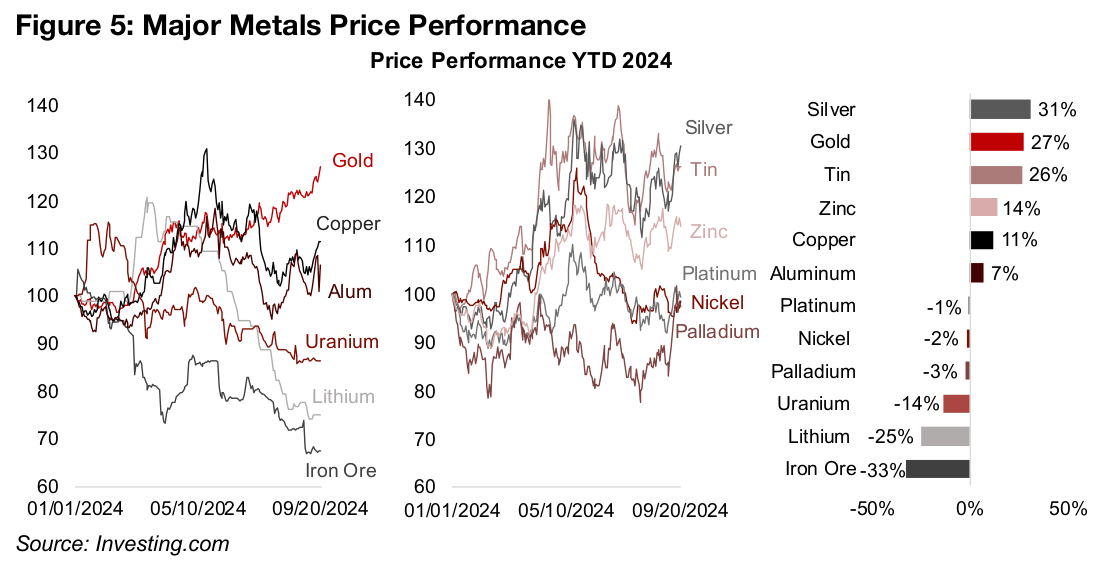
Comparing this to a 53% rise in US Tech in 2023 versus an -8.4% decline in US Utilities shows a market clearly more interested in balancing riskier positions with defensive ones in 2024. We expect that rising risk aversion will persist into 2025 and defensive assets like gold could continue to perform well. This safe haven preference can be seen in overall metals markets, with monetary factor-driven gold and silver up 27% and 31% this year, significantly outperforming the 11% and 7% gains and -33% drop in industrial-factor driven copper, aluminum and iron ore (Figure 5).
Gold and gold stocks could continue up in 2025
The main bear case for gold would be a return to the situation of the mid-2010s, with
zero interest rates, almost no inflation, low political risk and moderately high equity
valuations. However, we see this as unlikely given interest rates near thirty-year highs,
excessive equity valuations, inflation elevated and in danger of being reignited by rate
cuts, and obviously higher political risk. With so many concurrent risks at such a
severe level, we expect an average gold price of US$2,500/oz for 2025, which several
investment banks are already estimating, is a possibility, and may prove conservative.
We view the outlook for gold stocks also as strong, given a high gold price which
does not appear to have been fully priced in by markets. The risk for gold stocks
would be an abrupt pullback in equities overall, which could see markets sell off safer
assets with gains, like gold stocks, to cover leveraged losses in risker assets. Still
very high equity valuations for the broader major US indices could be setting the
stage for this, especially if earnings in high multiple sectors were hit by a recession.
Rather than being an upbeat indicator, recent global rate cuts could viewed as a
warning signal of economic recession concerns, and may also have the effect of
further exacerbating bubbles in sectors that already have excessive multiples.
Big TSX gold equities valuations not indicating exuberance
While the US markets overall are still facing very high multiples, this is largely because
of a few sectors, tech in particular, and valuations across many other sectors,
including mining, do not indicate widespread overexuberance. We might not expect
major multiple expansion this year for the copper or iron stocks given the muted gain,
and major decline, in their respective metals’ prices. However, the only slight rise in
multiples for the large producing gold stocks is more surprising, given the huge rise
in the metal price.
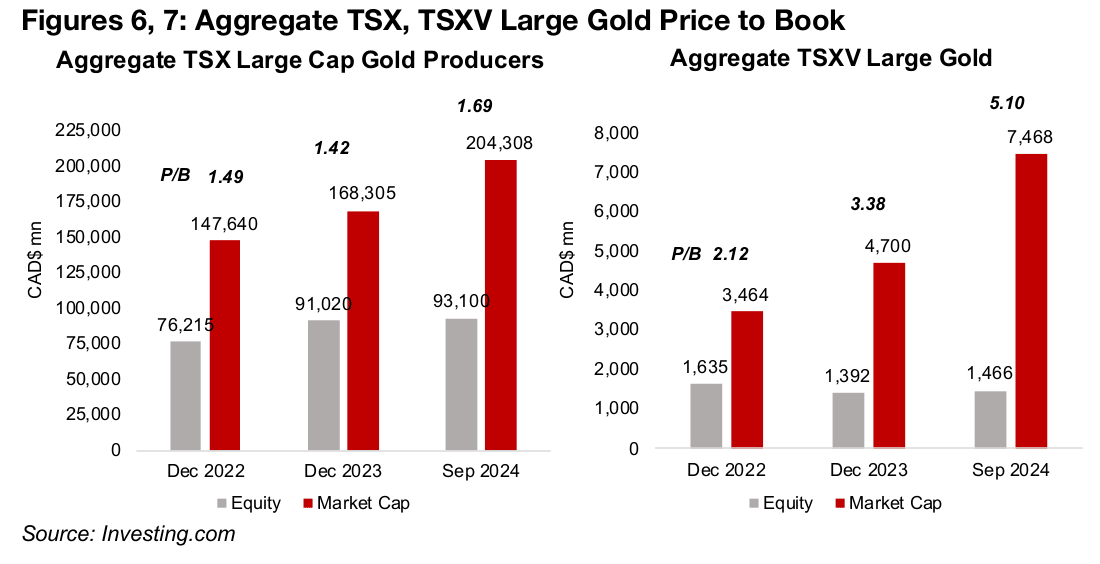
The aggregate price to book (P/B) of the large cap TSX gold stocks, weighted by
market cap, comprising Barrick, Newmont, Agnico Eagle, Alamos, Lundin Gold,
B2Gold, Eldorado, IamGold, Equinox and SSR was 1.49x in 2022, declined in 2023
to 1.42x and rose to just 1.69x in 2024 (Figure 6). These ratios appear quite low, as a
P/B of 1.0x or below, for a company that is not in clear financial distress, is considered
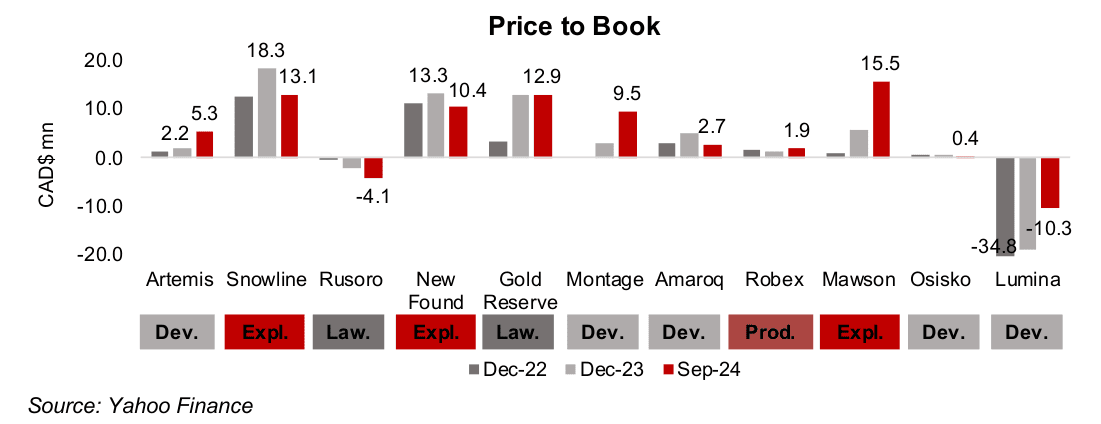
inexpensive. The P/B of the large TSXV gold stocks, including Artemis Gold, Snowline,
Rusoro, New Found Gold, Gold Reserve, Montage, Amaroq, Robex, Mawson, Osisko
Development and Lumina, has risen much more, from 2.12x in 2022 to 3.38 in 2023
and 5.10x in 2024, but mainly because of Artemis’ high weighting (Figure 7).
We use a Price to Book multiple as the data can be easily sourced directly from
financial statements and market prices. While NAV is more of the gold standard for
metal stock valuations, it incorporates many assumptions which can vary widely
across source and cannot be easily aggregated from publicly available date over time.
P/B is also one of the only measures that can be used for junior miners, as they often
have no earnings or cash flow, and therefore price to earnings or price cash flow
multiples cannot be calculated.
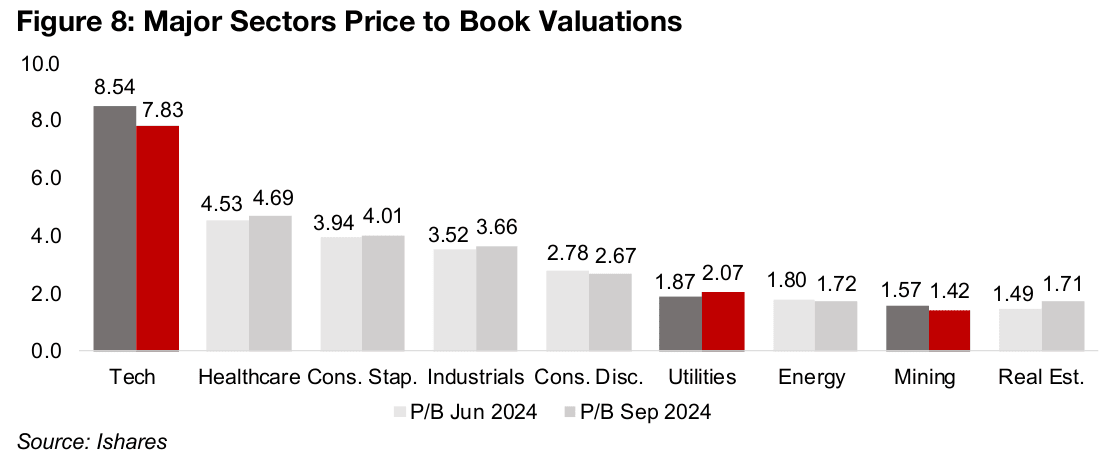
The Big TSX gold valuations are moderately above global mining, with a low P/B of 1.42x, declining from 1.57x in June 2024, and the spread with tech remains extreme even after a decline in its P/B to 7.83x from 8.54x in June 2024 (Figure 8). While higher growth expectations for tech versus mining does explain some of this gap, it still seems wide, with former appearing priced for perfection and latter for disaster.
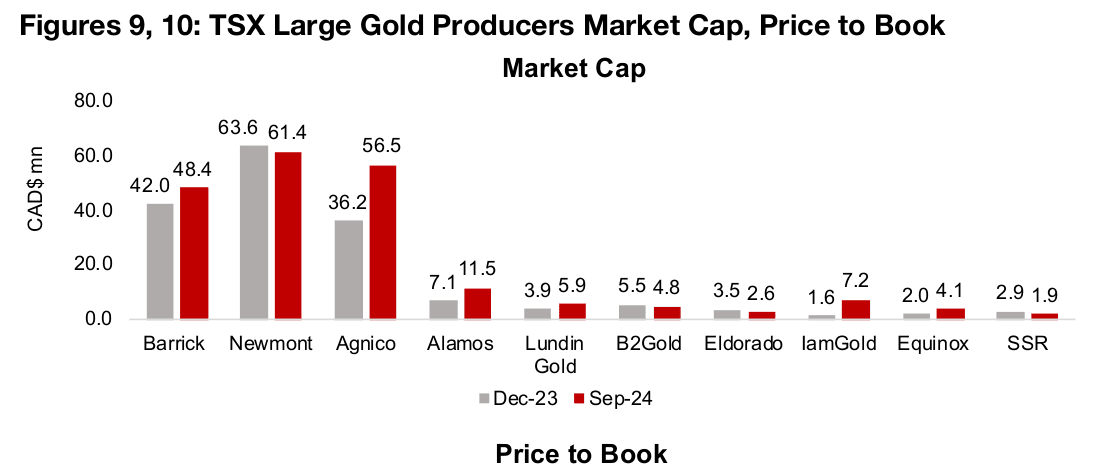
For TSX large cap gold, Barrick, Newmont and Agnico Eagle are by far the largest of
the group, accounting for almost the entire weighting, at 81.2% of the market cap
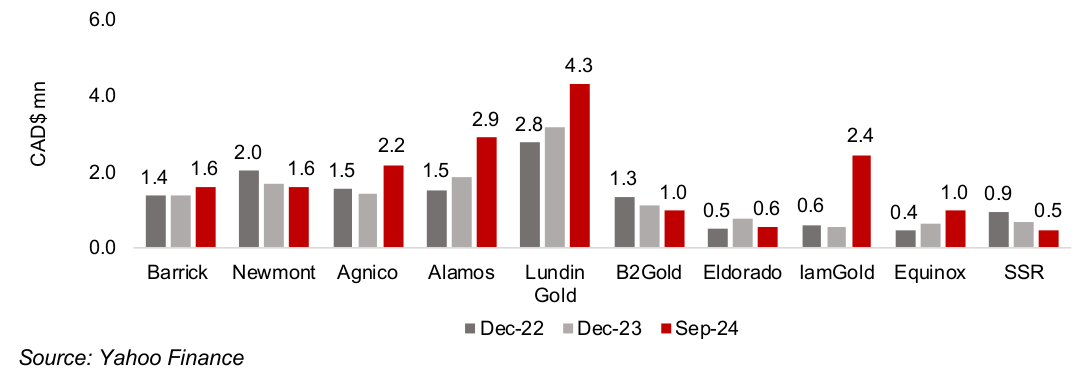
and 78.4% of the equity as of September 2024 (Figure 9). Barrick has seen a rise in
its market cap and Newmont a decline this year, and the P/Bs of the two have
converged to 1.6x, with the former trending up over the past two years and the latter
trending down (Figure 10). This level of P/B for these two long-term industry giants
appears moderate, especially given the rising gold price.
Agnico Eagle’s market cap has seen a larger 56.2% gain over the past year, as it
continues to integrate the huge acquisition of Kirkland Lake in 2022. While its P/B of
2.2x is not extremely cheap, is not excessive either. The only Big TSX gold companies
where the P/B is starting to look high are Alamos, at 2.9x, and Lundin at 4.3x, while
Iamgold is moderately elevated at 2.4x. This has been offset for the aggregate by the
very low P/Bs for B2Gold and Equinox at just 1.0x, Eldorado at 0.6x and SSR at 0.5x.
Large TSXV gold multiple driven up by high Artemis weighting
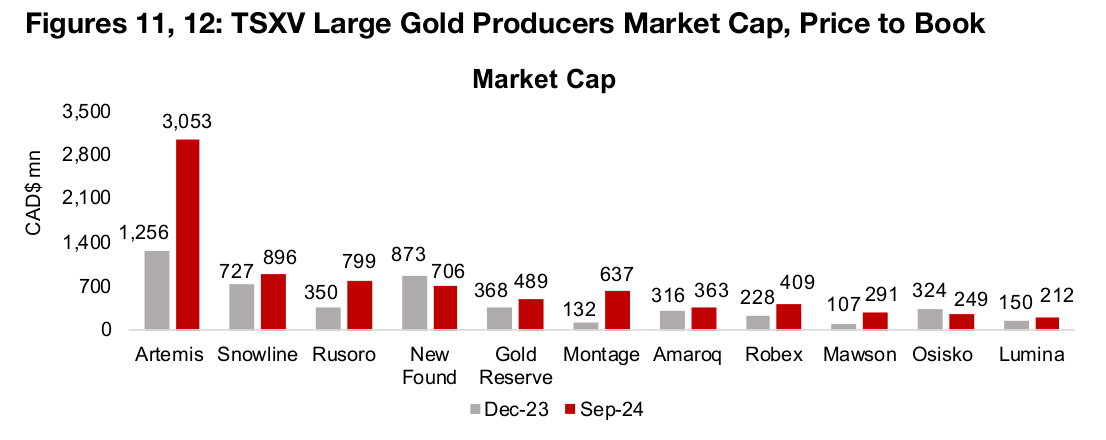
For the large TSXV gold stocks, the biggest mover by far in terms of market cap has
been Artemis Gold, with it nearly tripling to CAD$3.05bn from CAD$1.26bn at the
start of 2024, as its large 12.7mn oz Au, moderate 1.14 g/t Au grade, Blackwater
project is on the verge of production (Figure 11). While this has driven its P/B up to
5.3x from 2.1x at the start of 2024, the multiple could decline in 2025, as it has its
first full year of revenue and earnings, potentially increasing its book value (Figure 12).
Another two large market cap TSXV gold stocks are Snowline and New Found Gold,
both pre-resource estimate explorers with consistent very high grade drill results at
the Rogue project in the Yukon and Queensway project in Newfoundland. Their
extremely high P/B ratios are typical of early-stage explorers which can have low
equity values if they do not capitalize drilling expenses as assets, but high market
caps because of strong drill results. However, both of their P/Bs have declined this
year, with Snowline down to 13.1x from 18.1x at the start of 2024 and New Found
Gold down to 10.4x from 13.3x, as markets have become more cautious on earlier
stage explorers, even those with outstanding results.
The two other TSXV large cap gold stocks, Rusoro Mining and Gold Reserve and are
both ‘lawsuit’ stocks. They do not have significant operations and are awaiting
potential payouts from lawsuits regarding previous projects. The equity of both of
these companies is very low, with Rusoro’s falling below zero and sending its P/B
negative, and Gold Reserve’s very low and driving an artificially high P/B. Overall the
aggregate of the lawsuit stocks could be considered a wash, as the negative Rusoro
multiple and high Gold Reserve multiple offset each other.
The market caps of most of the rest of the large TSXV gold stocks are up this year,
with developer Montage, producer Robex and explorer Mawson seeing the largest
gains. This has driven up the P/B of Montage and Mawson up substantially to 9.5x
and 15.5x but Robex has seen only a moderate lift in its multiple to 1.9x. Market cap
gains for Amaroq and Lumina have been more moderate, with the P/B of the former
actually declining to 2.7x, and of the latter becoming less negative at -10.3x. Osisko
Development’s market cap has declined this year and it has by far the lowest P/B of
the group at just 0.4x.
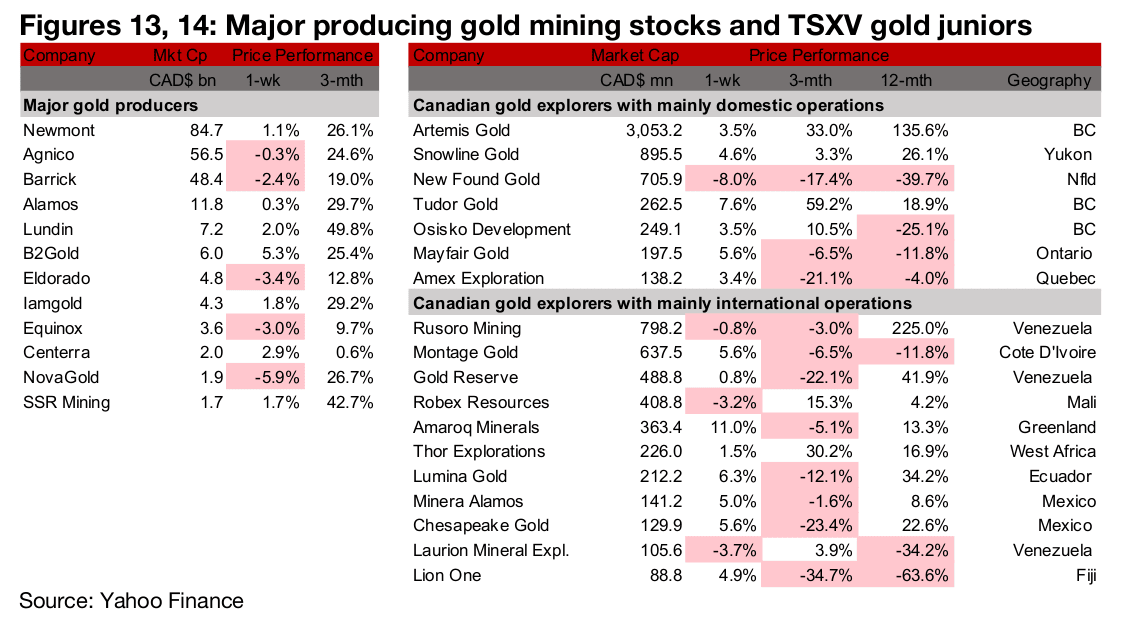
Major producers mixed and most TSXV gold rise
The major gold producers were mixed while most of large TSXV gold rose (Figures 13, 14). For the TSXV gold companies operating domestically, Tudor Gold reported an agreement with Fuse Advisors for services to advance Treaty Creek towards a PEA (Figure 15). For the TSXV gold companies operating internationally, Gold Reserve reported a delay on the bidding process for PDVH shares to January 2025, and Thor Explorations expanded into Cote D’Ivoire (Figure 16).


Disclaimer: This report is for informational use only and should not be used an alternative to the financial and legal advice of a qualified professional in business planning and investment. We do not represent that forecasts in this report will lead to a specific outcome or result, and are not liable in the event of any business action taken in whole or in part as a result of the contents of this report.


