February 06, 2023
Dovish (!?) Powell?
Author - Ben McGregor
Rollercoaster week on 'dovish' Powell and US jobs blowout
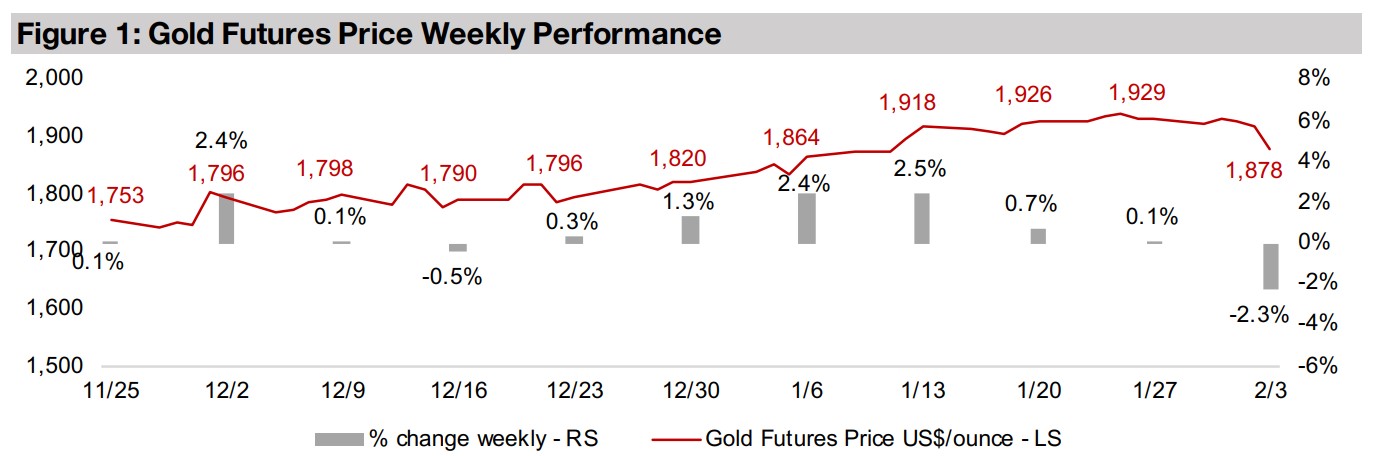
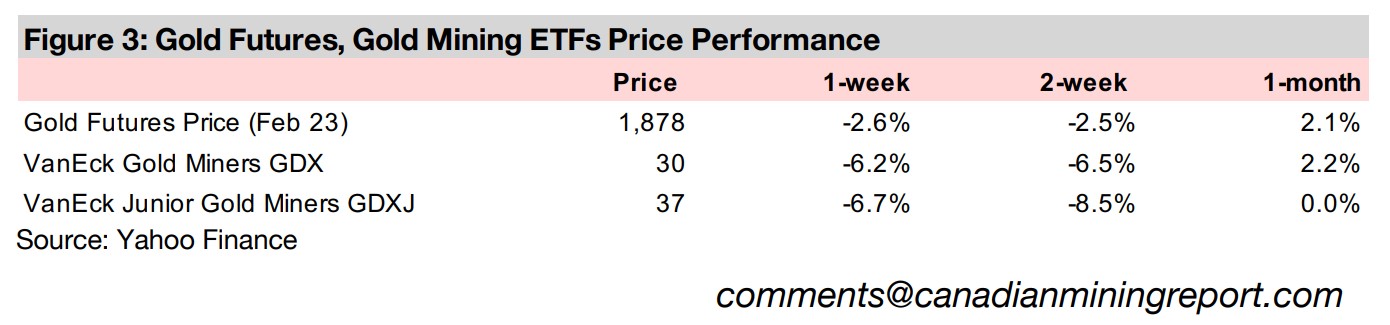
Gold plunged -2.6% this week to US$1,878/oz, as gold and the equity markets were first supported by a slight hint of dovishness in the US Fed Chairman's post-rate hike statements, but then hammered by a much stronger than expected US jobs report.
'Big Gold' Stock multiples and TSXV Gold market cap to grade
This week we look at the shifts in multiples of the largest global gold stocks after the recent run in the gold price, with price to earnings rising but cash multiples actually down, and TSXV large cap gold market cap/resource valuations versus grade.
Producing and juniors have major pullback on gold reversal
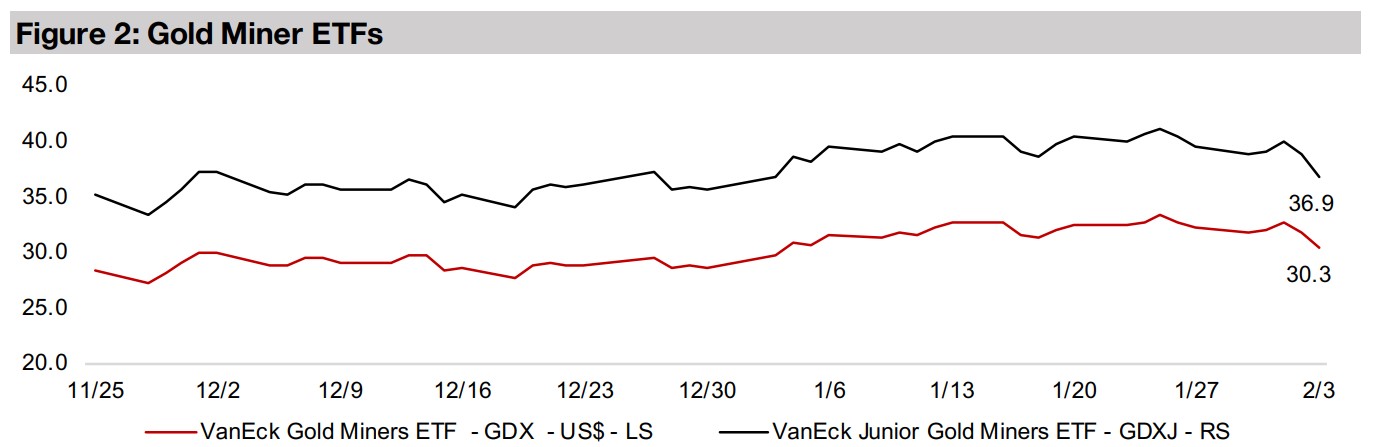
The producing and junior gold miners saw hard reversals on the drop in gold and end-week equity market pull back, with the GDX and GDXJ dumping -6.2% and -6.7% respectively and the larger cap TSXV gold juniors were mostly down.


Dovish (!?) Powell?
Gold dumped -2.6% to US$1,878/oz this week, ending a strong five week run, and dropping below US$1,900/oz for the first time in three weeks. This was driven by a rollercoaster week of economic news, with ever-so-slightly-dovish comments by US Fed Chairman Powell after a 25-basis point rate hike seeing gold edge up and the S&P up as high as 3.6%. However, a scorching US jobs report at week's end trounced market expectations to the upside, jeopardizing the market's earlier conclusion that peak interest rates would soon be here, followed by an abrupt decline in rates to follow as early as H2/23. This sent both gold and the S&P 500 plunging, with the equity index down over -1.0%, although it still ended the week up 2.2%.
Reactions to both the good and bad news seem a bit overblown
Reactions to both the upside and downside drivers this week seem to have been overblown, moves which look less like the steady gradual upward march of a bull market and more like the volatile swings that tend to characterize a bear market. While there was marginally more dovish language in Powell's statement, the actual action taken by the Fed was clearly bearish, with the Fed Funds Effective Rate not paused or lowered, and at least another 25 basis point hike is still expected. To the downside, the extremely strong jobs numbers were largely a function of a number of restatements in earlier periods. When normalized, they weren’t actually showing a level of recovery in US employment that might warrant the market dip that followed, on fears that a strong employment situation could stamp out the nascent brush fires of easing language in Powell's post-rate-hike statement.
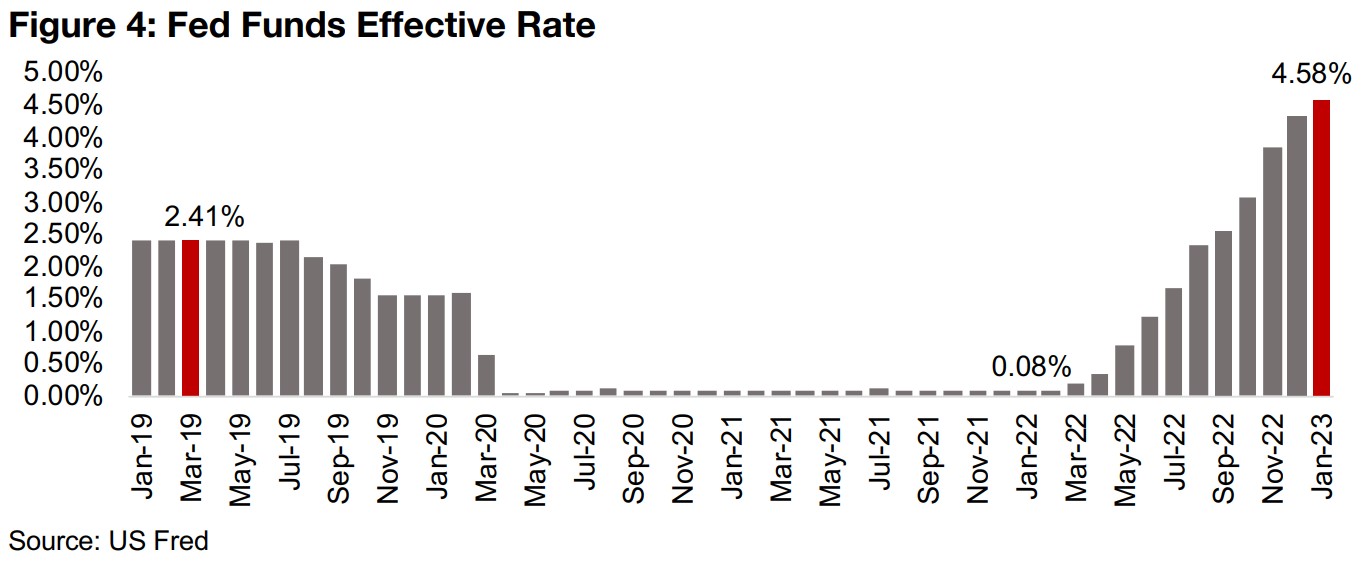
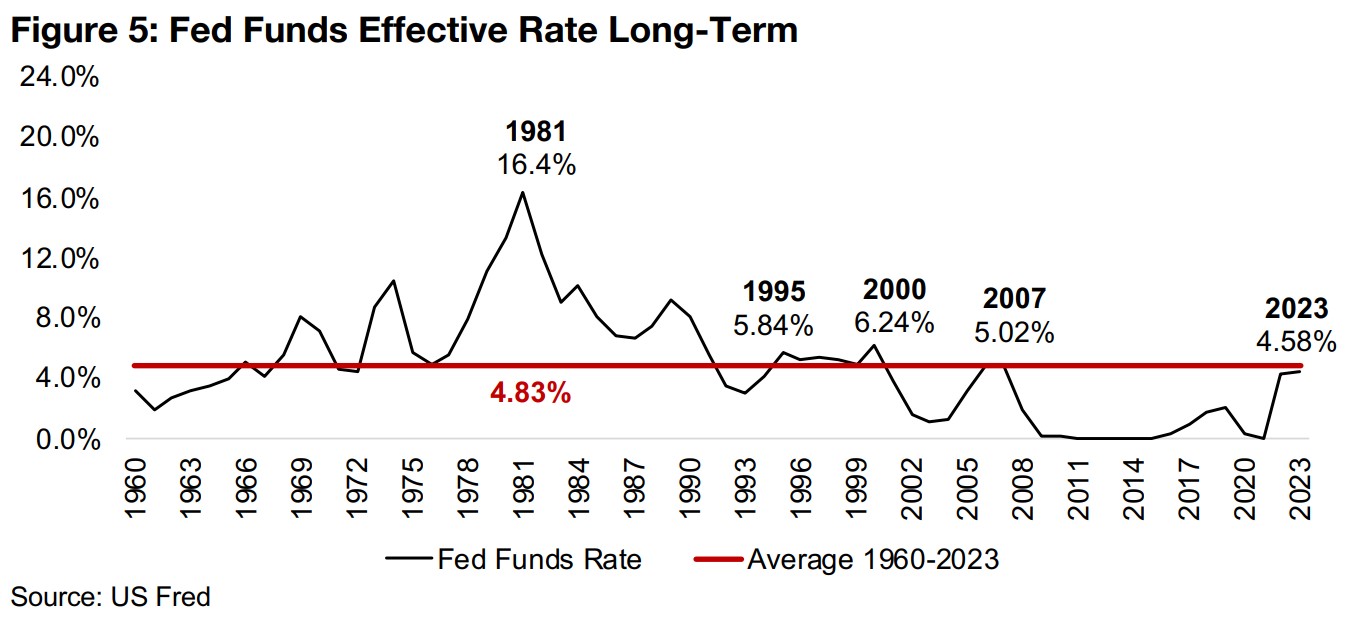
Interest rates getting very high versus long-term averages
The Fed's hike took its Effective Funds Rate up to 4.58%, which, while applauded by
a market perhaps fearing a 50 bps hike, was not particularly good news, as interest
rates are getting extremely high historically. While the economic fallout from this has
been minimal so far, we suspect it probably won't be for long. Figure 4 shows just
how fast they have risen, from near zero in January 2022, only a year ago. They are
not only high versus the extremely low rates of 2020 and 2021, but also in the context
of the last thirty years, with anything above 5.0% towards the top of the range (Figure
5). The only time rates were much higher for a sustained period was through a quite
anomalous period through the late-1980s and into the early-1980s.
That this surge will not have substantial dampening economic effects, as the equity
markets currently seem to be pricing in, seems improbable, in our view. The idea is
apparently that a Fed rate cut, which at the earliest is probably still six months down
the road, will somehow offset the likely upcoming negative effects on company
earnings that has already been unleashed by the rate hikes of the past year. In
contrast, we expect that interest rates heading for 5.0% are very likely to cool the
economy, company earnings, and stock market valuations considerably.
Strong outlook still for gold, but more mixed for gold stocks
While we outline a bearish picture for the economy and equity markets, we still
anticipate a strong year for gold. Even though it took a beating this week, we see this
as a short-term phenomenon with markets overreacting recently to pretty much
everything. We see two major drivers for gold, the first being surging economic and
geopolitical risk driving a flight to the safety of the metal, and another being that the
Fed actually does become dovish and begin cutting rates earlier than expected. The
counter scenario to gold strength is that inflation plummets while economic growth
still remains robust, which was the story from 2012-2018, and in our view unlikely to
be repeated this time around.
For gold stocks, the outlook continues to remain mixed, and we could see the sector
supported by a rising gold price, but battling further declines in overall equity markets,
pulling down valuation multiples whatever the sector. This week we saw the opposite
to this, with the collapse in the gold price driving the fall in gold stocks even as the
equity markets gained, and it remains to be seen which driver will dominate this year,
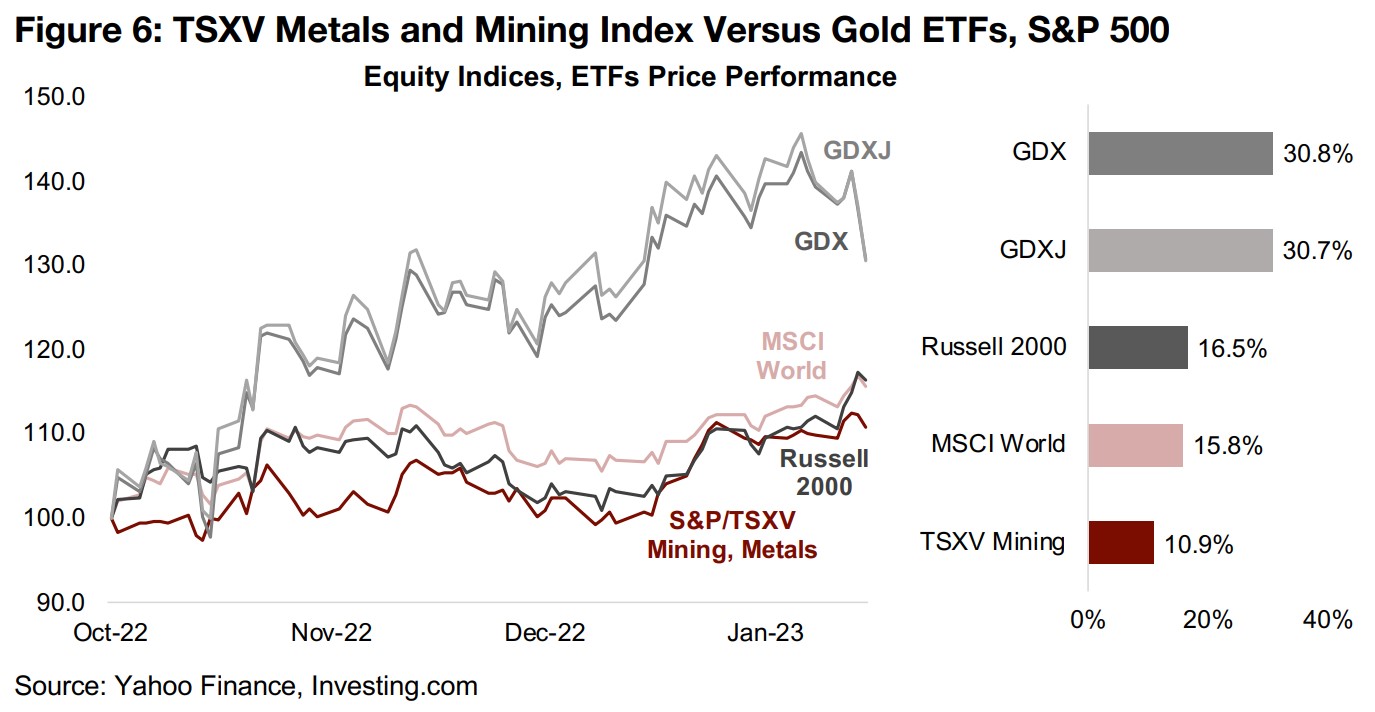
the gold price, or equity markets. Since October 2022 gold stocks have certainly had
both drivers at their back, and both the GDX ETF of producing miners and GDXJ ETF
of junior miners are now up about 31.0%, doubling the MSCI World Equity Index, up
15.8% (Figure 6). The Russell 2000 Index of US small caps has done even better than
global stocks, up 16.5%, showing a bit of a 'return to risk' by the market.
TSXV Metals and Mining Index continues to underperform
All of this makes the underperformance of the S&P/TSXV Metals and Mining Index, up just 10.9%, a bit of a concern, as the strong performance of gold and equity markets, which has even leaned towards small caps, has not been enough to drive it. While part of this will of course be because a large proportion of this index is not gold stocks, other major metals like copper and silver underlying companies in the index have also had a rebound. Overall it also shows risk aversion remains in the markets; even as the 'bigger' small caps in the Russell 2000 are seeing some interest, stock out at the far edges of the risk complex like junior miners are seeing more cautious buyers, and are certainly not 'all the rage' that they were from 2019 and 2020.
'Big Gold' stock PE multiples rising, but cash multiples coming down
Such a strong jump in overall gold stock prices in the past few months could certainly lead to a question of whether their valuations are starting to get a bit pricey. Looking at price to earnings (PE) multiples, the average for the top six largest global gold stocks, Newmont, Barrick, Agnico Eagle, Gold Fields, Yamana and Kinross, has converged with the market. The PE multiple for this group was certainly inexpensive versus the market in 2019, at just 12x, about half the level of the S&P 500 at 22x. However, it has gradually caught up, and for 2023E, is expected to be at 22x, the same level as the S&P 500 (Figure 7). This had been especially driven by the rise in the market multiple of both Newmont, from 13x in 2019 to 31x for 2023E, and Barrick, from 8x to 22x over the same period. Agnico Eagle and Gold Fields' PE multiples have declined, while Yamana is up marginally and Kinross has doubled, but it is smaller and therefore less highly weighted in the average.
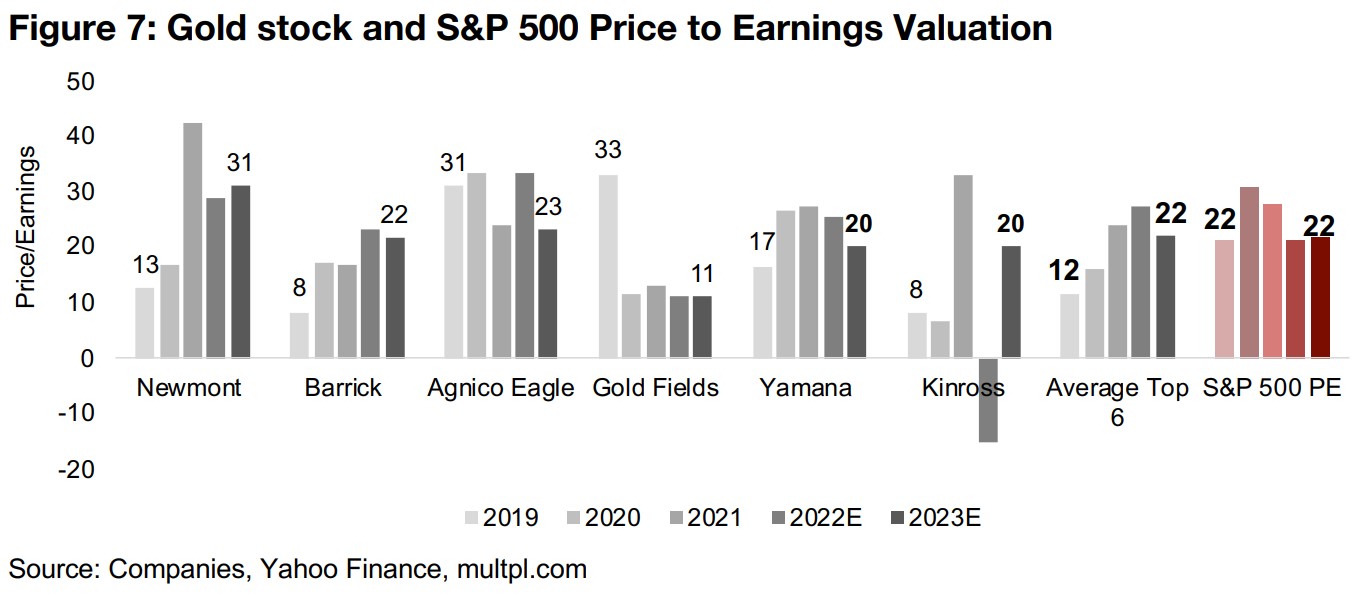
While this convergence of the gold stocks' PE to the S&P 500 level would suggest that gold stocks are not the relatively attractive bargain they were in 2019, we also need to consider what analysts are pricing in terms of the gold price. Looking at revenue growth expectations for the group implies that estimates for the gold price remain muted for 2023, and we could still see the metal surprise to the upside considerably. This could lead to much higher revenue than is currently estimated, and with production and costs per ounce less likely to deviate dramatically from current expectations, could therefore imply much lower PE ratios.
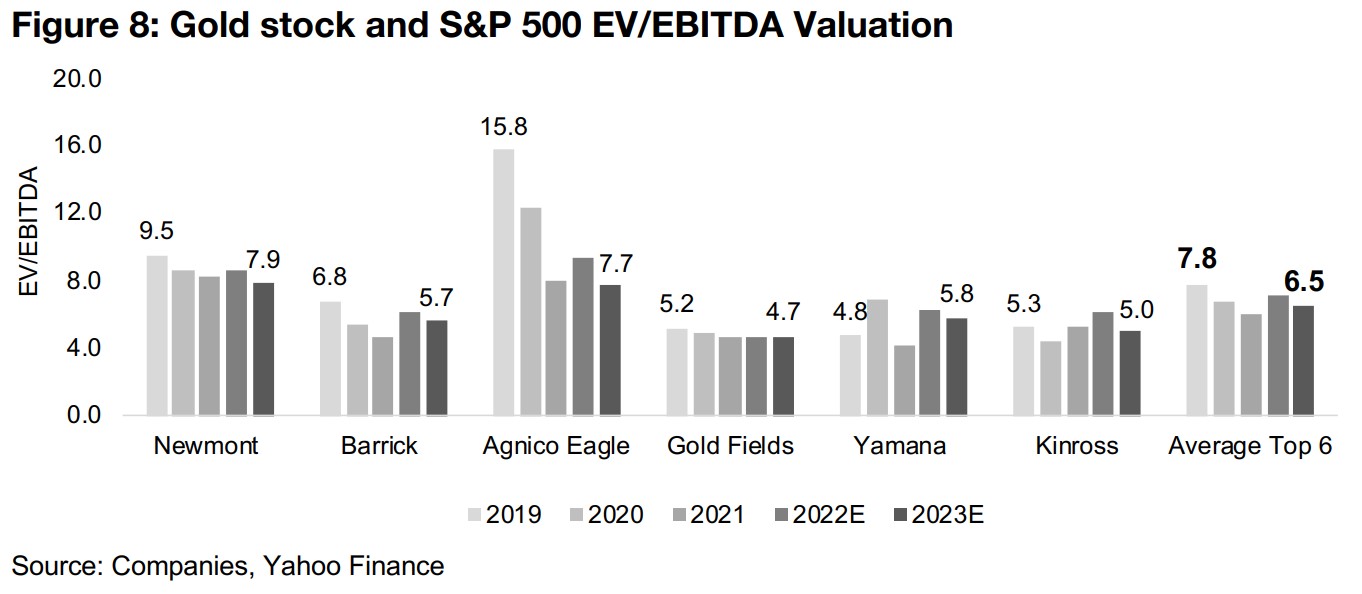
EV/EBITDA multiples declining for Big Gold over past few years
Also, while net earnings multiples have been trending up, cash multiples have clearly
been trending down, with the EV/EBITDA for the group declining from 7.8x in 2019 to
6.5x for 2023E (Figure 8). The EV stands for enterprise value, and takes the market
cap also used in the price to earnings multiples, and then adds the company's net
debt, to account for the cost to buy the entire company outright. The denominator
takes the earnings of the PE multiple, and adds back interest, tax, depreciation and
amortization (to get to 'EB', or 'earnings before' ITDA).
The biggest number here will generally be depreciation, with the big gold companies
having huge outlays in the start-up years of a mine, and while paid in cash upfront,
still show up in the income statement over many years as depreciation, so as to not
concentrate the costs in one period and have the company show a huge loss. This
means that depreciation can reduce the earnings part of the PE multiple, but not have
an effect on EBITDA, which is a proxy for the operating cash flow generated by a
company. So for companies with mines running from 10 to 20 years or more, their
EBITDA can be much higher than their net earnings, which are reduced by
depreciation, the original cost of which hit the cash flow many years earlier.
Of course, to keep earnings going long-term, investment in new mines requiring a
large cash flow will again eventually be required, which makes depreciation a very
real economic expense long-term. However, for many companies with large mines
that have been producing for many years, and limited current and near-term larger
expenditures, the cash can start to really pile up, therefore lowering the cash multiples,
which what we are currently seeing for the 'Big Gold' stocks.
Overall, given the potential for the gold price to surprise to the upside this year, the
valuations for the big gold stocks, even after their big rise after the past few months,
could probably still not be considered excessive. The problem again comes from the
overall equity markets; if rates remain high, valuations for the entire stock market
could be dragged down, and gold stock valuations could go with them. The gold
stocks could see less expensive multiples in absolute terms, but the overall market
multiple would decline too, potentially leaving the relative valuations between them
the same.
Outlining the TSXV Gold Market Cap/Resource to Grade valuation corridor
For the TSXV gold juniors, we do not have any such standard multiples like price to earnings or EV/EBITDA to go on for most of them, as they tend to have no earnings or EBITDA. The most basic metric that we can use is Market Cap/Resource, or what the market is paying per ounce of gold resources the company has reported. Many large TSXV gold juniors are still at the drilling stage, and have no Resource Estimate yet, but the seven the largest TSXV developers do (Figure 9). We plot the average gold grade across the total Resources of a given developer and compare this to what the market is paying per resource, which forms a reasonably concentrated 'valuation corridor' for the group.
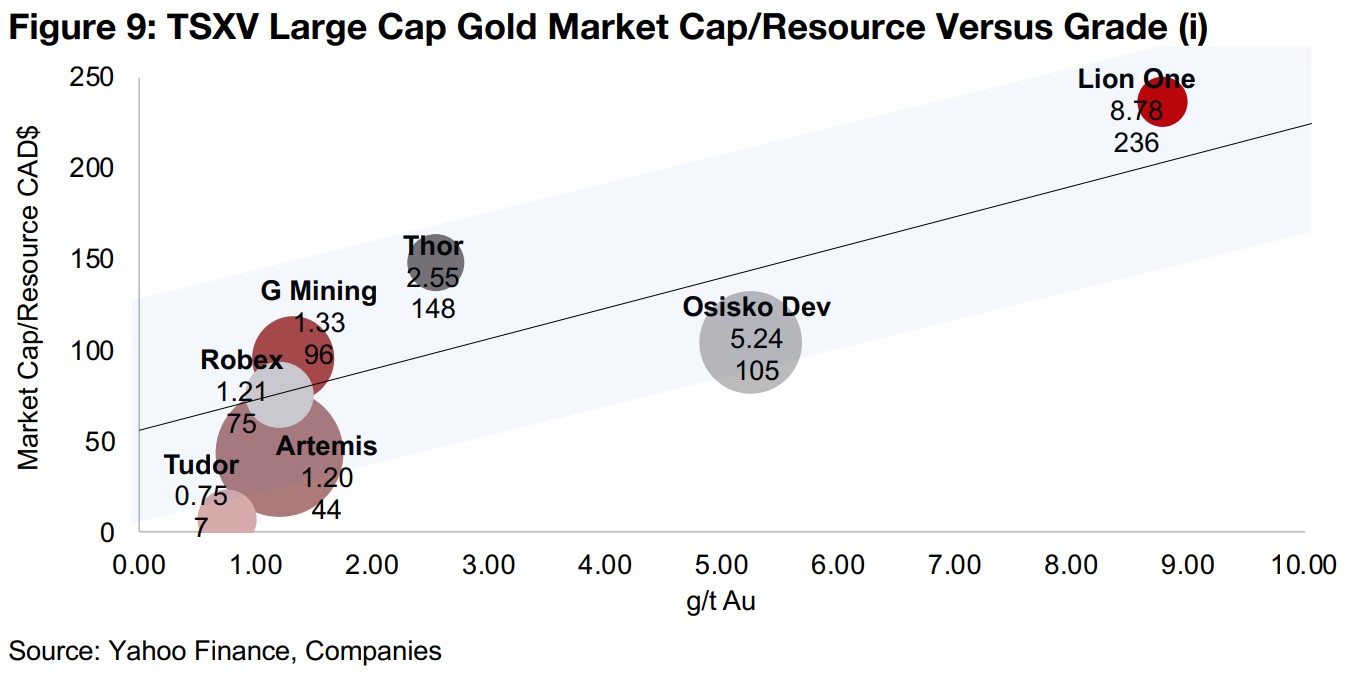
Lion One, Osisko Development and Thor Explorations the high-grade outliers
As would be expected, generally the higher the grade, the more the market is willing
to pay per ounce. Outlier Lion One Metals has by far the highest average gold grade
of the group, at 8.78 g/t Au for its Tuvatu project, and are reimbursed by the market
with the highest price per resource, at CAD$236/oz (Figure 9). While Osisko
Development also had a very high relative grade across its projects, at 5.24 g/t Au, it
is commanding a lower price per ounce than some companies with a lower grade.
This is because the CAD$100 or more range in market cap to resource within the
corridor at a given grade also accounts for a number of other risk factors, including
how advanced the project is, the risk of its jurisdiction, and many other issues. Thor
Explorations for example, while having about half the grade of Osisko Development,
at 2.55 g/t Au, is valued at CAD$148/oz. This is because Thor has been in commercial
production for a year at its Segilola project, reducing risk, while Osisko's flagship
Cariboo has just reached the Feasibility Study Stage, although it does have small
scale production from its Trixie project, and a third has not reached the PEA stage.
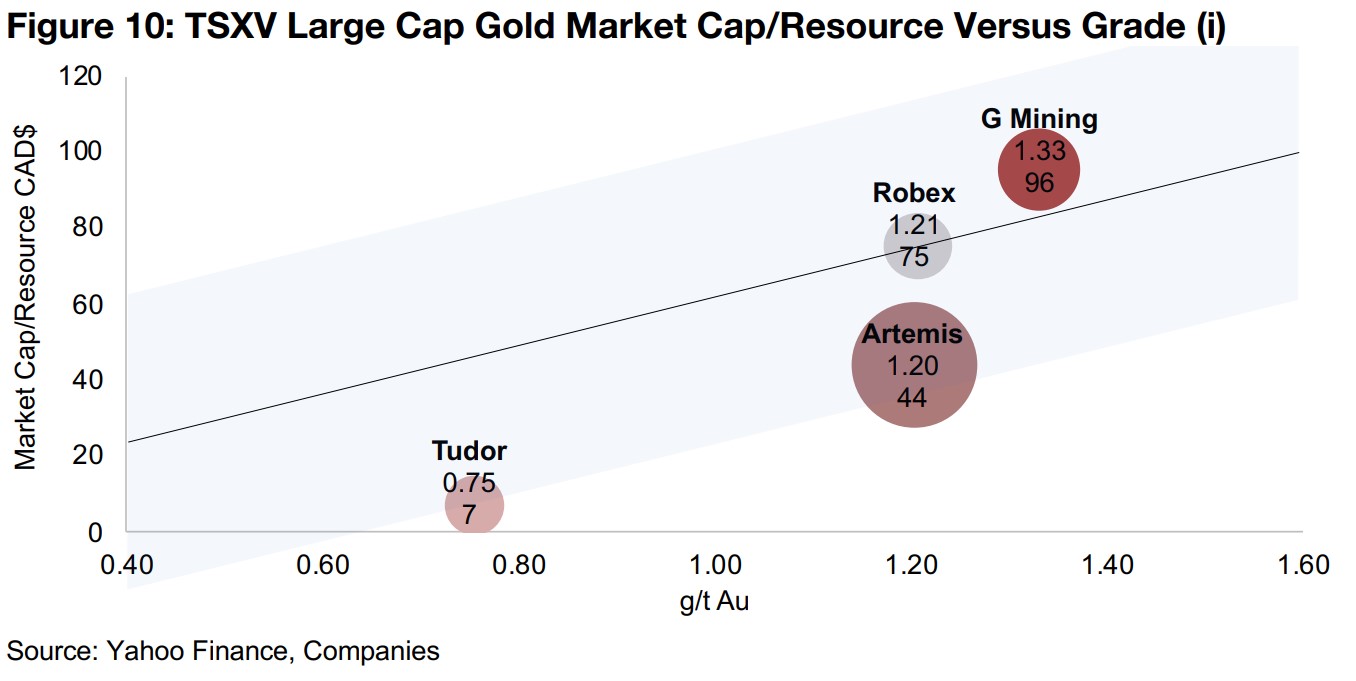
G Mining, Robex and Artemis sport moderate grades, with Tudor the lowest
In Figure 10 we zoom in on the remaining four companies, which have more moderate gold grades. G Mining Ventures averages 1.33 g/t Au for its advanced Tocantinzinho project, with production targeted by H2/24, affording it a reasonably high valuation of CAD$96/oz. Artemis Gold and Robex Resources offer an interesting comparison, as they have almost exactly the same grade, at 1.20 and 1.21 g/t Au oz. Robex Resources sees a higher valuation at CAD$75/oz, with it having been in commercial production since 2017. Artemis trades at just CAD$44/oz, as it is still on the verge of construction, and is a huge project with very high capital requirements over multiple stages for over a twenty-year life span, adding financing risk, while Robex's projects have a 7-8 year mine life, and one produces cash flow, for a lower financing risk. Tudor Gold is clearly the laggard of the group, with its comparably low grade of just 0.75 g/t Au driving quite a low valuation of just US$7/oz.
Valuation corridor a useful, if blunt, instrument
The valuation corridor is useful to see what the market is paying for levels of gold grades and risk, and it could also assist in backing out what the market is implying for pre-resource companies based on the average grades they are drilling. For example we could extrapolate the corridor using the largest gold stock on the TSXV, New Found Gold, which is pre-resource, with an average for its headline drill results at a huge 60 g/t Au. While the actual grade in its Resource Estimate will be likely be substantially below this, just moving along the valuation corridor out to 10-15 g/t Au would imply a very high market cap to resource even at the bottom of the range. However, the valuation corridor certainly does not encompass all scenarios, such as Minera Alamos, for example, a large TSXV gold developer which we have not included, which has an average grade of 1.67 g/t, but an average Market Cap/Resource of CAD$264/oz, placing it well above the top of the range.
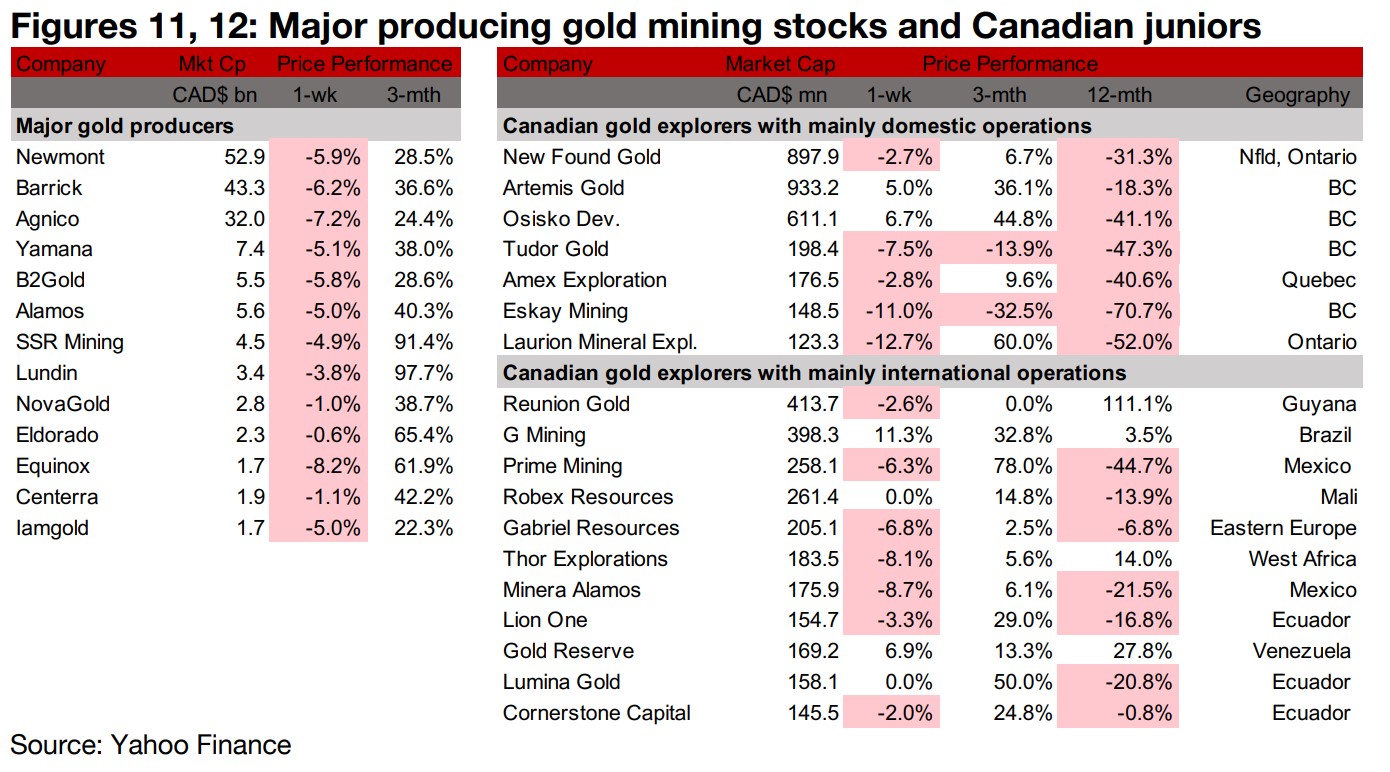
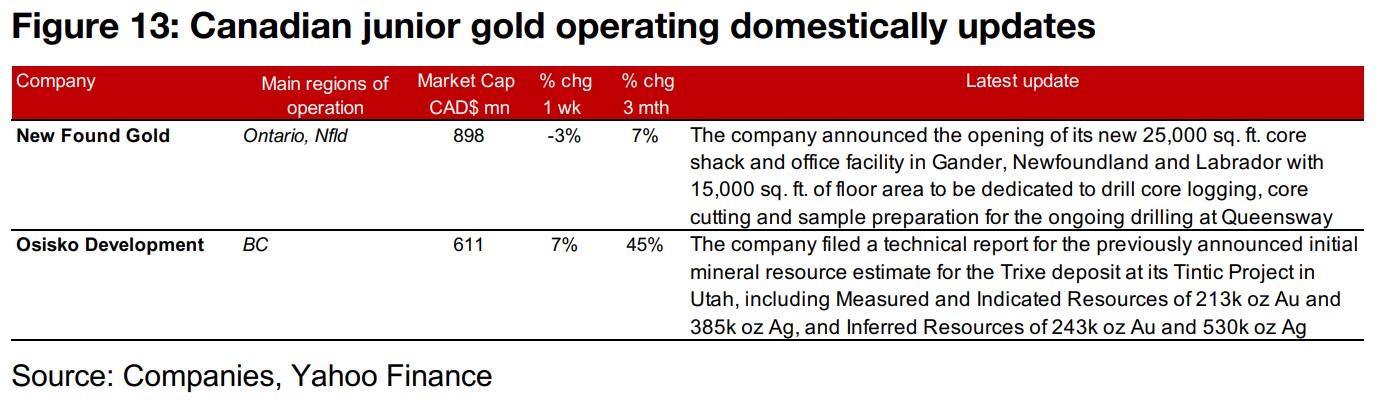
Gold producers all drop and TSXV gold stocks mainly down
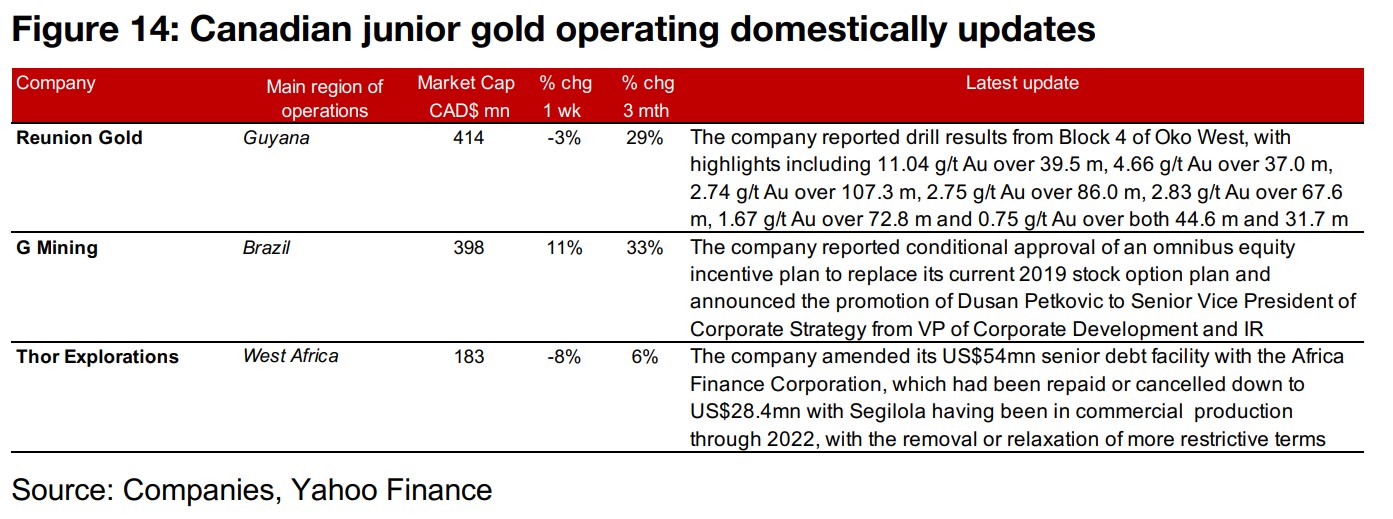
The producing gold miners all declined and the TSXV junior gold miners were mostly down on the slide in the gold price, ending a five-week uptrend (Figures 11, 12). For the Canadian juniors operating mainly domestically, New Found Gold announced the opening of its new 25,000 sq. ft. core shack and office facility in Gander, Newfoundland and Labrador, and Osisko Development filed a technical report for the previously announced Initial Mineral Resource Estimate for the Trixie Deposit of its Tintic Project (Figure 13). For the Canadian juniors operating main internationally, Reunion Gold reported drill results from Block 4 of Oko West, G Mining reported conditional approval of an omnibus equity incentive plan and the promotion of Dusan Pekovic to Senior Vice President of Corporate Strategy and Thor Explorations amended its senior debt facility with the Africa Finance Corporation with the removal or relaxation of more restrictive terms (Figure 14).
Disclaimer: This report is for informational use only and should not be used an alternative to the financial and legal advice of a qualified professional in business planning and investment. We do not represent that forecasts in this report will lead to a specific outcome or result, and are not liable in the event of any business action taken in whole or in part as a result of the contents of this report.