December 16, 2024
The Stagflation Situation
Author - Ben McGregor
Spectre of stagflation looms over base metals
Stagflation remains a threat, with inflation likely to remain high as global central banks continue rate cuts while GDP growth is expected to decline or remain low in the US, EU and China in 2025, which could be tough on base metals, but still support gold.


The Stagflation Situation
Gold rose 1.4% to US$2,677/oz, with December seeing much more stable price
action so far than November when there were several aggressive weekly moves
driven by geopolitics. This week the key economic data was US inflation, with an
increase in both producer and consumer prices, although these gains were inline with
expectations. Relatively hot US prices did not dissuade the market from expecting a
rate cut from the US Fed at its December 18, 2024 meeting, with the odds of a 25
bps reduction to a 4.25%-4.50% range at 96%.
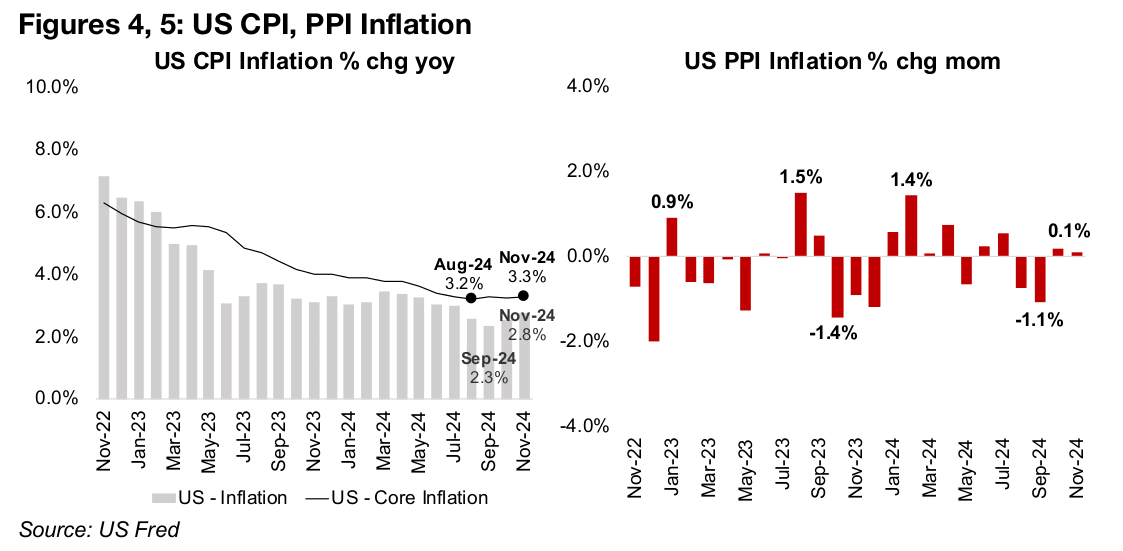
The headline US CPI inflation rose to 2.8% in November 2024, up about half a percent
from lows of 2.3% in September 2024, while core inflation remained at 3.3%, having
roughly flattened since August 2024 (Figure 4). The US producer price index rose 0.1%
month on month in November 2024, for a second month above zero, after it had been
negative in August and September 2024 (Figure 5). The flattening of the core CPI
above 3.0% remains an issue for the Fed, as it targets 2.0%, although the expected
cut this month would seem to go against reaching this level and could boost prices.
More signs of rising US Canada trade tensions
Potentially rising trade tensions between the US and Canada were in focus this week
as the latter announced it could impose taxes on a number of key commodity exports
to the US, including oil, uranium and potash. This was in response to indications by
the new Trump government in a recent meeting with Canada’s Prime Minister that
substantial tariffs hikes are still a possibility for the country, even given the close trade
and political ties. These products seem to have been specifically targeted as Canada
is the largest exporter to the US for all three, at 52% of oil and petroleum products,
27% of uranium and 77% of potash.
Oil and petroleum products are one of the US’s largest imports, accounting for 6.3%
of the total in 2022, making Canadian oil imports a sizeable 3.3% of US total imports.
The total value of US uranium imports are also relatively high, at 4.8% of the total US
imports 2022, although potash imports are much smaller, at just 0.13% of US imports
in 2023. Canada also supplies the majority of US imports of several other key metals,
at 99% of gold ore and concentrates, 52% of aluminum, 62% of refined copper and
62% of zinc. Therefore, in terms of the metals sector it seems that Canada may have
significant leverage in negotiating trade terms.
It remains to be seen how much of Trump’s claims are a negotiating ploy, setting out
an aggressive initial offer with the intention of pulling back to more reasonable terms,
or if major tariff hikes will be implemented and provoke trade retaliation from Canada
and other countries. It seems likely that US tariffs will increase, but it is not clear by
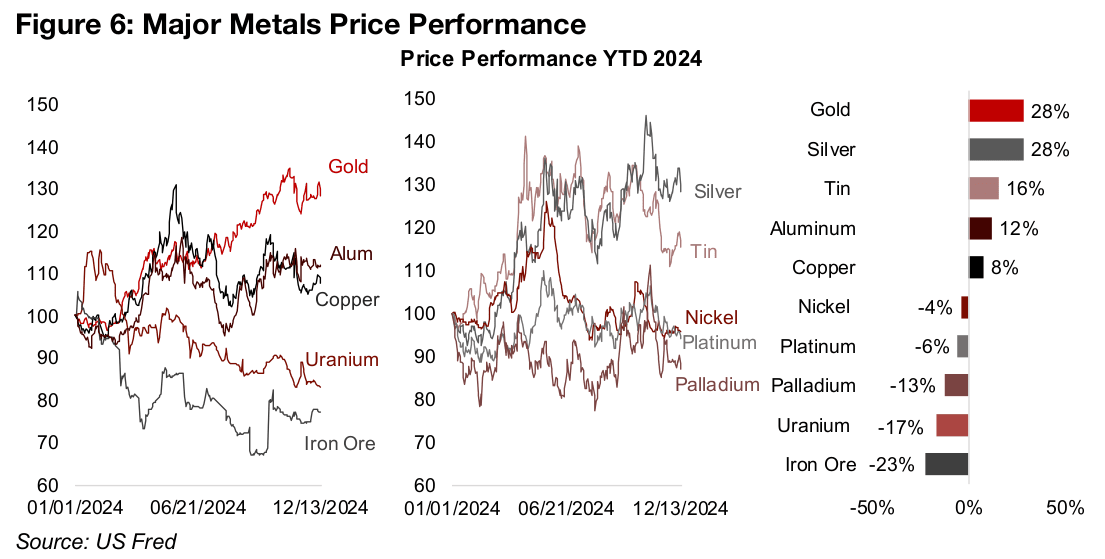
how much and for which products and countries. The metals markets were not been
hit much by the election results, having remained quite flat since November 2024, but
did see substantial declines in October 2024 (Figure 6). Apparently the market is
awaiting actual implementation of the new policies, which won’t start until next year.
Major metals not gaining much on China stimulus announcements
One interesting factor about the decline in many metals in October 2024 and relatively
flat performance since has been its concurrence with China’s announcement of
stimulus plans. With China such a huge player in most of the major metals markets,
it might have been expected that these measures would have given them at least
some boost. That this did not happen could be because markets were anticipating
something much more aggressive, or expectations that the new measures will take
some time to have any major effect.
The country’s government announced an initial monetary stimulus in October 2024,
aimed at boosting both the equity and property markets. This included lower interest
and mortgage rates and lower bank reserve requirements, allowing them to expand
lending. This week China followed up with further stimulus announcements, including
fiscal policy measures and an additional loosening of monetary policy.
China is a leader in all the top four metals markets, iron ore, gold, aluminum and
copper, in at least one of production, consumption, imports or exports. It accounts
for the majority of global iron ore demand, for its use in steel and in turn the country’s
huge property and infrastructure market. It also accounts for over 50% of refined
copper consumption and is a major player for aluminum.
China no longer heavily reliant on exports
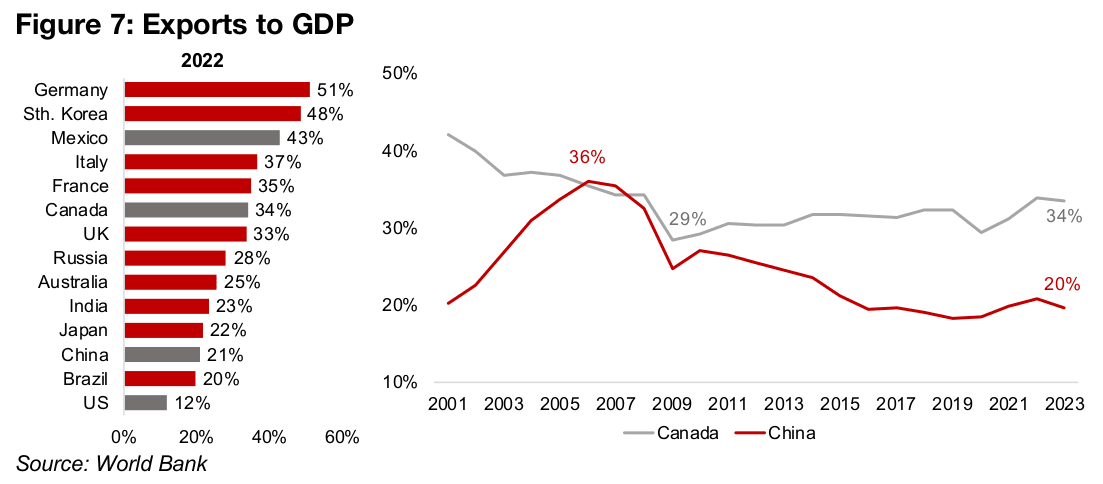
China had historically been more export driven, including for metals, with much of the final demand for its production in other countries, especially the US and Europe. However, this has changed significantly over the past two decades, with China’s exports to GDP falling from a peak 36% in the mid-2000s, to just 20% as of 2023. In 2022 it was ranked near the bottom on this measure for the largest countries by GDP at 21%, less than half the most export reliant major country, Germany, with exports/GDP of 51%, and well below Canada at 34% (Figure 7).
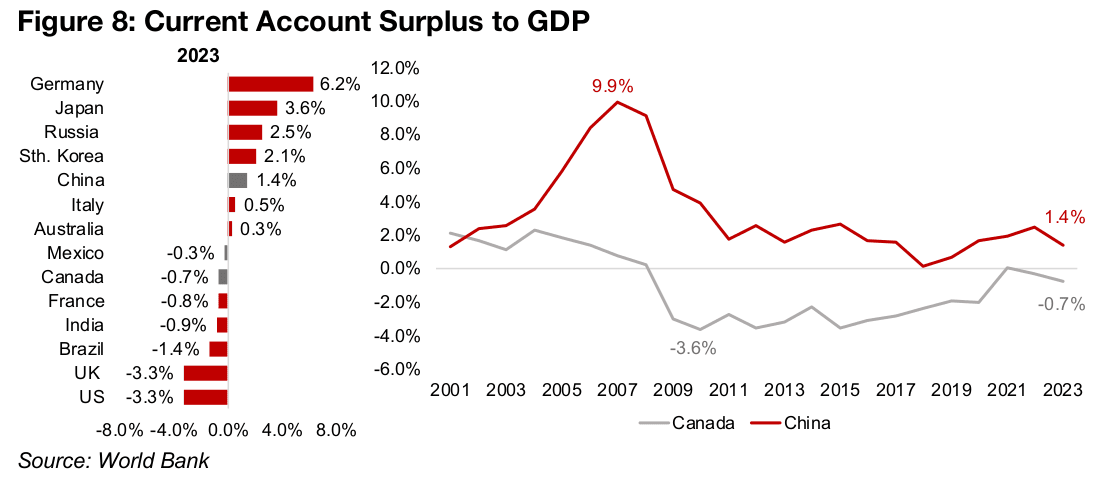
Another similar measure of a country’s export reliance is the current account balance to GDP, with a surplus for a country exporting more than it imports, and a deficit for the reverse. China’s trade is actually relatively well balanced versus other major countries, with a current account surplus of just 1.4% in 2023, compared to a very high peak of 9.9% in 2007 when it was at its most export reliant (Figure 8). This measure also shows Germany as heavily export reliant, with a current account surplus to GDP of 6.2%, while the US and UK have the widest current account deficits to GDP, at 3.3%, and Canada only a slight deficit, at -0.7% of GDP.
Growth for several major economies expected to slow in 2025
The shift in China towards a reliance on domestic demand for growth, and its rise to the world’s second largest economy, also means that metal markets are more geared to the country. This could explain some of the recent weakness in metals prices with the IMF estimating a decline in China’s GDP growth to 4.5% next year (Figure 9). The IMF also expects US growth to contract to 2.2%, and remain sluggish for Germany and Japan, at 0.8% and 1.1%, the other three largest economies (Figure 10).
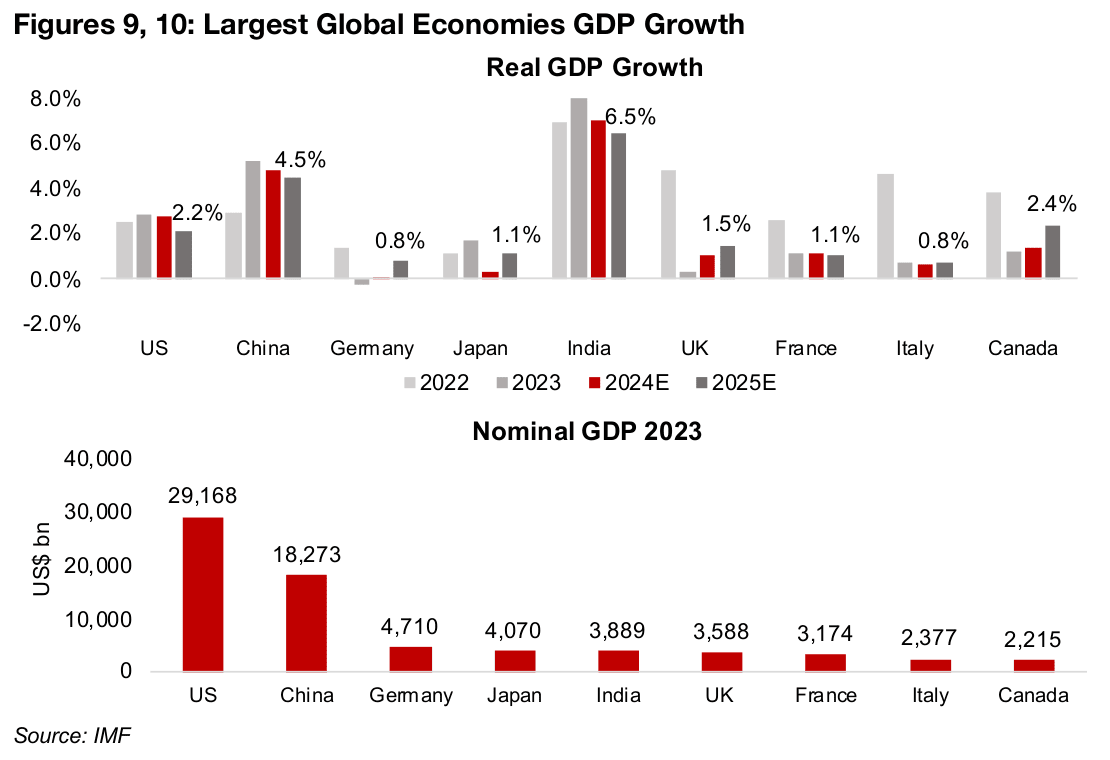
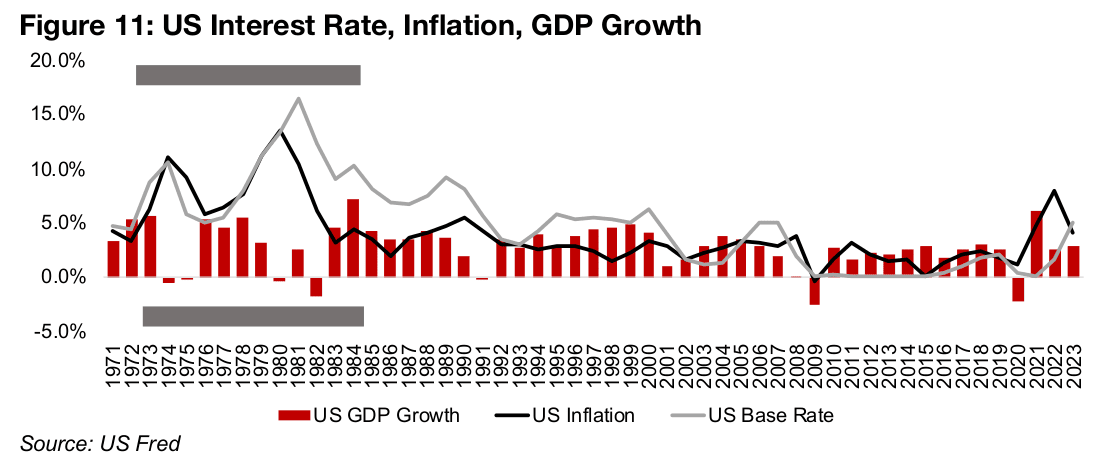
Growth is expected to slow even as global central banks cut rates, implying a rising global money supply and potential resurgence of inflation. This raises the spectre of stagflation, a period of low GDP growth coupled with high inflation. While rate cuts generally drive up GDP, there can be a long lag time, and growth can remain low even as the expanded money supply drives up prices. There have even been extended periods with high inflation and low growth, with the main precedent from the mid- 1970s to early 1980s, when US GDP was weak but prices surged, and a huge increase in interest rates was eventually required to finally curb inflation (Figure 11).
Global rate cuts could drive inflation back up
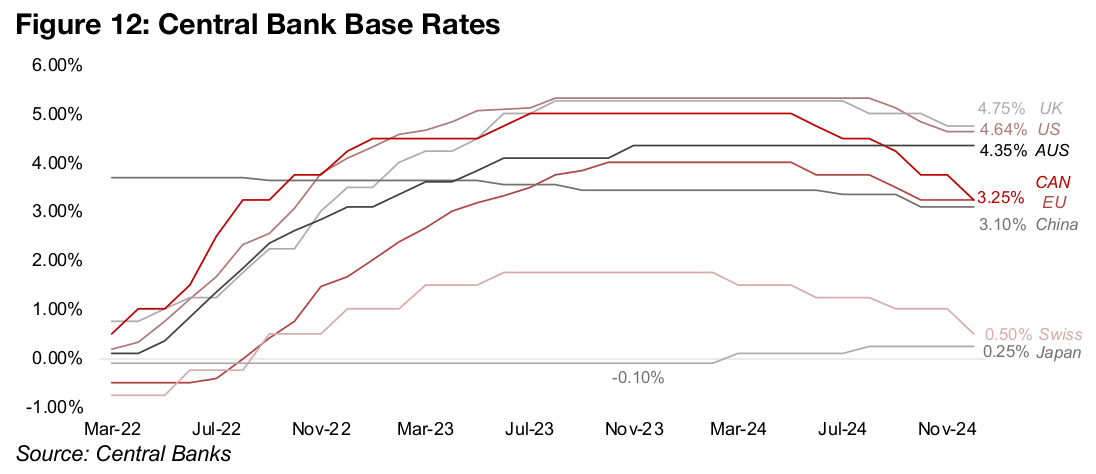
Almost all the major central banks are now in a rate cutting cycle that started with the Swiss National Bank early in 2024 and was followed by Canada, the EU, China and the UK by mid-year, and finally the US in September (Figure 12). Only the Bank of Japan has hiked rates this year, but this was up from a negative rate previously, while the Bank of Australia is the only major central bank with rates still on hold since 2023.
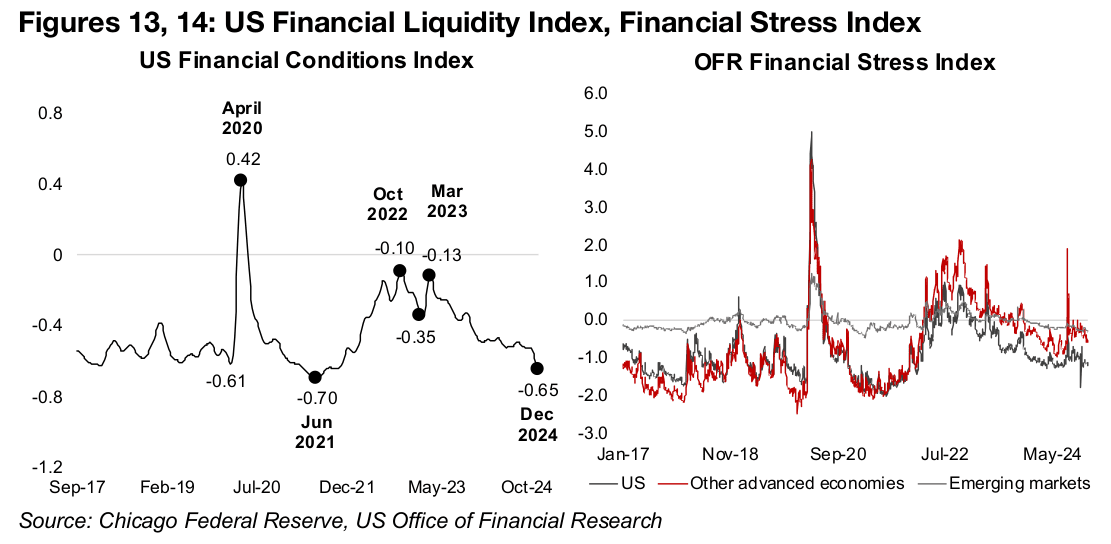
Two key liquidity measures show that financial conditions continue to ease, and this
can have inflationary effects. The US Financial Conditions Index has dropped to -0.65
in December 2024, its lowest level since June 2021, indicating a considerable
improvement in liquidity (Figure 13). The OFR Financial Stress Index has also declined
steadily since mid-2022 for the US and other advanced economies, which indicates
an improvement in financial conditions (Figure 14).
Overall the potential for global inflation to surprise to the upside in 2025 seems to be
rising, and if economic growth does turn out to be sluggish next year, the central
banks will be even more likely to continue cutting. If there is a significant lag between
the timing of these cuts and their actual boost to economic growth, while the new
money continues to drive up prices, a stagflationary scenario could result. We also
note that the IMF and other major institutions tend to have an upward bias in their
forward year estimates, outside of periods of obvious major crises. This suggest that
growth for the major economies could come in even lower than these forecasts.
For the base metals, a period of sluggish growth would likely be a negative overall,
with the prices heavily geared to the industrial cycle. We have already seen over the
past month and a half base metals prices remaining relatively flat as the market starts
to price in just some of the potential for a stagflationary scenario. For gold, which is
driven more by monetary factors, a pickup in inflation, which is a possibility if global
rate cuts continue, could be a major driver, even if overall GDP growth remained slow,
as occurred from the mid-1970s through to the early 1980s.
Large gold producers mostly up and large TSXV gold mixed
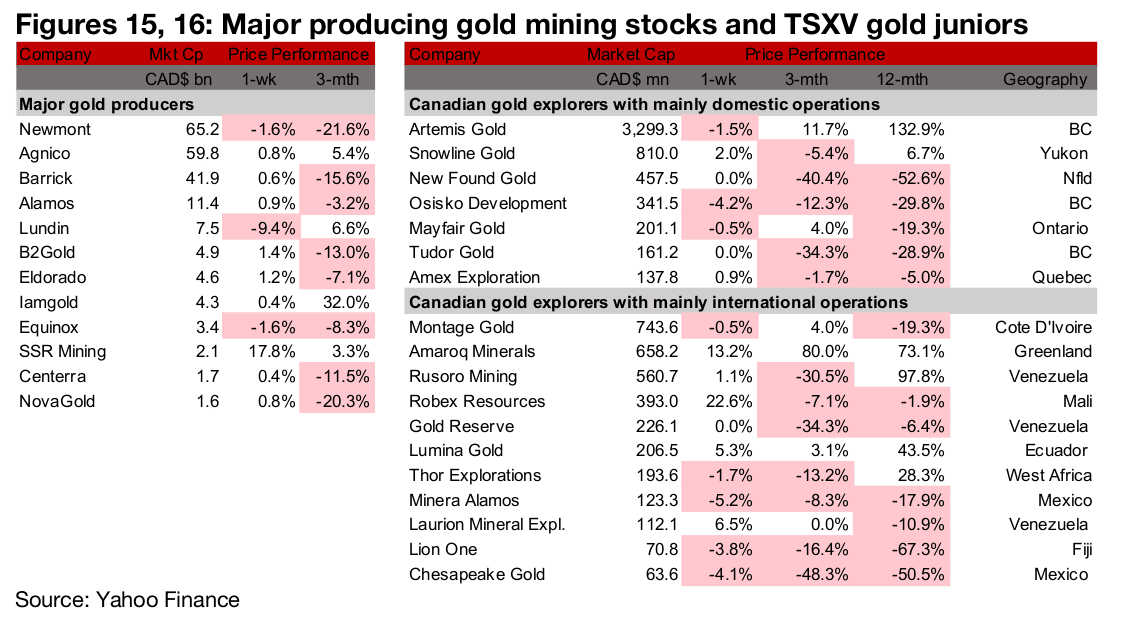
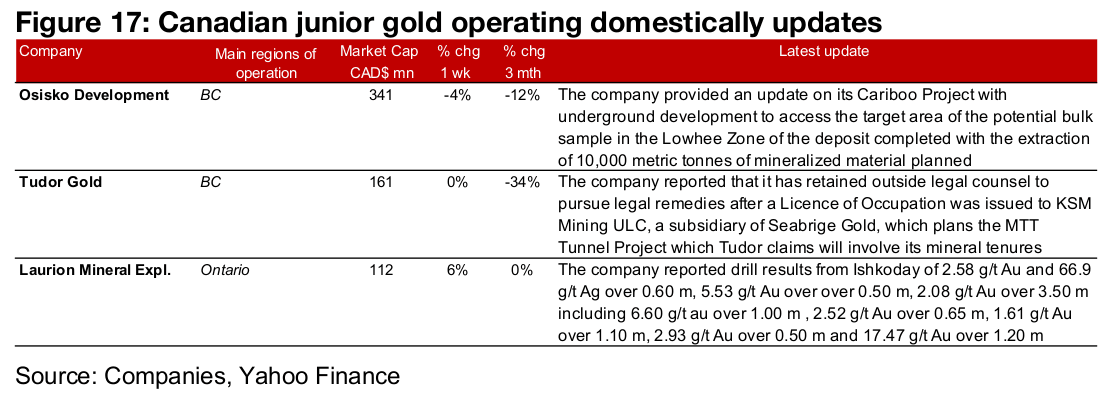
The large gold producers mostly rose while large TSXV gold was mixed (Figures 15, 16). For the TSXV gold companies operating domestically, Osisko Development provided an update on bulk sample underground development at Cariboo, Tudor Gold retained legal counsel regarding an issue with Seabridge and Laurion reported drill results from Ishkoday (Figure 17) For the TSXV gold companies operating internationally, Amaroq reported sampling from the Eagle’s Nest target at the Anoritooq licence and Lumina reported that Ecuador had extended its EIPA agreement (Figure 18).

Disclaimer: This report is for informational use only and should not be used an alternative to the financial and legal advice of a qualified professional in business planning and investment. We do not represent that forecasts in this report will lead to a specific outcome or result, and are not liable in the event of any business action taken in whole or in part as a result of the contents of this report.


