November 07, 2022
The Relentless Fed
Author - Ben McGregor
Gold dips on Fed hike, rebounds on US jobs report
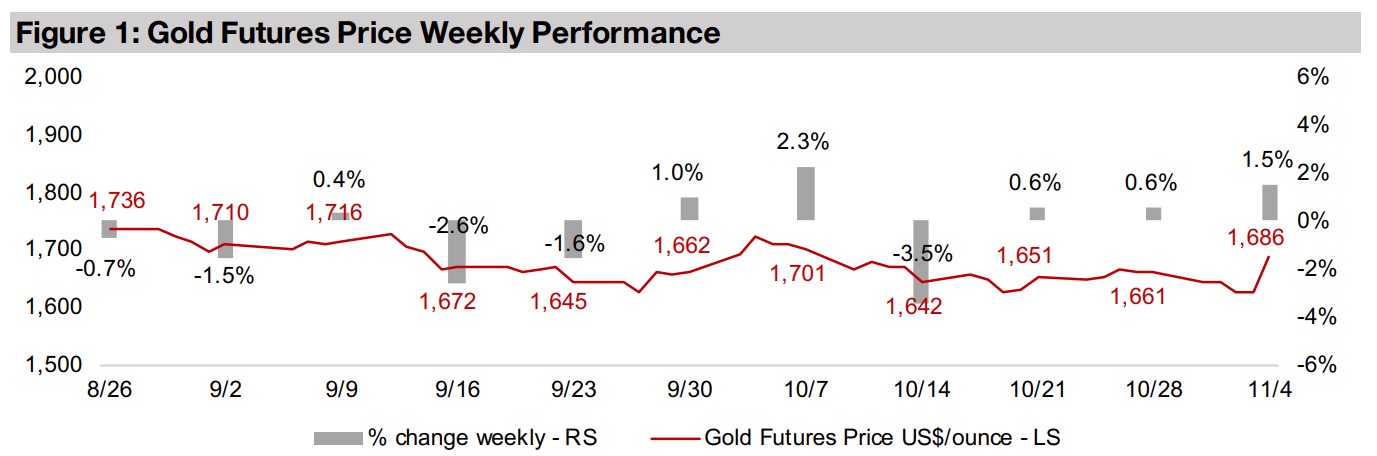
Gold dipped initially this week as the Fed came through with a 75 bps rate hike, but then rebounded later in the week on a US jobs report viewed by the market as showing a weak employment situation, increasing the chance of a Fed pullback.
Producers' Q3/22 results squeezed by falling gold price, inflation
With Newmont, Barrick and B2Gold all reporting Q3/22 this week, the results of the big five Canadian producers are now in, with revenue for the group hit by a decline yoy in the gold price and income curbed by a substantial rise in costs on high inflation.
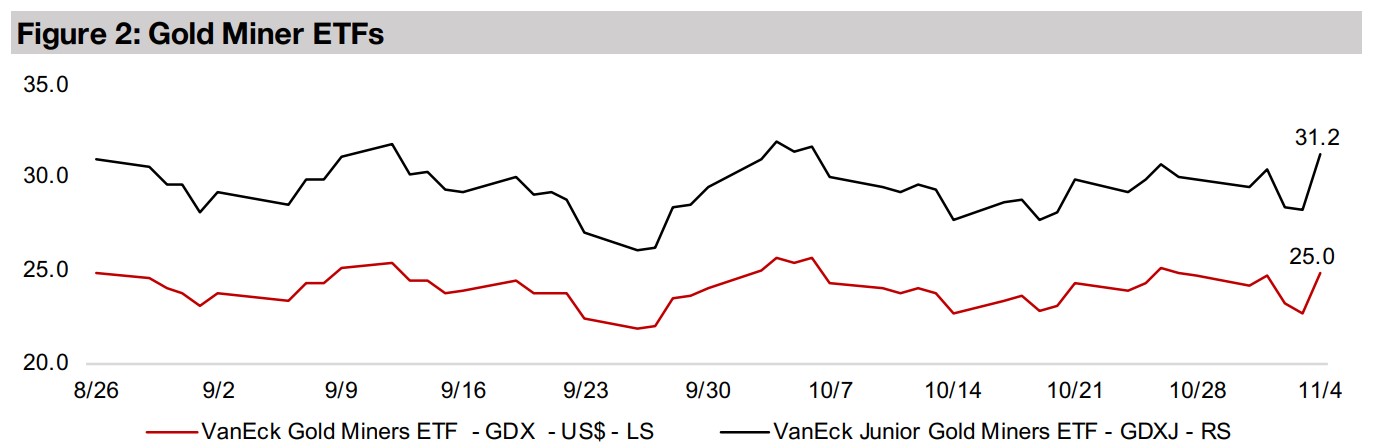
Producers and juniors first plunge, but end week higher
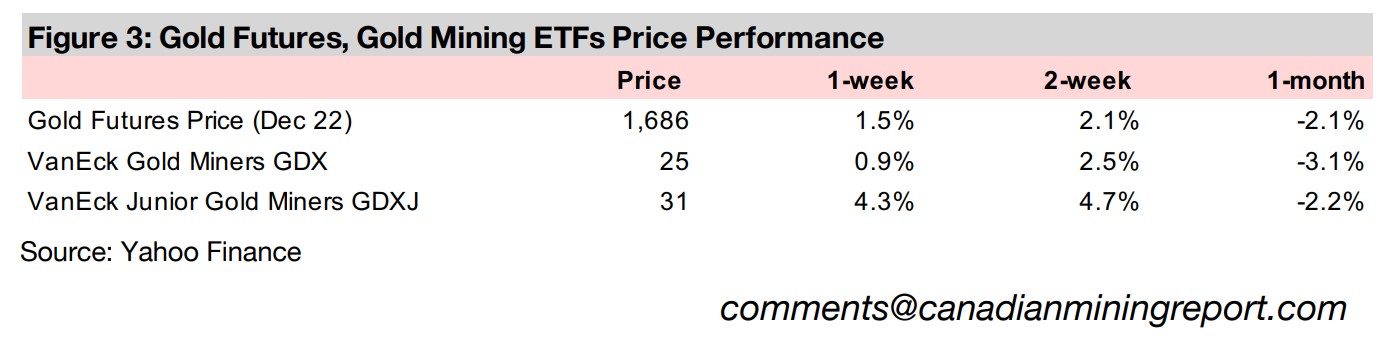
The producing and junior gold miners first plunged towards six-week lows but then more than regained their losses, with the GDX up 0.9% and GDXJ rising 4.3% as the hawkish Fed announcement was followed by the weak employment report.


The Relentless Fed
Gold ended the week up 1.5%, after a rollercoaster ride saw it plunge 2.0% to US$1,627/oz, its lowest level since March 2020, on the Fed's 75 bps rate hike, before rebounding on a US jobs report that was viewed as weak by the market, increasing hopes of a Fed pullback. Once again, we believe that the market may be getting ahead of itself, with the Fed's hike this week showing that the weak economy and equity markets are not compelling it to back off at all on its relentless assault on inflation. The very strong reaction to the US jobs report was also interesting, as it was not entirely negative, with new job additions coming in above expectations, and while the unemployment rate rose from 3.5% to 3.7%, this is still near multi-decade lows.
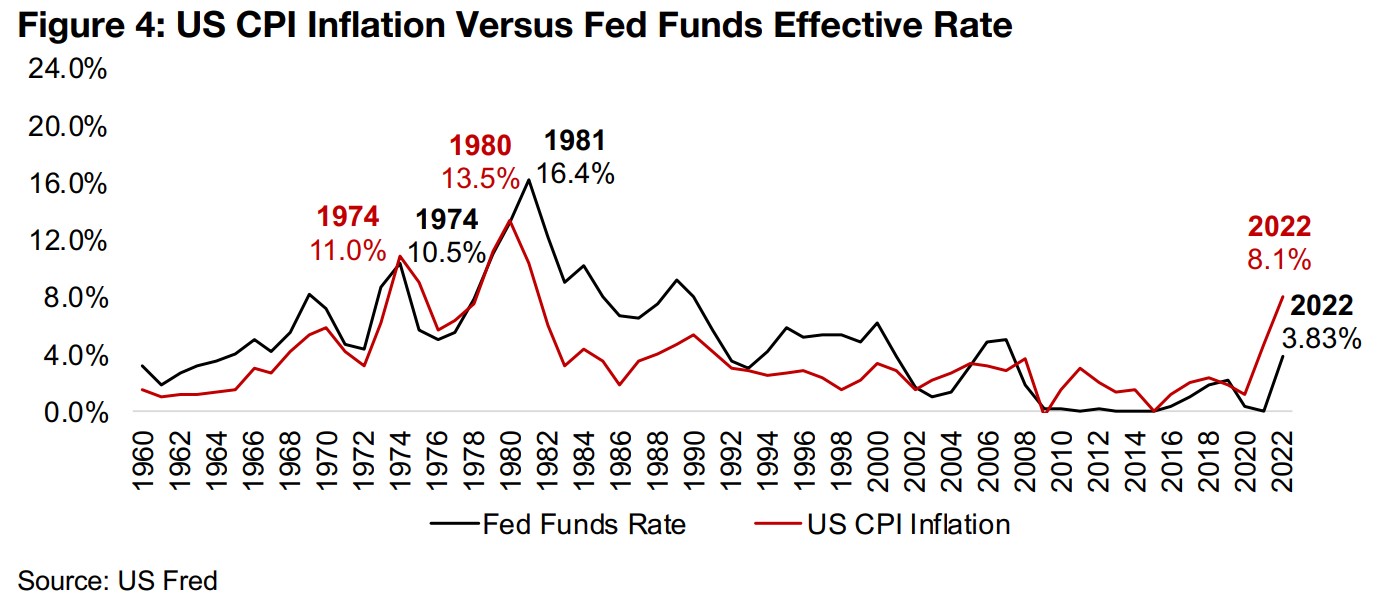
Is the Fed only 'halfway there' in curbing inflation?
The Fed's hikes sent its Effective Funds Rate up to 3.83%, its highest level since 2007, with current expectations for rates to peak around mid-2023 just above 5.20%. However, looking at two biggest spikes in US inflation over the past century, in the mid-1970s and the early 1980s, in both periods the Fed Effective Funds rate had to match or exceed inflation to truly curb it. The Fed will surely be taking into account that the hike in 1974 to 10.5%, or just below the 11.0% inflation that year, only reduced inflation temporarily. It was only when it spiked its rate to 16.4% in 1981, well above the 13.5% peak inflation of 1980, that inflation was truly brought under control. With the Effective rate now nearing 4.0%, the 1970s experience would indicate the Fed is about 'halfway there' in curbing inflation at just over 8.0%.
Therefore, the big questions remain; will the 5.0% the market expects be enough to bring down inflation, and at what point do high rates generate such economic fallout that they become politically unfeasible? Also, given the lagged effect of rate changes on the economy, the full outcome from current hikes might not be fully felt until mid-2023 or later, so it is difficult for the Fed to assess if they have already gone too far. Overall, we expect the Fed to remain relentless until at least the end of this year, and while this will likely continue to pressure gold and gold stocks, the period may still be peppered with rallies like this week when hope for a time outpaces the difficult reality.
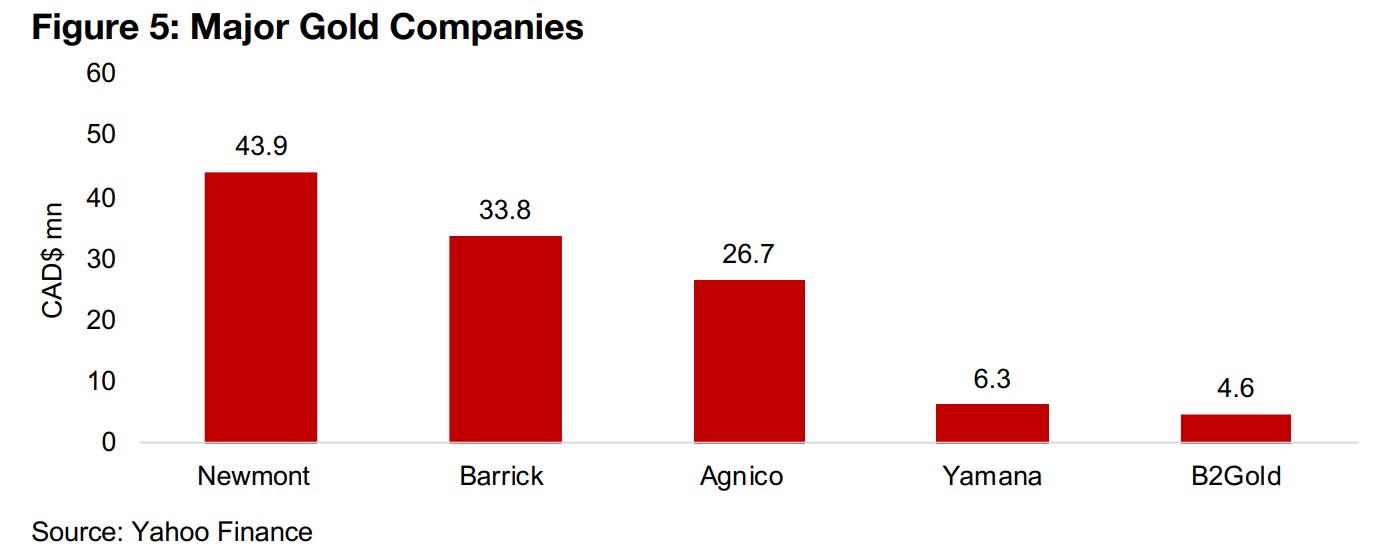
Newmont, Barrick and B2Gold report Q3/22 results
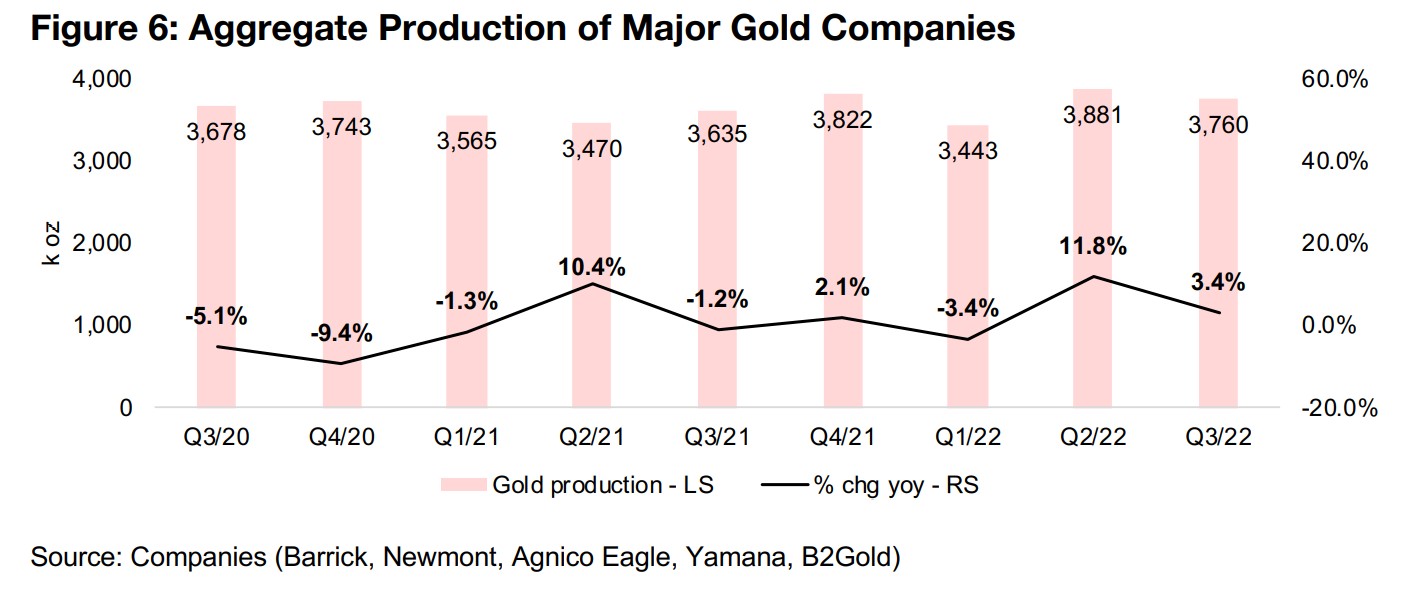
With Newmont, Barrick and B2Gold announcing Q3/22 results this week, the largest five gold Canadian producers have all reported, allowing for a look at the overall aggregate trends for the industry (Figure 5). Production growth edged down to 3.4% for Q3/22 for the top five to 3.76 mn oz AuEq, down from 11.8% in Q2/22 (Figure 6). However, the high growth of the last two quarters is not organic, and is mainly driven by Agnico Eagle's acquisition of Kirkland Lake which completed in February 2022, and should continue to drive high yoy growth for the next two quarters.
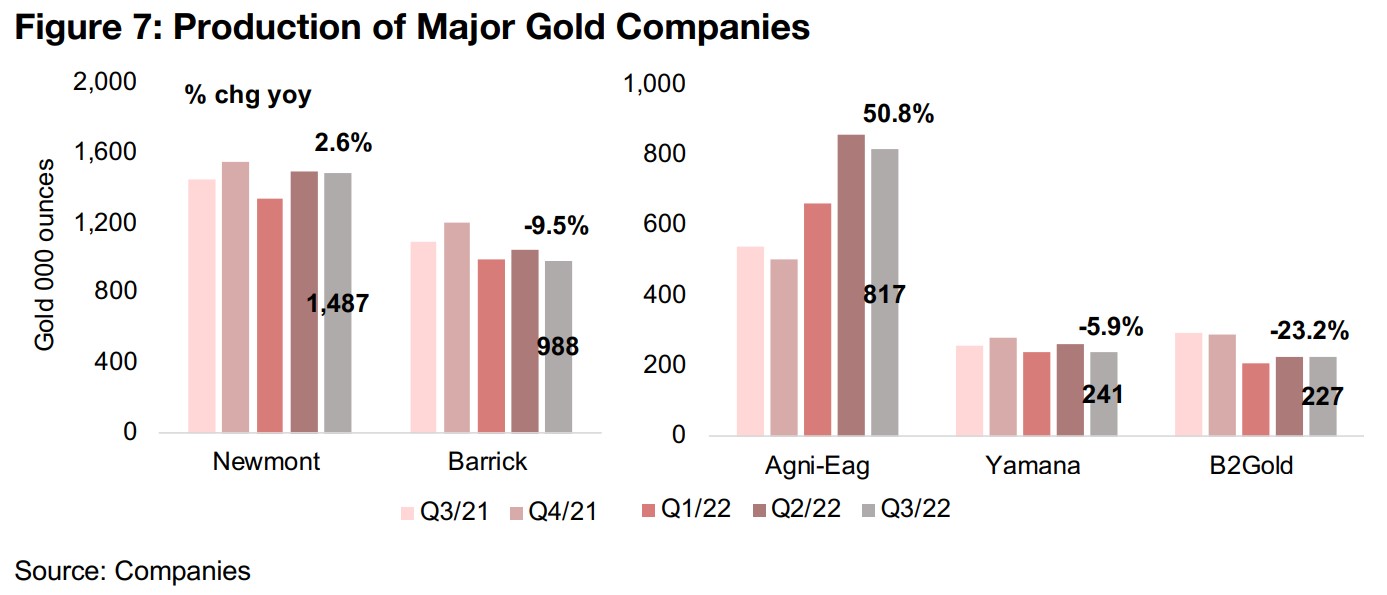
Revenue growth down for all except Agnico Eagle on gold price decline
Apart from the 50.8% Q3/22 increase from Agnico Eagle, production growth has
remained muted, with Newmont seeing the strongest growth at 2.6%, but Barrick
down -9.5% yoy, Yamana declining -5.9%, and B2Gold facing the biggest
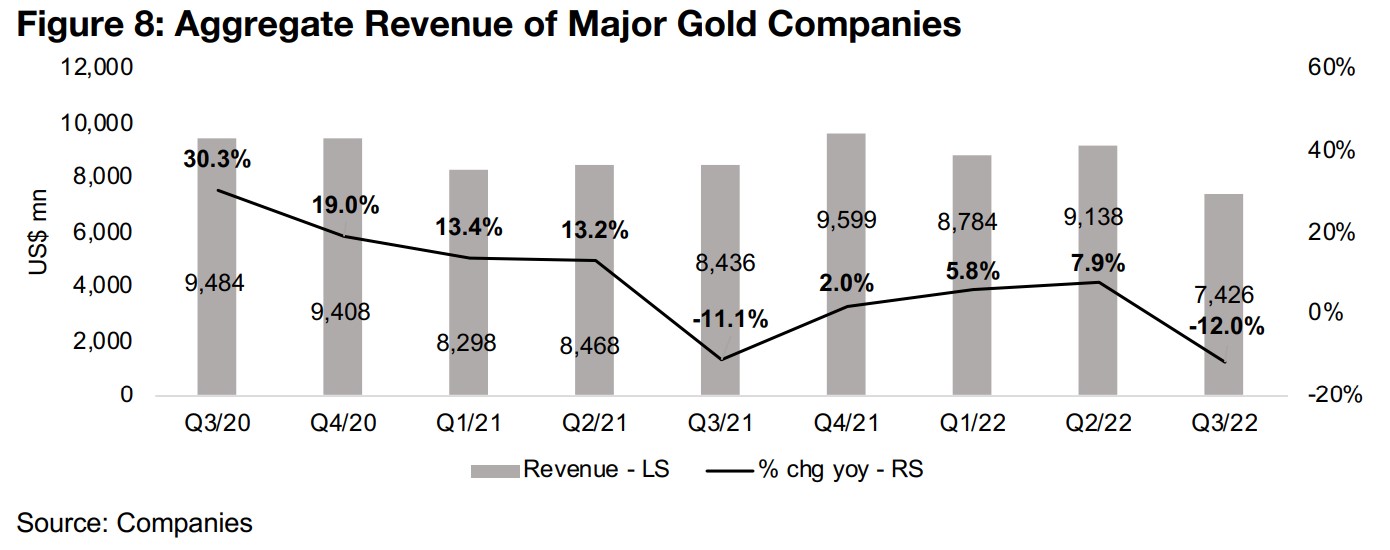
contraction, down -23.2% yoy (Figure 7). Aggregate revenue was down -12.0% yoy,
and has trended down consistently from the strong double digit growth of late 2020
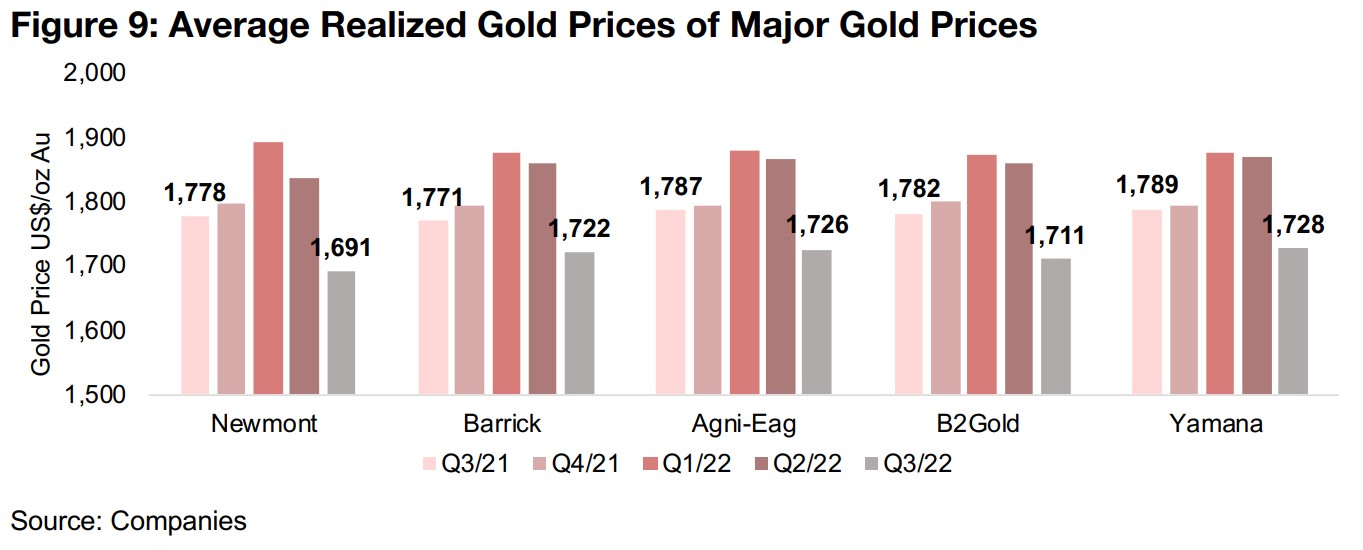
(Figure 8). This was driven by the major drop in the realized gold price yoy for all the
companies, with the gold price under pressure from Fed rate hikes (Figure 9).
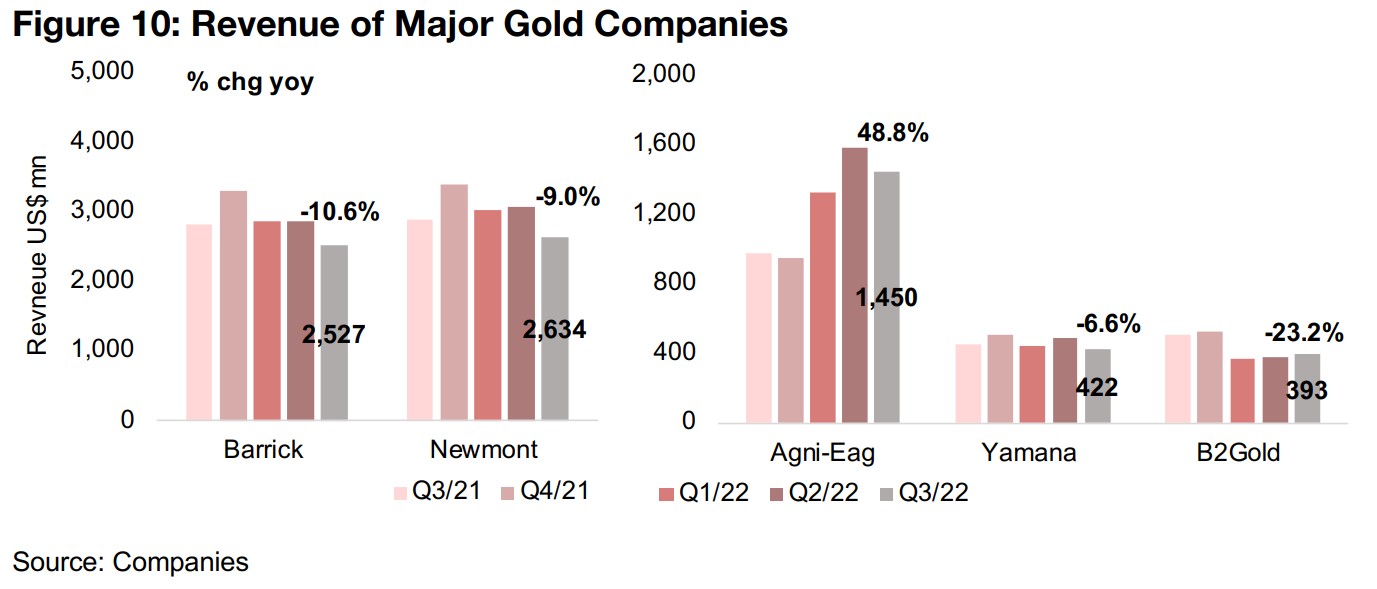
Agnico Eagle saw the only revenue growth of the group in Q3/22, up 48.8% on the
Kirkland Lake acquisition, and revenue growth for Newmont was down -9.0% as the
fall in average realized gold price offset its production rise (Figure 10). Revenue
growth for Barrick, Yamana and B2Gold fell -10.6%, -6.6% and -23.2%, respectively,
on both declines in production and the realized gold price.
Surge in AISC and fall in realized gold price to cost spread concerning
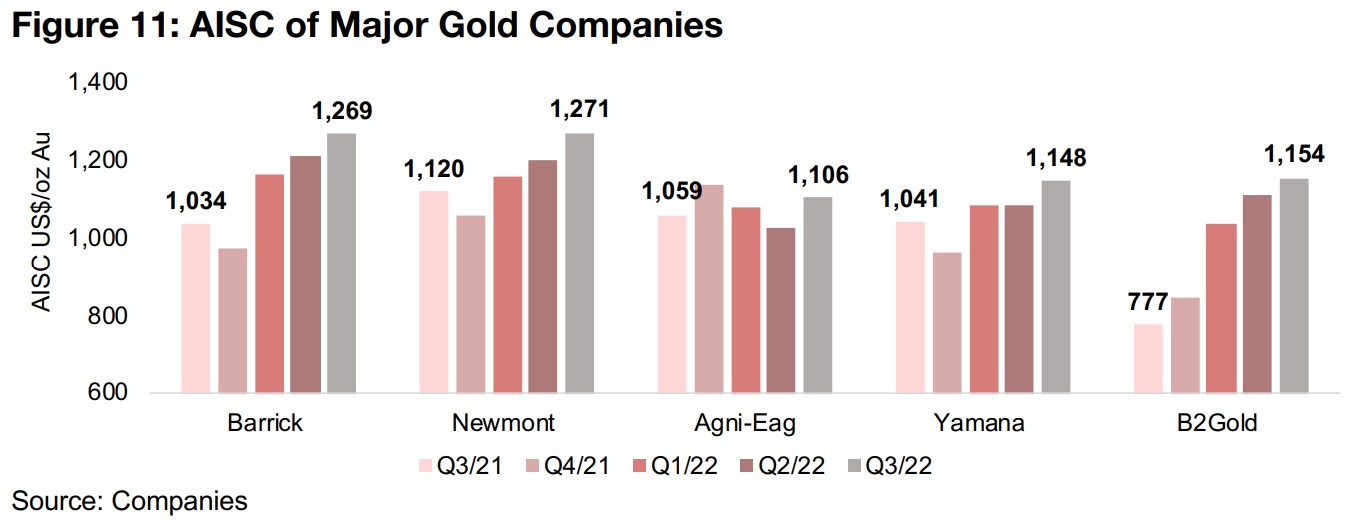
The effects of the surge in inflation this year are evident in the results, with a major
uptrend in the all-in-sustaining costs (AISC) for all the companies, with a significant
rise both qoq and yoy (Figure 11). For both Barrick and Newmont, AISC reached well
above US$1,250/oz, while Agnico Eagle saw only about a US$50 rise in costs yoy,
again driven by the acquisition of Kirkland Lake, given its relatively low AISC. Yamana
saw costs rise over US$100/oz yoy for the quarter and B2Gold has seen by far the
biggest surge in AISC. Although it was the lowest cost producer of the group in Q3/21
at just US$777/oz, its AISC has surged US$377/oz yoy to US$1,154/oz, considerably
ahead of both Yamana and B2Gold.
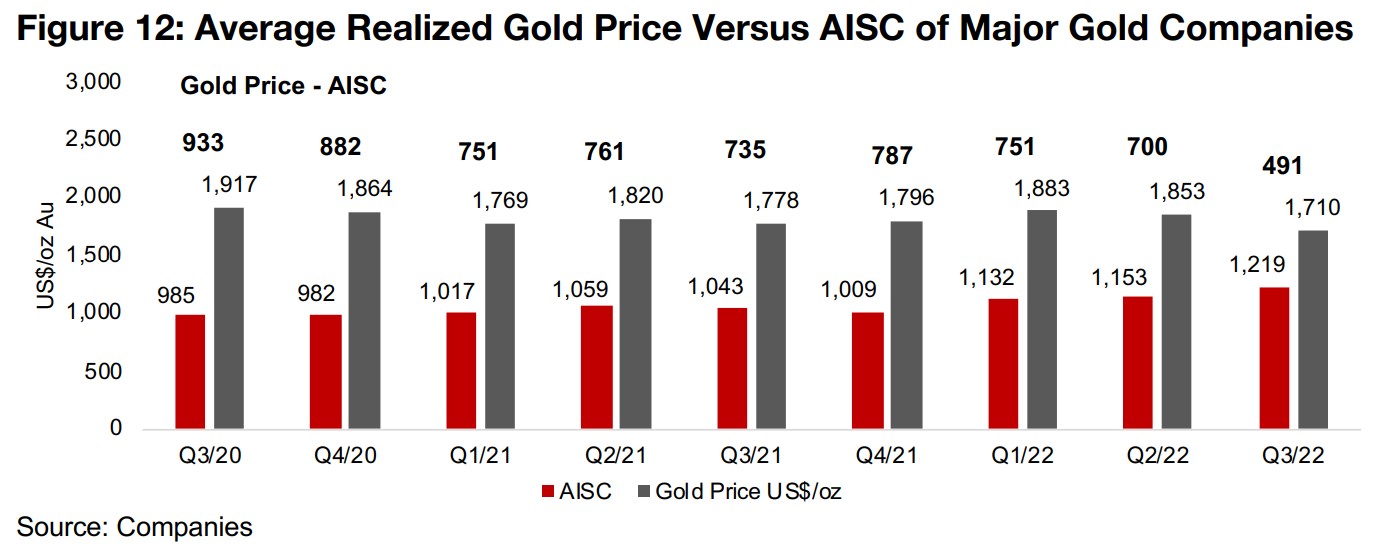
The decline in the average realized gold price and jump in the AISC for these
companies has led to a concerning decline in the realized spread between the two
figures for the group to the lowest level since the gold bull market began around the
second half of 2019. The spread has dropped to just US$491/oz after averaging well
above US$700/oz from Q1/21 to Q2/22 and over US$900/oz from Q3/20 to Q4/20,
and while still offering a decent margin for producers, is clearly not as fat as the past
few years (Figure 12).
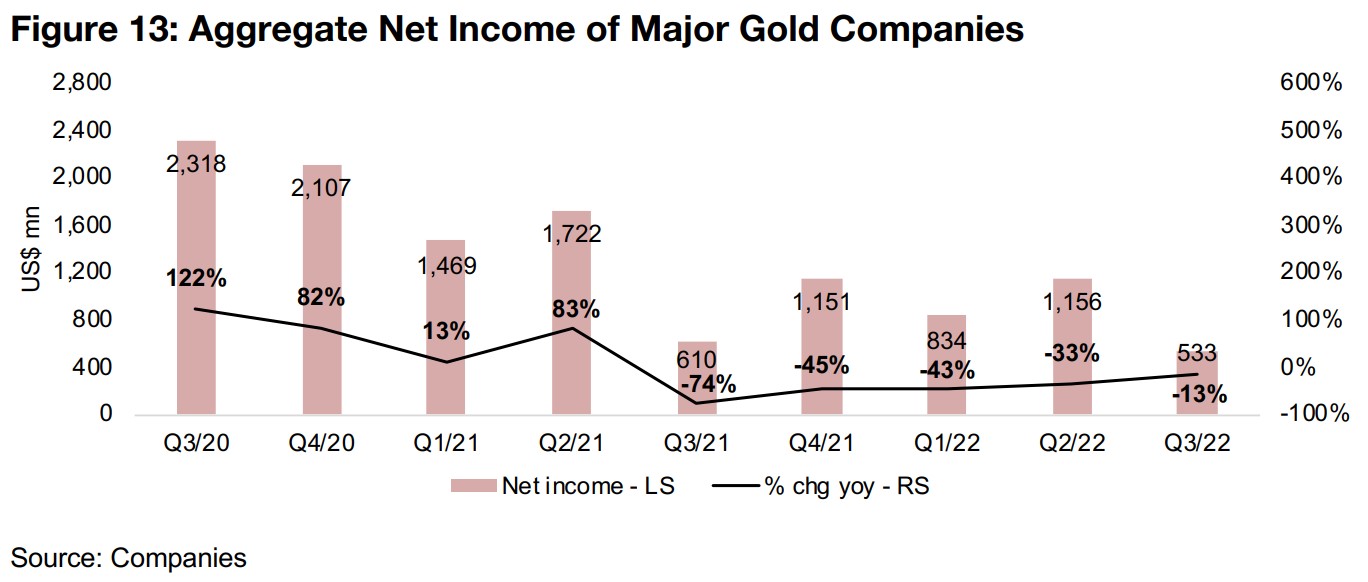
While net income will have also been hit by this decline in margin, the last several quarters of results for the companies have included major non-recurring expenses for companies in the group which have distorted the bottom line. Therefore while core net income growth will have come down in recent quarters, the extreme declines shown in Figure 13 will have been exaggerated by these extra items and mask a less severe reduction in growth in the core operations of the companies.
Share prices down on broader market weakness, muted earnings expectations
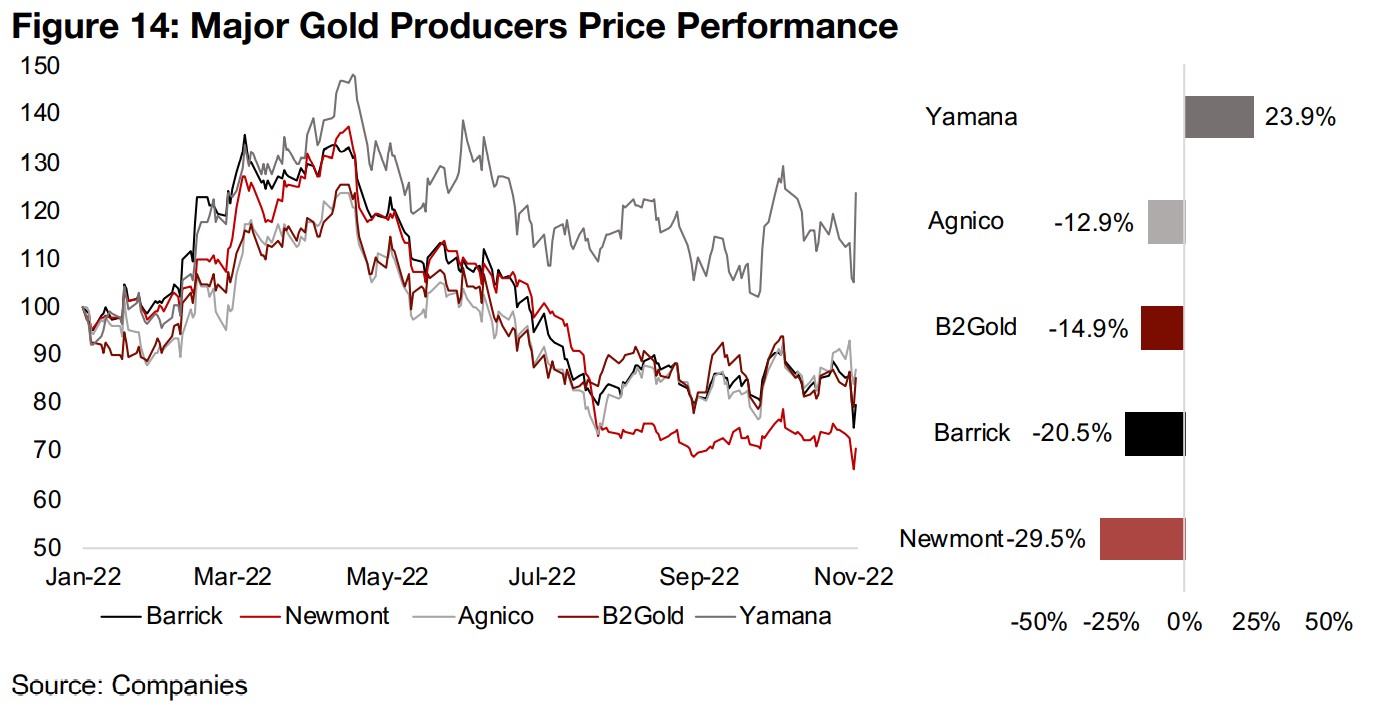
The share prices of the group have mostly declined this year as the falling gold price
and rising costs concern investors, but also because of the broader contraction in
equity market prices and valuations overall (Figure 14). The only company bucking
the trend is Yamana, which has been supported by a planned acquisition of the
company by Goldfields. With the majority of 2022 earnings now in, the market will
now be looking forward to 2023 in assessing the prospects for these companies, and
earnings are expected to weaken.
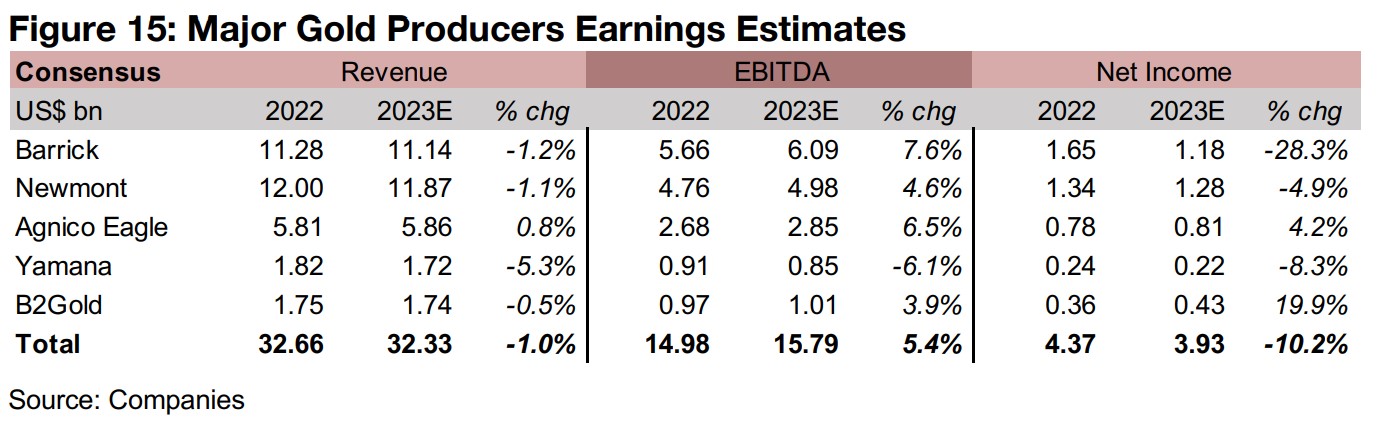
Aggregate revenue growth in 2023 is expected to edge down -1.0%, being bolstered
only by about two months of the Agnico Eagle 'Kirkland Lake acquisition effect'
(Figure 15). However, EBITDA (a measure of core earnings comprising operating profit
before depreciation, amortization, interest and taxes) is expected to rise 5.4%, with
analysts possibly forecasting a moderation in inflation driving a decline in costs.
However, net income is still expected to decline -10.2% for the group, especially
driven by a fall at Barrick.
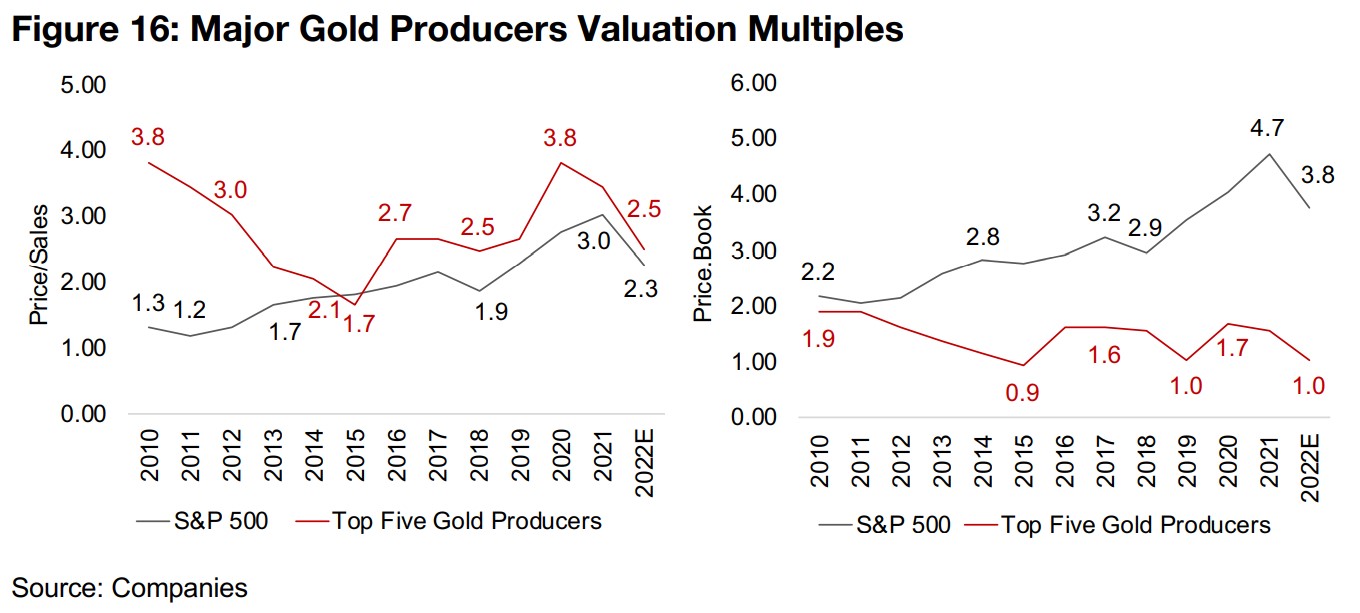
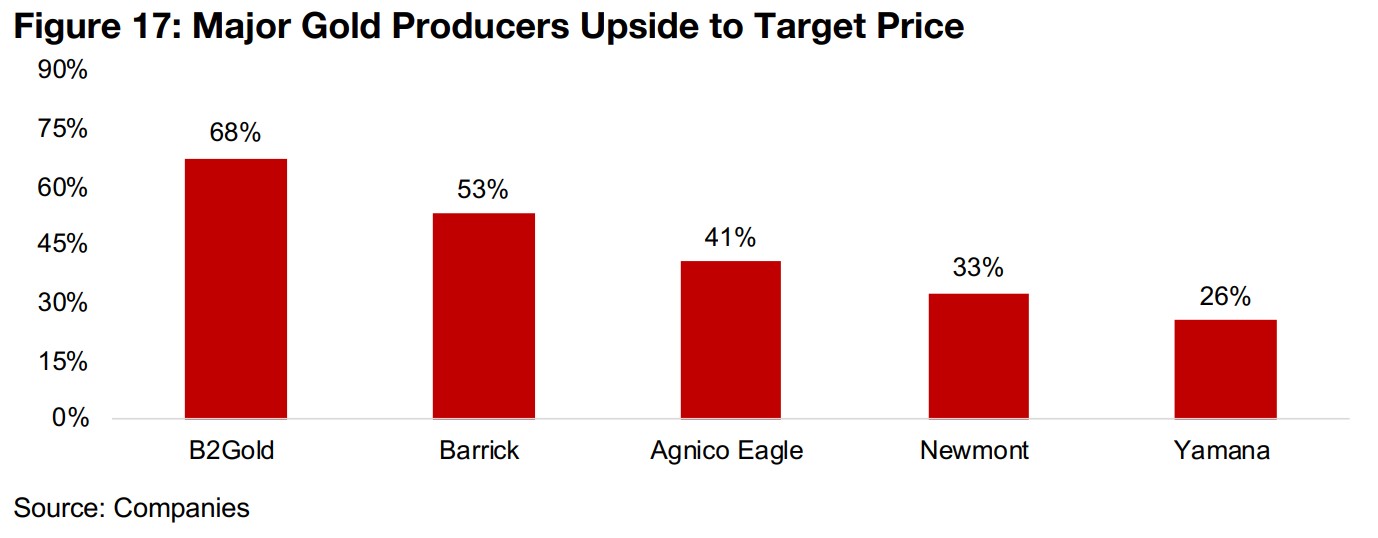
Valuations not excessive versus history, consensus seeing upside to targets
Looking at aggregate valuations for the group versus the S&P 500, the Price to Sales multiple for the gold companies is reasonably low versus its history at 2.5x, having only been lower over the past decade at the depths of the gold bear market in 2014 and 2015, and is almost inline with the S&P 500 at 2.3x (Figure 16). The group's price to book at 1.0x is near its 0.9x lows of 2015, and has seen a very wide gap develop versus the S&P over the past decade. On a 3.8x P/B the S&P 500 is still nearly four times the level of the gold companies even after a decline from a 4.7x peak in 2022. Analysts are still bullish on the group overall, with between 26% to 68% upside to consensus target prices (Figure 17)
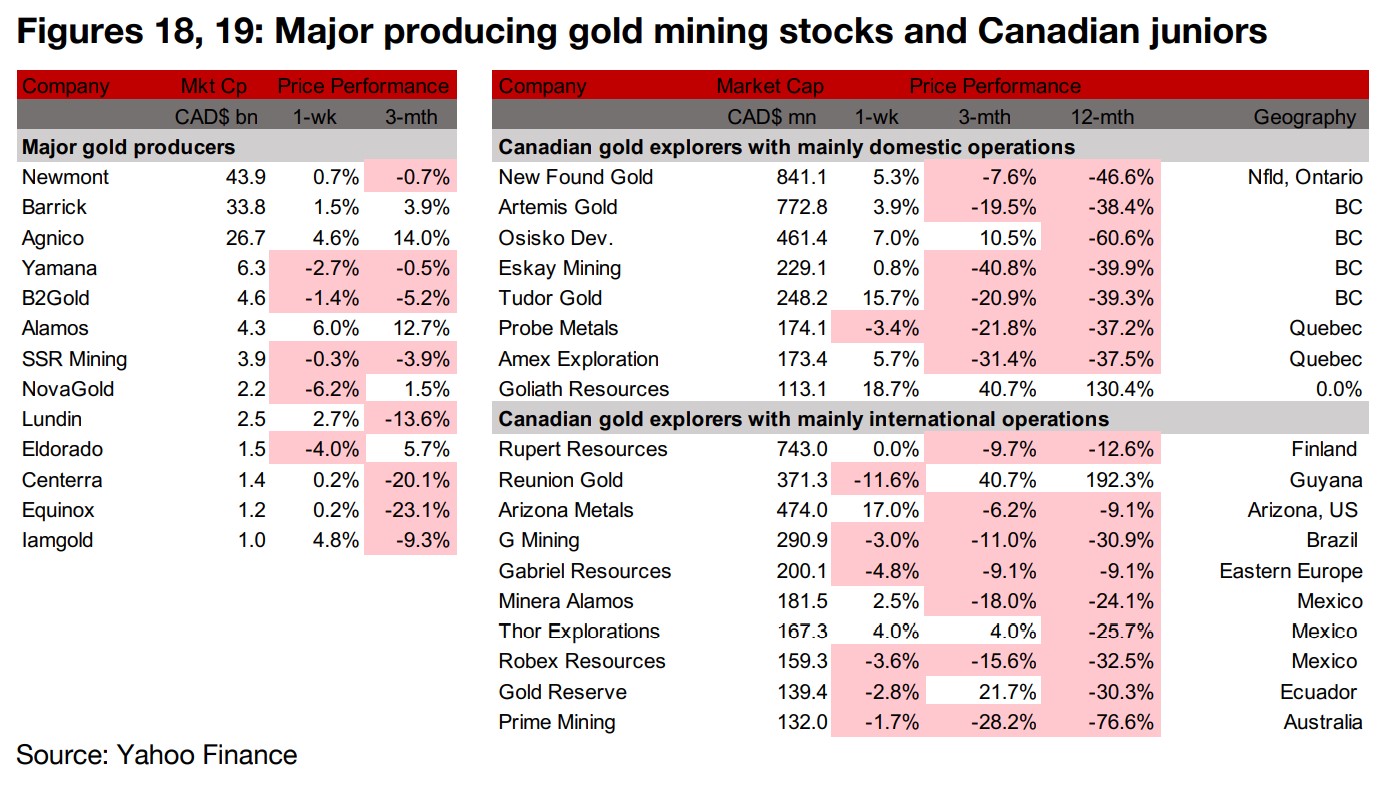
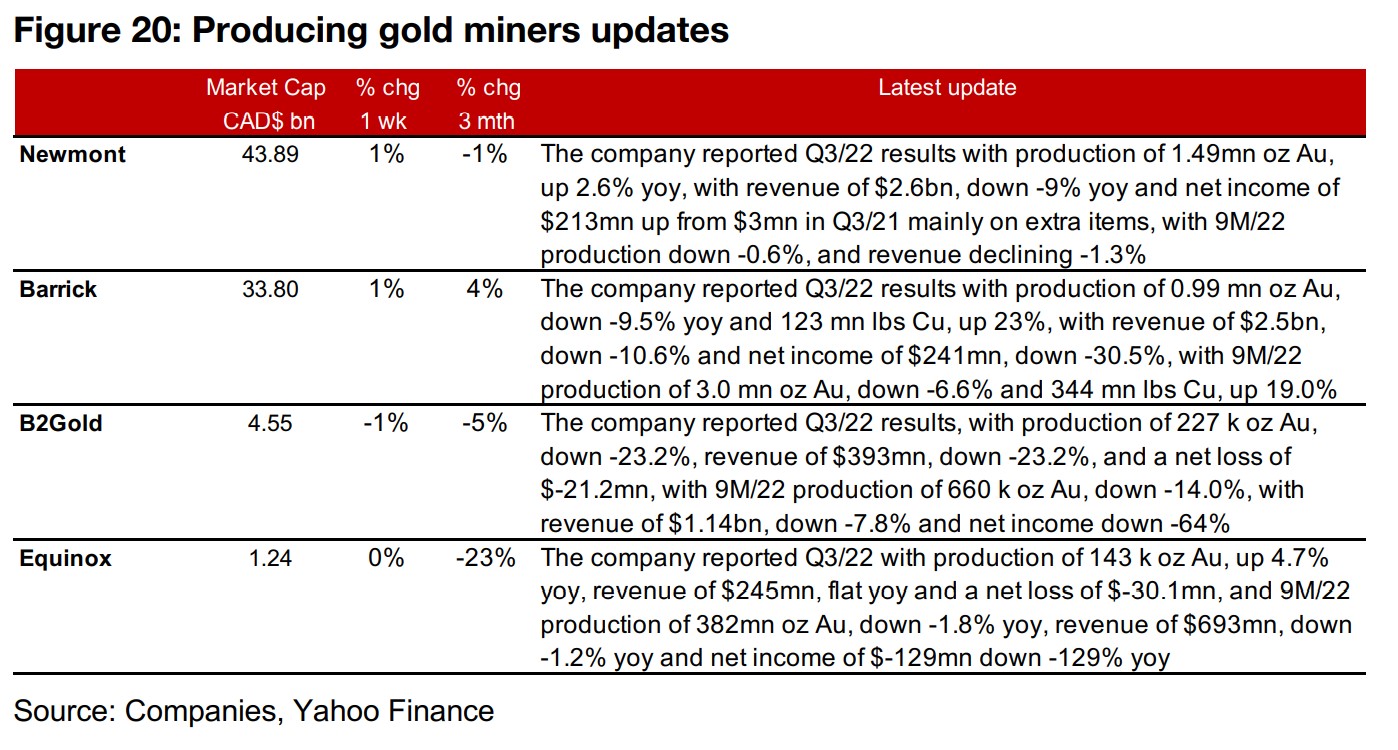
Producing and junior miners mixed after rollercoaster week
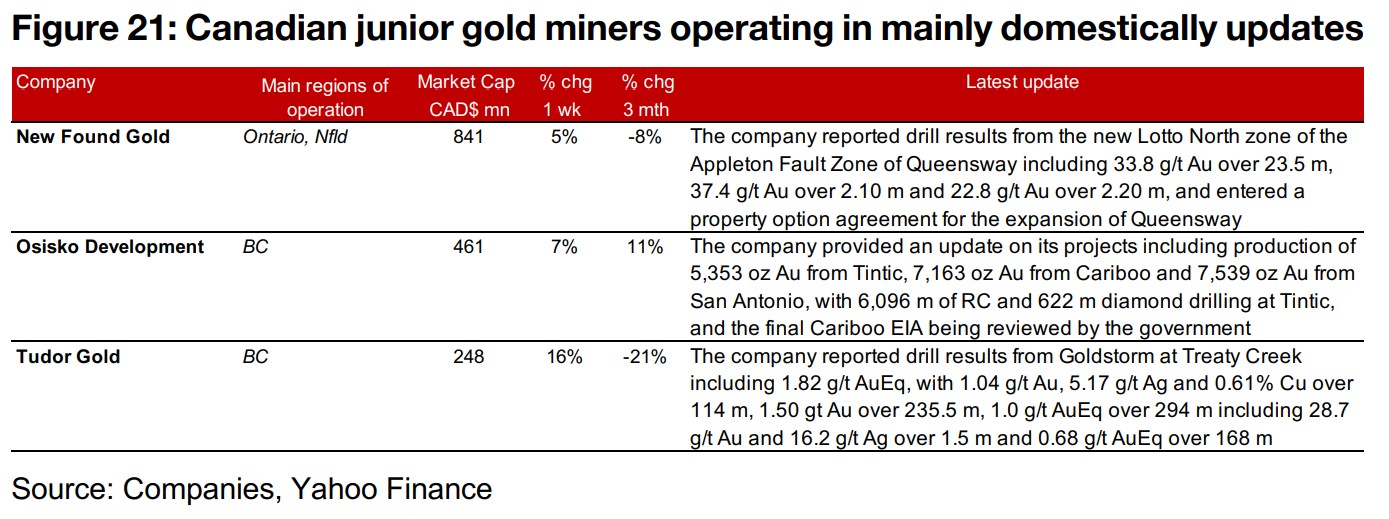
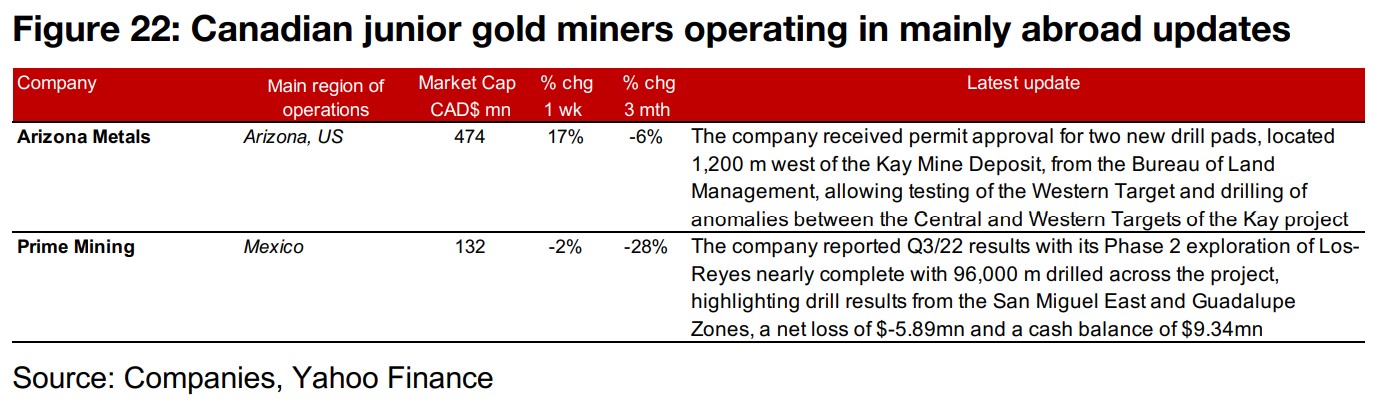
The producing gold miners and the larger TSXV gold juniors were mixed even as gold and equity markets rose (Figures 18, 19). News from the majors was focussed on Q3/22 results with Newmont, Barrick, B2Gold and Equinox all reporting (Figure 20). For the Canadian juniors operating mainly domestically, New Found Gold reported drill results from the new Lotto North Zone of Queensway and an entered a property option agreement to expand the project, Osisko reported an update including production levels at its three projects and Tudor Gold reported drill results from Goldstorm at Treaty Creek (Figure 21). For the Canadian juniors operating mainly domestically, Arizona Metals received permit approval for two new drill pads for the Kay Mine Project and Prime Mining reported its Q3/22 results (Figure 22).
Disclaimer: This report is for informational use only and should not be used an alternative to the financial and legal advice of a qualified professional in business planning and investment. We do not represent that forecasts in this report will lead to a specific outcome or result, and are not liable in the event of any business action taken in whole or in part as a result of the contents of this report.