September 30, 2024
The China Factor
Author - Ben McGregor
China has broad effect on gold market
China’s stimulus could drive up gold as it has a broad effect on the metal through several channels, including a large contribution to the global money supply and being the largest global consumer base for gold jewellery and a top central bank buyer.
Gold stocks edge down as China steals thunder
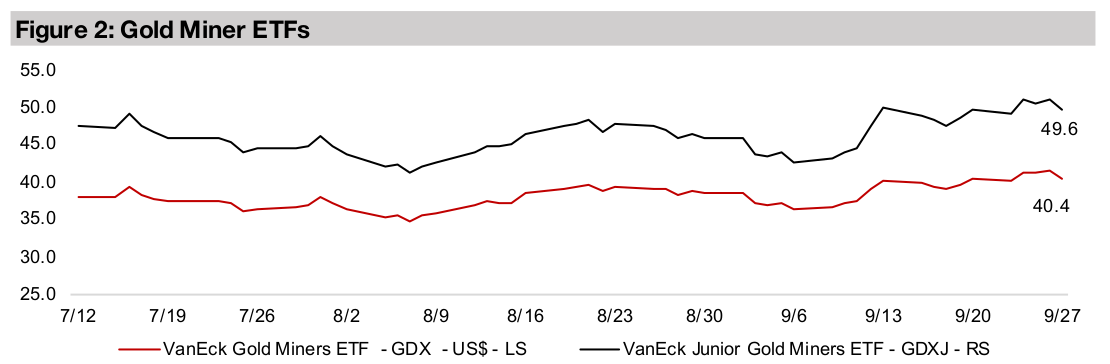
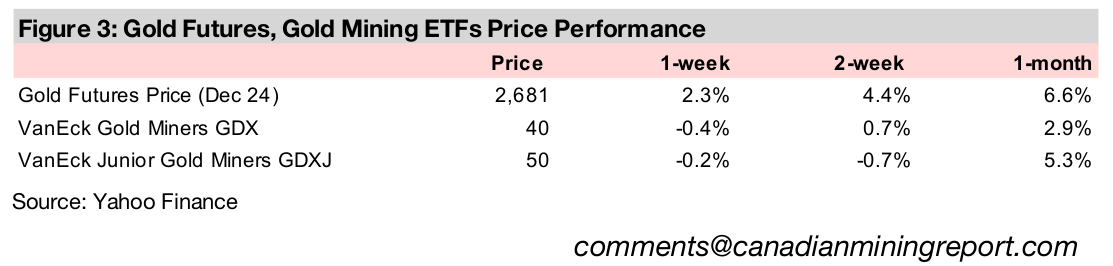
Gold stocks edged down, with the GDX dipping -0.4% and GDXJ -0.2%, even as the metal price and large cap equities rose with the S&P 500 and Nasdaq up 0.5% and 0.7%, likely because China’s equities stole some of the sector’s recent thunder.


The China Factor
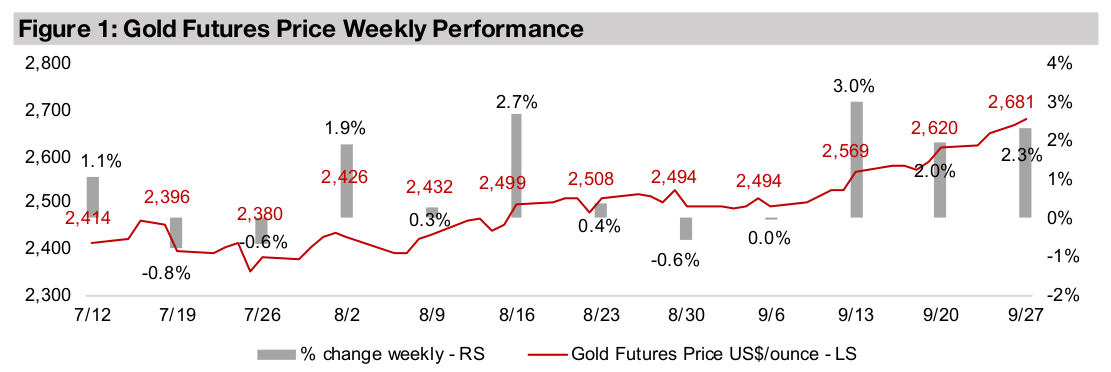
The gold price continued to surge, briefly rising as high as US$2,710/oz, which saw
it nearly US$100/oz above its US$2,611/oz close last week, before pulling back to
close up 2.3% at US$2,681/oz. This move was driven mainly by a huge stimulus from
China to revive its flagging economy and equity and property markets. Gold stocks
actually edged down, with the GDX dipping -0.2% and GDXJ down -0.4%, even as
the metal and large cap equities gained with the S&P 500 up 0.5% and Nasdaq 0.7%,
although small caps pulled back with the Russell 2000 down -0.3%.
While gold’s increasingly parabolic move again raises the question of whether a
bubble is forming, we see plenty of drivers remaining in full swing, with probably the
most important being the global return to easier monetary policy. While this started
earlier this year with the Swiss and European Central Banks, it was kicked into
overdrive this month by the two largest economies, the US and China. More short-
term, the metal continues to benefit from a weakening US$ and lower real yields, both
of which tend to move inversely to gold, as well as heightened political risk.
Some indicators that are slightly bearish for gold are the metal’s ratios to some key
commodities, including copper, silver, platinum, oil, and the broader CRB
commodities index. These ratios have mostly risen moderately above medium-term
averages, implying relative overvaluation for gold. However, we see as much of a
chance that these other commodities rise given the huge monetary stimulus, as gold
declines, to bring these ratios more back in balance. Overall, we expect the upside
from the core monetary expansion driver will far overshadow these elevated ratios,
and believe that if gold is in a bubble, it is still in a relatively early phase.
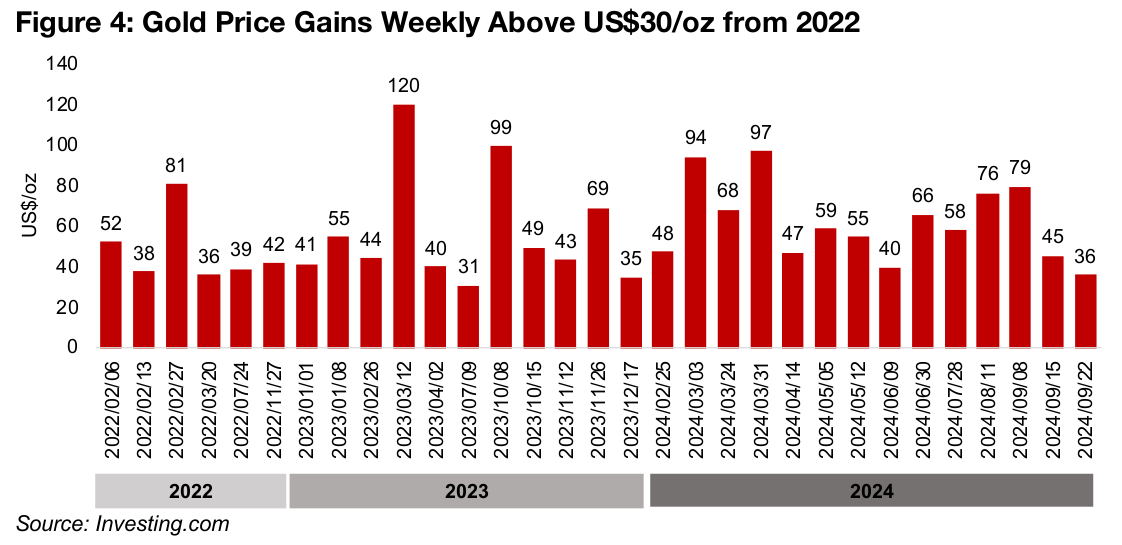
A weekly move for gold of near US$100/oz is also not actually that rare over the past
three years, having occurred four times since 2020, and this week gold closed up
only US$36/oz, which has occurred over twenty times in the last two years (Figure 4).
Also, the absolute moves of 2022 and 2023, and even early 2024, are not actually
entirely comparable with recent gains, as the gold price is much higher, and the
US$ gains are less significant in percentage terms.
China’s stimulus included a reduction in mortgage lending rates, a decline in the
required reserves for banks, allowing them to make more loans, and lower limits on
borrowing to invest in the equities markets. The stock market in the country reacted
extremely well to this, with the MSCI China Index rocketing up 26.1% from recent
lows on September 10, 2024 through to September 27, 2024 (Figure 5). This took it
from the lowest performer versus MSCI World, S&P 500 and Russell 2000, as of
September 10, 2024, to the best, with an 28.4% gain year to date.
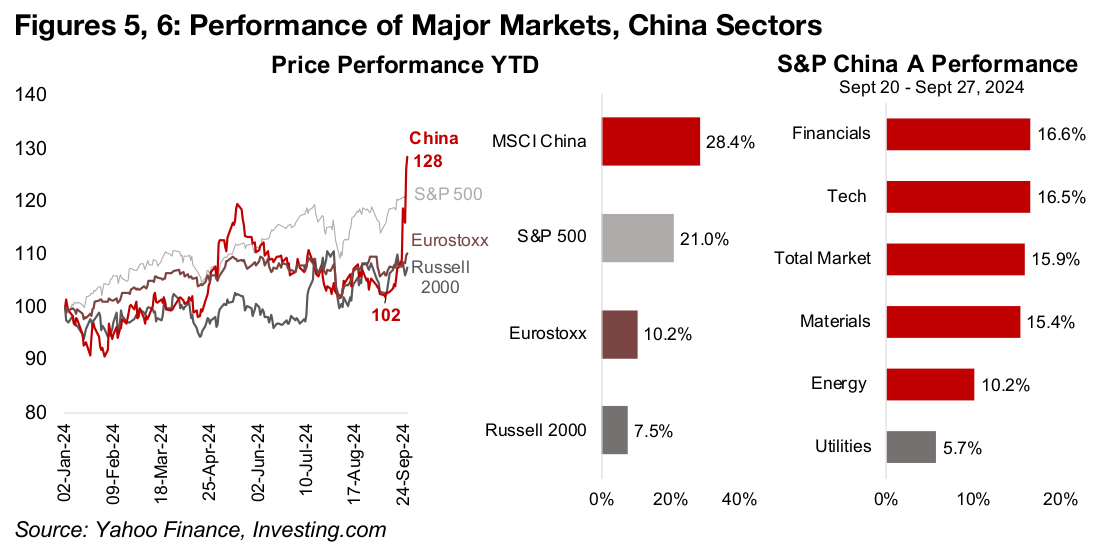
The move could almost be viewed as too extreme, however, with such a gain not
really the hallmark of a bull market, which tends to have a more steady, gradual
ascent. Its shows that markets are still on edge, and there were debates about how
effective the measures would be for China long-term. It was interesting that while
more cyclical sectors in China clearly outperformed, up by over 15.0%, the market
still kept buying the most defensive of sectors, utilities, which rose nearly 6.0%
(Figure 6). This implied that markets in China were still hedging the huge risk-on move
to some degree. This is similar to what has been seen in the major US markets this
year, and has a read across for another safe haven, gold. We expect markets to
continue to remain cautious into 2025 and maintain positions in safer assets, and that
the current outlook is very far from the heavy risk-on sentiment of 2021-2022.
China plays a huge role in global gold demand, and the stimulus could further boost
already strong gold buying in the country from both consumers and the central bank.
It also has a major effect across the metals space, especially for iron ore, mainly for
use in steel production, as it accounts for the majority of global demand for both. Iron
ore has been far the worst performing major metal this year, down over -30%, mainly
on the slowdown in China construction. Rising steel production in China also could
boost other smaller metals like nickel and zinc which are used in its production.
China is a huge contributor to global money supply
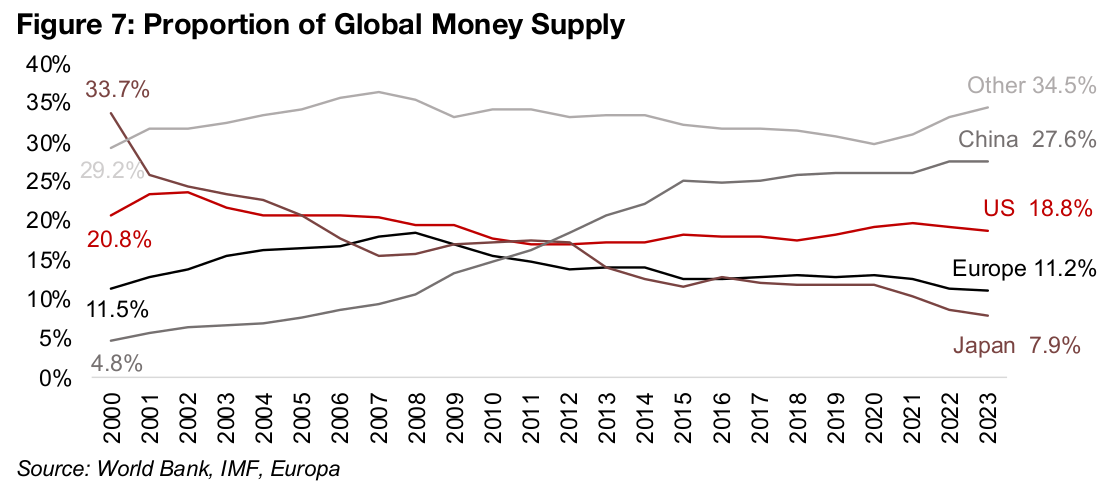
With monetary expansion probably the key driver of gold long-term, China now plays
a significant role in this factor, as it now accounts for the largest proportion of the
global money supply, at 27.6%, having risen from 4.8% of the total in 2000. This puts
its considerably ahead of the US, at 18.8% and Europe, at 11.2%, with their
proportions remaining relatively steady since 2000, and Japan, at 7.9%, which has
declined from 33.7% in 2000 (Figure 7). The contribution from the rest of the world to
the global money supply has increased moderately to 34.5% from 29.2% in 2000.
The value of the global gold stock has tended towards a reasonably consistent
percentage of the total money supply and suggests that as there is monetary
expansion the gold stock value will increase to roughly maintain this ratio, and vice
versa. This will mainly be through moves in the gold price, as changes in the physical
gold stock are very small, averaging about 2.0% per year. The ratio of the global
money stock value to the global money supply averaged 7.9% from 1985 to 2023,
ranging between 4.2% to 12.1%. However, over the past ten years, there has been
much less variance, with an average of 9.0%, ranging from 8.3% to 9.8%, the level
in 2023. While the ratio is relatively high currently, we could see it come down given
that the US and China now appear to be fully onboard for monetary expansion.
China’s money supply is so large that its expansion can have major spillover stimulative effects for the entire world, which is also the case for the US and the EU. This occurred in the mid-2010s when the US and the EU were starting to ease off stimulus programs, but China came through with significant rate cuts and stimulus, which supported not only its own economy and markets, but those in the US and EU. With all three of these huge economies now boosting their monetary bases in tandem, it seems very likely that a rise in the value of the gold stock, to maintain the market’s preferred ratio between the metal and fiat currencies, could follow.
China is largest source of gold jewellery demand
China is also the largest source of consumer gold demand, accounting for 42.1% of the total from 2022 to Q2/24, with India second at 33.5% (Figure 8). While this consumer demand is much less of a major driver for gold than the increase in global money supply, it can still have some effect on the price. This demand could be viewed as actually monetary in nature to a degree, as jewellery is often held in these countries as a store of value.
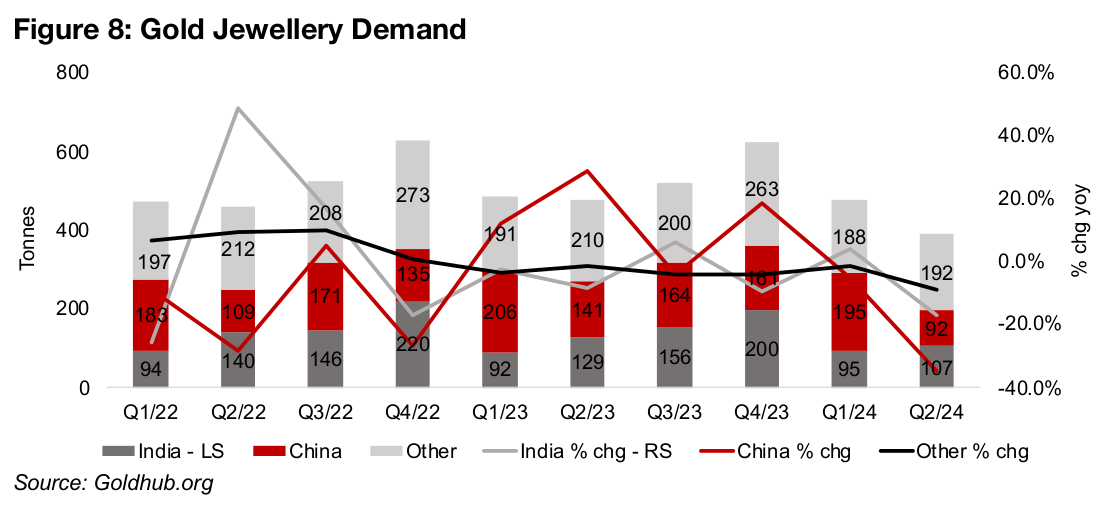
Gold jewellery demand slumped for both countries in Q2/24, down -34.5% yoy for China and -17.5% for India, the weakest growth for both countries since H1/20, and indicating that consumers there were under some financial pressure. While this weakness may well have persisted in China into Q3/24, especially given the worsening outlook for the housing market over the period, there is some chance that the stimulus revives demand in Q4/24. This would especially be the case if consumers in China maintain with a relatively cautious outlook, where they may increase expenditure, but at the same time want to purchase goods that could maintain value over time. Overall, however, we would expect that this driver will have much less of an effect on the gold price than the major drivers like the global monetary expansion and central bank gold purchases.
China the second highest central bank gold buyer
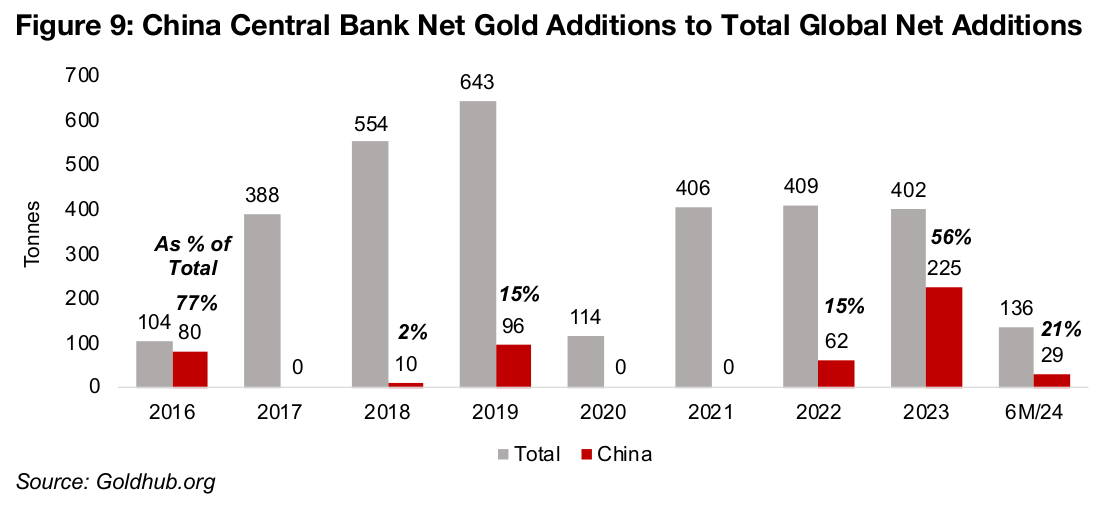
China has been one of the largest sources of central bank gold demand, especially
in recent years, comprising 21% of net buying over H1/24, 56% of the total in 2023
and 15% in 2022. It was also a large net gold buyer in 2019, at 15% of the total, and
2016, at 77%, and made smaller purchases in 2018, at 2% of the total (Figure 9).
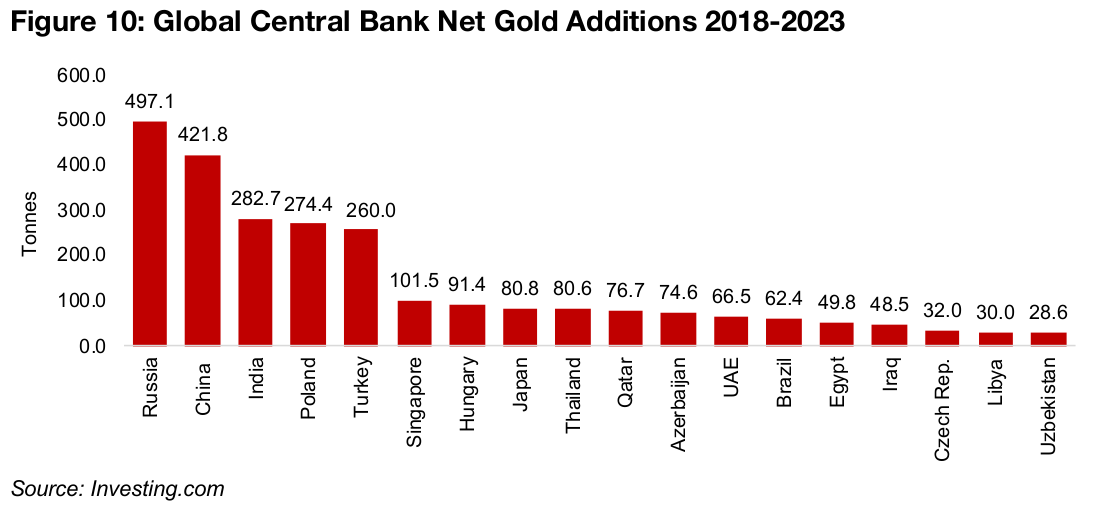
Overall from 2018 to 2023, China central bank was the second largest net gold buyer,
at 421.8 tonnes, second only to Russia, at 497.1 tonnes, with India, Poland and
Turkey the other leading purchasers, with each below 300.0 tonnes (Figure 10). The
other major gold buyers were all at 100.0 tonnes or below for the period.
With the gold price still rocketing we believe that central banks will be likely to hold
onto their gold for now and look to unload, if at all, at much higher prices. Also, many
central banks may not want to divest of their gold holdings at all as currency regimes
that have been around since the 1970s are starting to come in question. This includes
the strengthening of BRICs economies and the potential for diversification away from
the US$ over the next few decades. Such a huge shift is not without risks, including
the potential for hyperinflation of longstanding global reserve currencies, and gold
could be held as a hedge against such outcomes.
While central bank gold buying has slowed a bit this year, it could still reach net
additions near 300 tonnes, based on 136 tonnes of purchases over H1/24. This
compares to just over 400 tonnes in each of 2021, 2022 and 2023, and would mark
the sixteenth straight year of net central bank buying. Prior to 2009, there had been
considerable net gold selling by major central banks for several years. However, the
financial crisis starting in 2008 shifted the stance of central banks especially in
emerging economies to backing up their financial systems with more gold and relying
less on fiat currencies, including the US$, for its reserves.
China’s gold holdings to central bank reserves still low
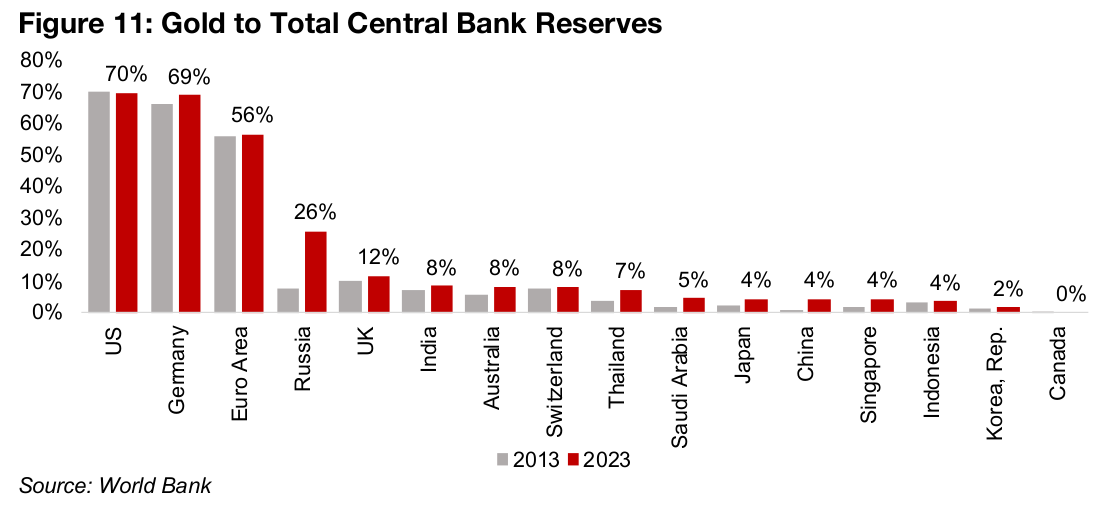
While China’s gold holdings to its total central bank reserves have quadrupled over the past decade, they is still small in percentage terms, at just 4% in 2023, compared to 1% in 2013 (Figure 11). Russia, in contrast, has seen gold jump to 26% of its reserves from 8% in 2013, and the highest levels by far are for the US and Germany, at 70% and 69%. This shows that there is substantial room for continued central bank buying of gold especially from new global economic leaders like China and India, before they come even close to what could be viewed as a maximum ratio. Canada interestingly has zero gold in its central bank reserves, likely in part because it has substantial physical gold reserves, the seventh highest globally, that can be extracted should the need arise to increase the central bank’s physical gold holdings.
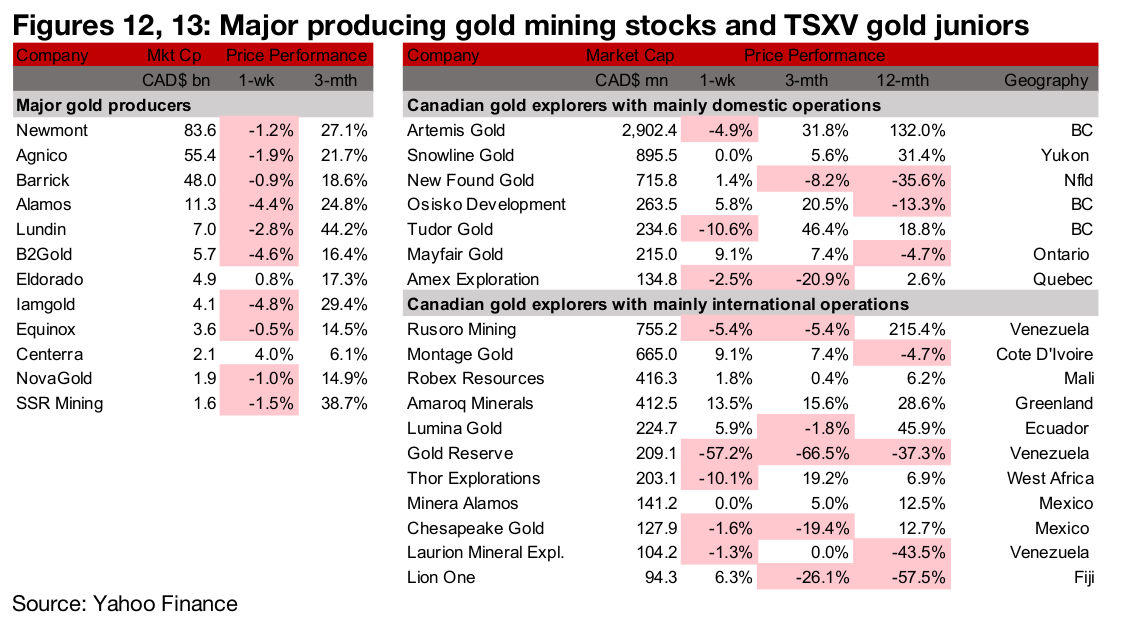
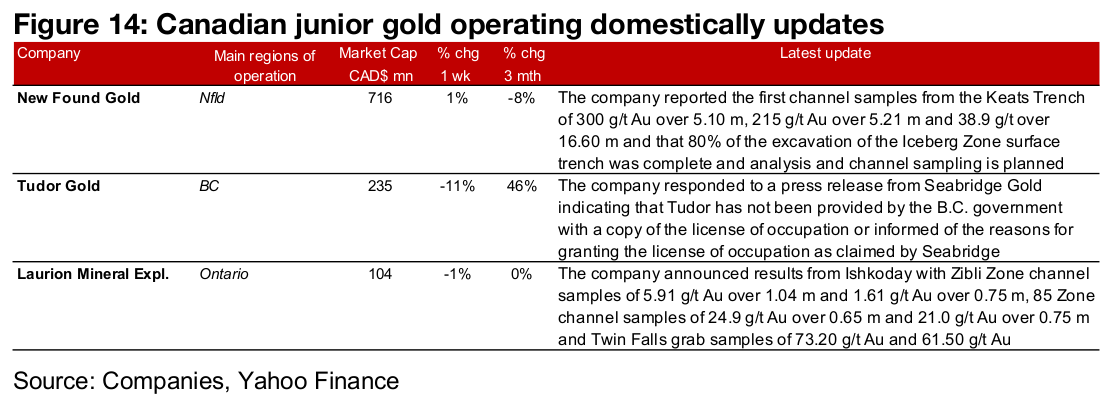
Major gold producers mainly down, TSXV large gold mixed
Most of the major gold producers declined and the TSXV large gold was mixed (Figures 12, 13). For the TSXV gold companies operating domestically, New Found Gold announced channel samples from the Keats Trench and that 80% of the Iceberg Zone surface trench has been completed, Tudor Gold responded to a press release from Seabridge and Laurion reported grab and channel samples from Ishkoday (Figure 14). For the TSXV gold companies operating internationally, there were no major press releases.
Disclaimer: This report is for informational use only and should not be used an alternative to the financial and legal advice of a qualified professional in business planning and investment. We do not represent that forecasts in this report will lead to a specific outcome or result, and are not liable in the event of any business action taken in whole or in part as a result of the contents of this report.