February 12, 2024
Tech Euphoria Tarnishes Metals Stocks
Author - Ben McGregor
Gold flat as strong Q4/23 earnings continue
Gold was flat, up just 0.1% to US$2,039/oz, with the markets continuing their risk on move as the fourth quarter 2023 earnings season has been strong, although overall support for metal has not lost steam this year, with no days below US$2,000/oz.


Tech Euphoria Tarnishes Metals Stocks
The gold price was flat this week, up just 0.1% to US$2,039/oz, as a shift to risk on
in markets continued with a reasonably strong fourth quarter 2023 earnings season
continuing and macroeconomic news flow quiet. All the major US markets saw strong
gains, with the tech-heavy Nasdaq up 2.4%, the broader large cap S&P 500 index
rising 1.4% and small cap Russell 2000 gaining 2.98%. The big gain especially for
small caps shows the market taking on risk beyond just the mega cap tech boom,
which has especially been the driver of US markets over the past year.
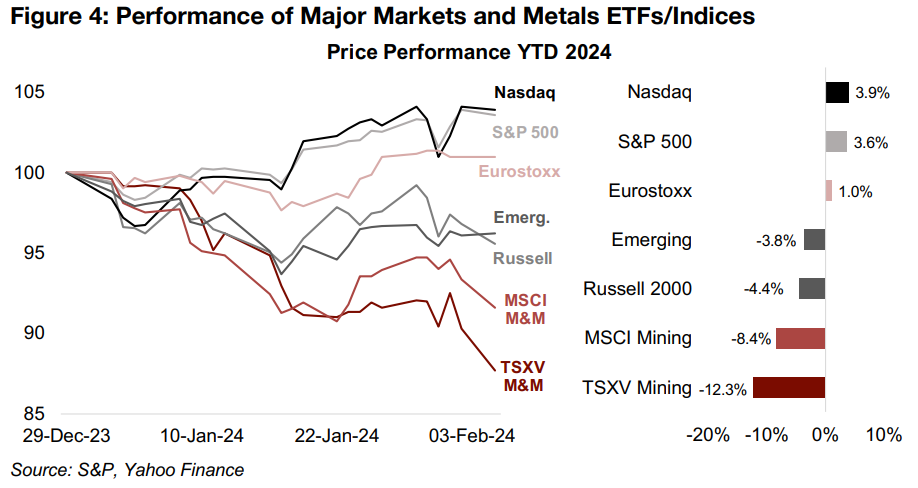
This shift into US tech has continued year-to-date, with the Nasdaq up 3.9% in 2024,
with the handful of megacap cap tech stocks driving its gains also propelling most of
the 3.6% rise in the S&P 500 (Figure 4). While small caps picked up this week, they
are still lagging since the start of the year, with the Russell 2000 index down -4.4%.
The aggressive move into US tech has continued to come at the expense of the
mining sector, with the MSCI Global Metals & Mining ETF down -8.4% this year.
However, this tech euphoria has not only tarnished the performance of the mining
sector, with European stocks just eking out gains this year, with the Eurostoxx 600
up 1.0% and Emerging Markets down -3.8%. This broader pressure on both small
caps and the mining sector, as well as weakness in several metals weighted heavily
in the TSXV, especially lithium, has hit the S&P/TSXV Metals & Mining Index
particularly hard, with a -12.3% slide so far this year.
US equity valuations heading towards previous peaks
This unchecked rise of US tech has driven valuations to exorbitant levels versus the
rest of market and looks increasingly unsustainable, and we are seeing more
comparisons of the situation to the tech bubble of 1990-2000 and subsequent crash.
The current bubble is certainly not as irrational as that period, as most of the gains
are in established companies with a strong earnings history, whereas many
companies during the dot.com bubble had no earnings and shaky business models.
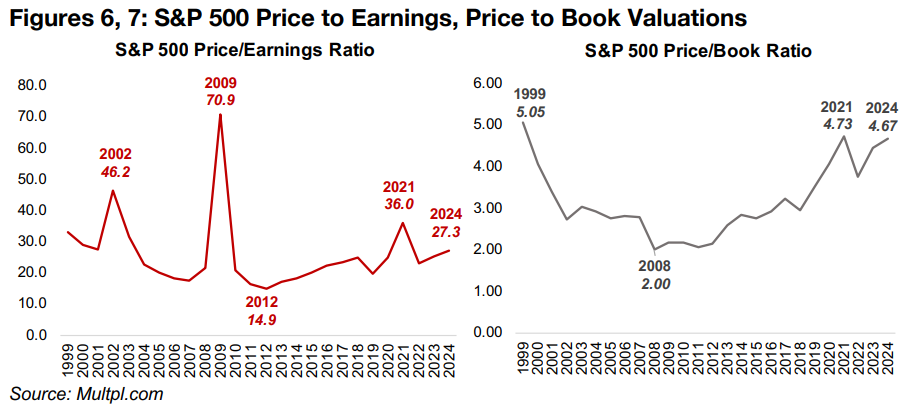
However, the current S&P 500 price to earnings multiple at 27.3x is still the fourth
highest in nearly 150 years (Figure 6). The highest was at 70.9x as earnings collapsed
during the global financial crisis, the second in 2002 at 46.2x as the dot.com bubble
burst and the third highest during the global health crisis rebound in 2021, at 36.0x.
The S&P 500 price to book valuation, at 4.67x, is also very high currently, nearly back
at its 2021 peak of 4.73x and heading towards the dot.com highs of 5.05x in 1999
(Figure 7).
US tech valuations see huge spread with rest of market
The price to book (P/B) ratios of sector and market ETFs demonstrate just how much
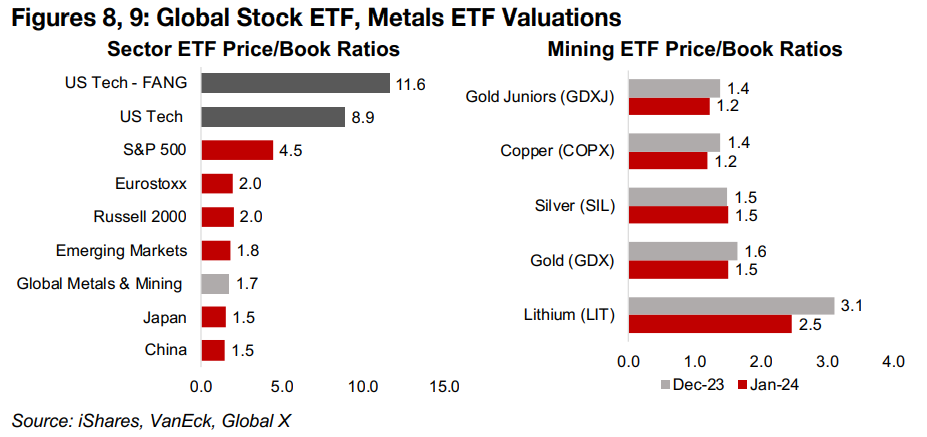
US mega-cap tech has gotten ahead of the global markets. The price to book of the
US FANG-plus ETF, which comprises ten of the largest US tech stocks, including
Meta (Facebook), Apple, Netflix and Alphabet (Google), is at 11.6x, with the US tech
sector overall at 8.9x (Figure 8). The big weighting of these tech stocks in the S&P
500 has also been the main cause of its elevated 4.5x price to book multiple.
Even just this S&P 500 multiple, which is much lower than for tech, is over twice the
level of US small caps, with the Russell 2000 at 2.0x, and the rest of the major global
markets, with European stocks at 2.0x, Emerging markets at 1.8x and Japan and
China both at 1.5x. This indicates that apart from the outlier of US tech, global
valuations are actually relatively modest. Considering these other regions also makes
the price to book for Global Metals & Mining, which looks extremely low in the context
of US tech, appear quite reasonable. It is not necessarily the case that global mining
is strongly undervalued, as much as US tech is probably severely overvalued.
Several mining sector valuations already exceptionally low
For some of the individual mining sectors, however, valuations are looking low, even
in this broader global context. Mining P/Bs have also come down further over the
past month, while for US tech they have likely risen, widening an already huge gap.
The P/B for both the GDXJ ETF of junior gold miners and COPX ETF of copper miners
have declined to 1.2x from 1.4x at the end of 2023 (Figure 9). The P/B of the SIL silver
producers ETF and GDX gold producers ETF are 1.5x, with the former flat and latter
down from 1.6x, with the largest drop from the LIT lithium ETF, to 2.5x from 3.1x.
The big question now becomes whether the US tech to global mining valuation gap
contracts through a major pullback in the former, a rebound in the latter, or some
combination of both. If the junior gold and producing copper ETFs decline much
further, they will approach P/Bs of just 1.0x, with anything below 1.0x usually
considered inexpensive for stocks not in financial distress. With the gold price robust,
up 1.0% this year, and the copper price struggling slightly, with a -5.7% drop, these
sectors are hardly in crisis. We suspect that a lot of bad news has been priced into
mining already, while large cap US tech remains priced for near perfection. A reversal
in sentiment on both sectors seems possible this year.
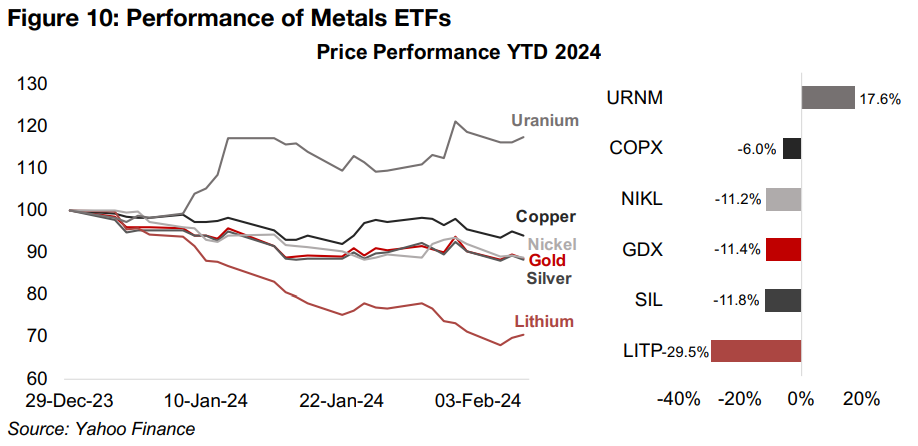
The declines in valuations for these mining ETFs appear to have been mainly driven by declines in their prices, with book values tending to change more slowly. The COPX lost -6.0% year to date, the nickel miner ETF NICKL is down -11.2%, the SIL has declined -11.8% and the lithium miner ETF LITP has slumped -29.5% as their respective metals have dropped this year (Figure 10). However, the GDX is down a significant -11.4% even as the gold price has edged up, with the market apparently expecting that the metal will not hold, suggesting to us the probability of yet another year of underestimation. The market is significantly less cautious on uranium, the only metal clearly in a clear upswing so far this year, with the price jumping 9.5%, driving up the uranium ETF URNM 17.6%.
TSXV large cap gold up even as sector ETFs struggle
Interestingly, the pressure we are seeing on both the gold sector overall and TSXV
Index is not evident in the performance of the large cap TSXV gold stocks this year.
Of the top ten market cap TSXV gold and silver stocks (Figure 11), seven are up, half
have risen 15% or more, and only one stock is down more than -5.0% (Figure 12).
With just this group comprising about 15% percent of the total market cap of the
TSXV mining sector, if there is any major downward pressure on the TSXV coming
from gold or silver stocks, it must be from the mid to smaller cap names in aggregate.
The two largest stocks, Artemis and G Mining are up 14.8% and 30.6%, respectively,
as they are already in construction on their major projects, and therefore substantially
derisked, in a market that has become more cautious on earlier stage companies.
Three of the biggest gainers, Rusoro, Gabriel, and Gold Reserve, up 60.0%, 32.6%
and 15.6% this year, respectively, do not even have large active projects, and have
instead been stuck for years in arbitration over past projects, Rusoro and Gold
Reserve in Venezuela, and Gabriel in Romania. As arbitrations have come nearer to
completion, the potential for large arbitral awards has started to be priced in.
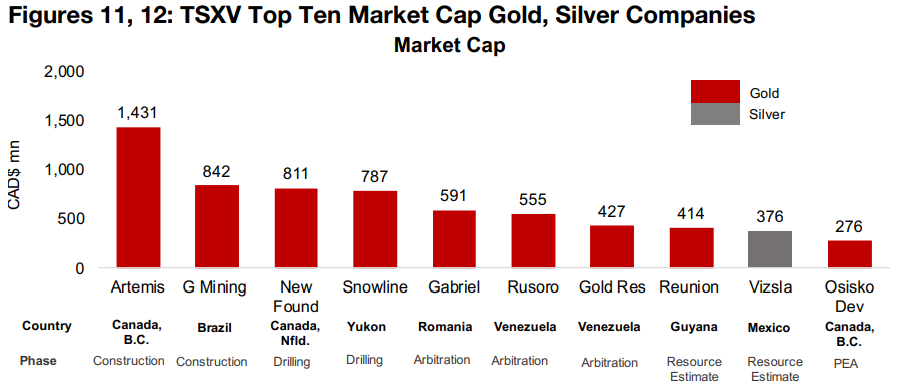
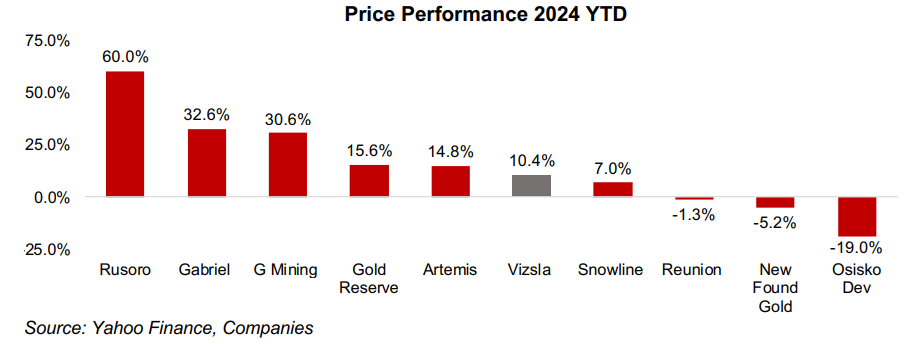
The performance of the two earlier stage, pre-Resource Estimate stage explorers has been mixed, with Snowline up 7.0% and New Found Gold down -5.2%, given a more risk averse market. Reunion Gold, which released an Initial Resource Estimate for its flagship project in Guyana last year, has been near flat, down -1.3%, partly because of escalating political tensions between the country and Venezuela. Developer Osisko Development has seen the weakest performance, down -19.0%, as it is still a year from production at its Feasibility Study-stage Cariboo project. There is one large cap silver stock, Vizsla, up 10.4% on a Resource Estimate upgrade for its main project.
Lithium slide a major factor in TSXV decline this year
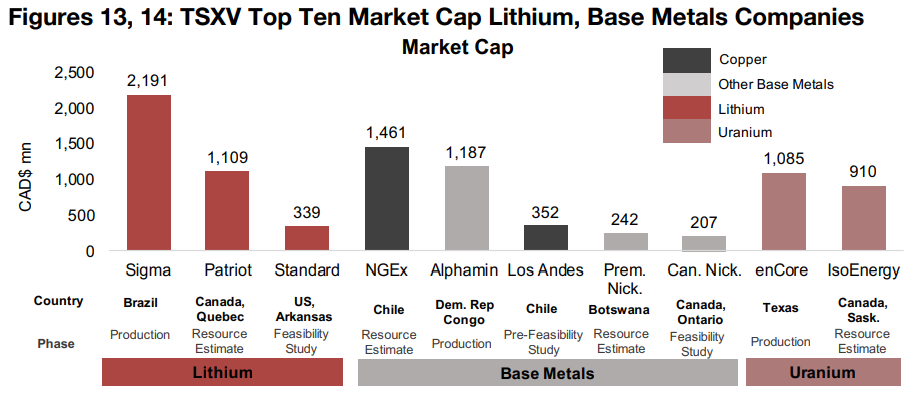
The large cap lithium sector has been a major factor in the decline of the TSXV Index this year, with just the top three stocks alone, Sigma Lithium, Patriot Battery Metals and Standard Lithium, comprising 16% percent of the total TSXV mining sector market cap, with the giant Sigma at 12% (Figure 13). Therefore the -25.2%, -25.8%, and -50.9% plunges in Patriot, Standard and Sigma have had an outsized effect on the performance of the index (Figure 14).
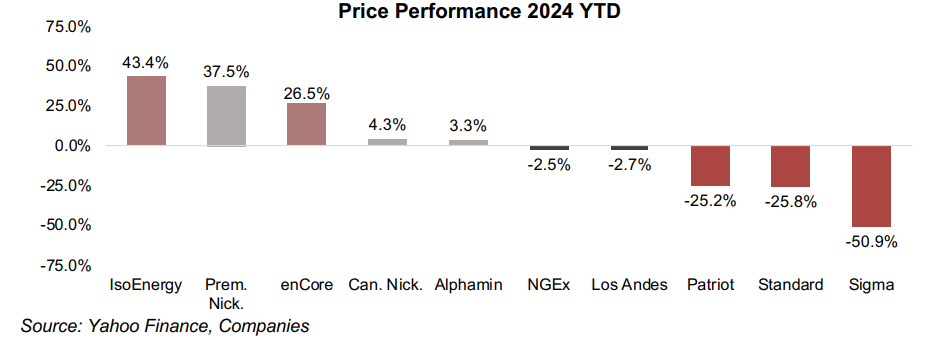
The performance of the TSXV large cap base metals have been more flat overall, with tin producer Alphamin up 3.3%, and the two copper stocks, NGEx and Los Andes, down -2.5% and -2.7%, respectively, as the tin price has gained and copper price declined this year. The nickel stocks have been mixed, but both have gained even as their underlying metal price has declined, with Canada Nickel up just 4.3% but Premium Nickel jumping 37.5%. The other outliers to the upside have been the uranium stocks, driven by a continued surge in their metal price, with enCore up 26.5% and IsoEnergy rising 43.4%, the largest gain of the group.
Gold producers mixed and large TSXV gold mostly up
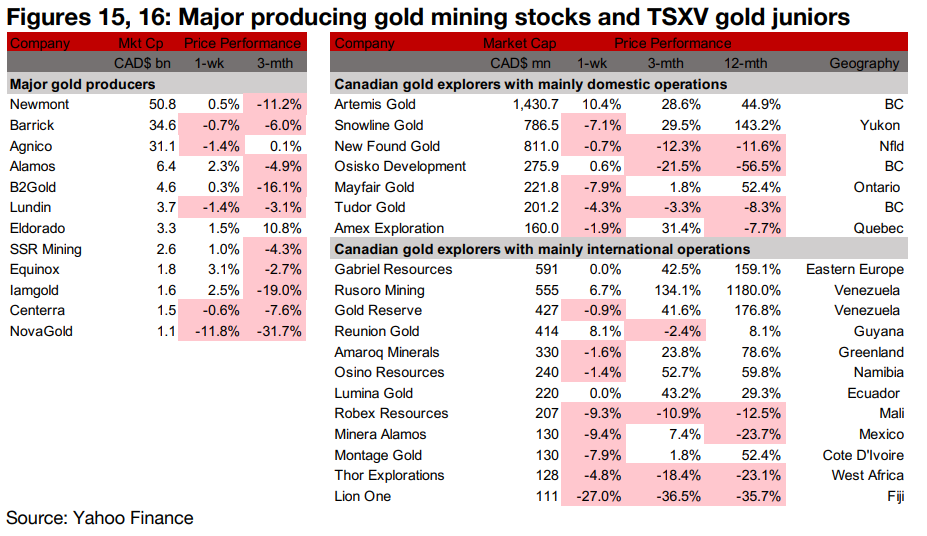
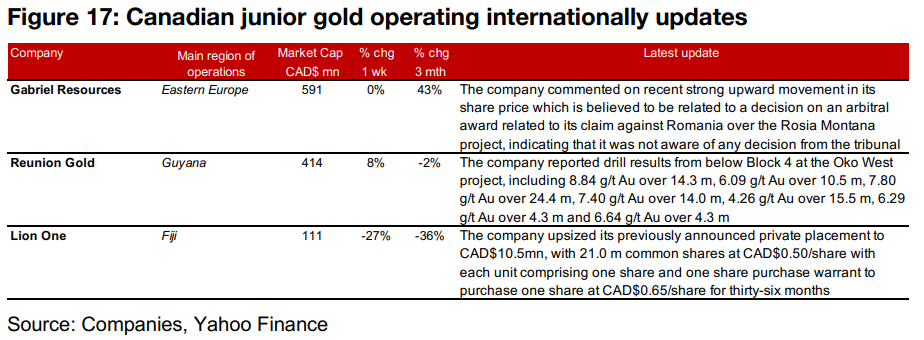
The gold producers were mixed and large TSXV gold mostly gained (Figures 15, 16). For the TSXV gold companies operating domestically, there was no major news flow, For TSXV gold companies operating internationally, Gabriel Resources commented that it was not aware of any news on an arbitral award believed to be driving up its share price, Reunion Gold reported drill results from under Block 4 at Oko West, and Lion One upsized it previously announced private placement to CAD$10.5mn (Figure 17).
Disclaimer: This report is for informational use only and should not be used an alternative to the financial and legal advice of a qualified professional in business planning and investment. We do not represent that forecasts in this report will lead to a specific outcome or result, and are not liable in the event of any business action taken in whole or in part as a result of the contents of this report.


