July 17, 2020
Sustaining a week above US$1,800/oz
Author - Ben McGregor
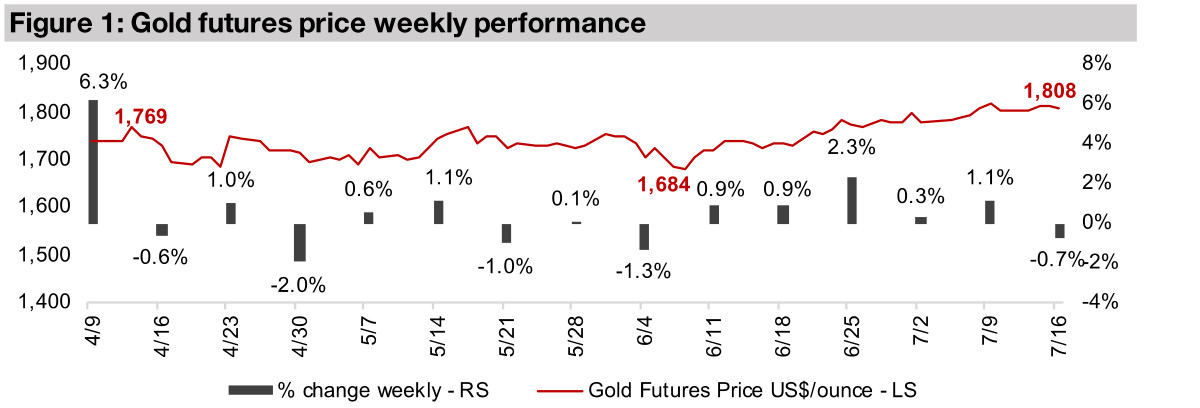
Gold futures holds above US$1,800 for a whole week
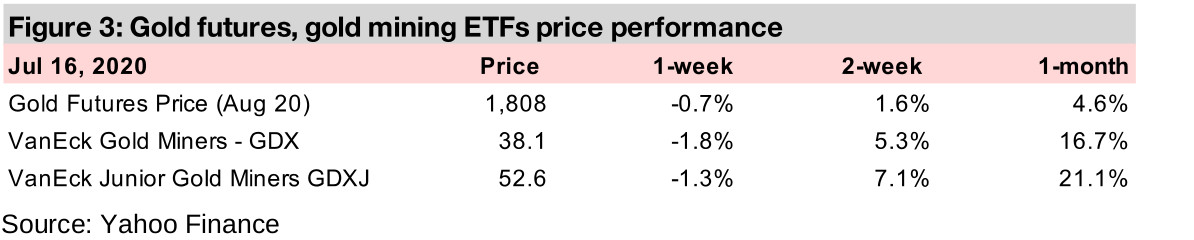
The gold futures price was sustained above US$1,800/oz for an entire week for the first time in nine years this week, although it ticked down for the week by -0.7% to US$1,808/oz.
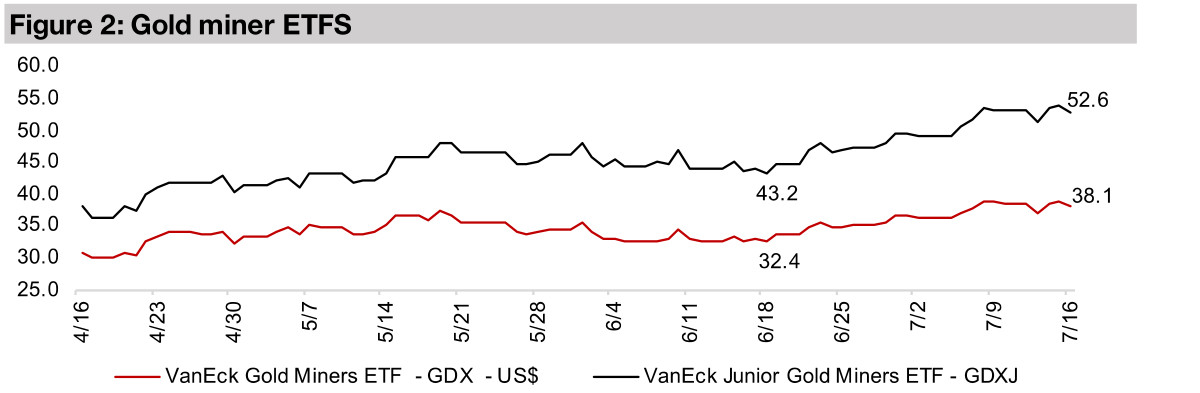
Producing miners mostly down on profit taking
The producing gold miners declined this week, with the GDX falling -1.8%, and most of the major Canadian miners down, with the market possibly viewing US$1,800/oz as a resistance level and anticipating a potential pullback.
Canadian junior miners mostly down after strong run
The junior miners also declined, with the GDXJ down -1.3%, and nearly all of the larger Canadian junior gold mining stocks pulling back; Val-D'or operating Probe Metals, in Focus this week, saw a relatively small decline versus the group.


Considering the leverage effect of the gold price on junior miners
The gold futures price held above US$1,800/oz for the entire whole week, the first time it has done so in nine years, and closed down -0.7% for the week at US$1,808/oz. However, we saw a considerable across the board pullback in the gold miners this week, possibly as investors take profits in anticipation of resistance above the US$1,800/oz level for gold, with the GDX down -1.8% for the week and the GDXJ falling -1.3%. While the gold price remains the number one driver for junior gold mining stocks, the movement of gold and these junior stocks can diverge considerably, as shown in last two gold bull markets, in 2009-2012 and in 2019-2020, using GDXJ as a proxy (Figures 4, 5). One of the main reasons for this is because gold miners are leveraged to the gold price. For producing miners, after a certain cost hurdle is reached, a given percentage increase in gold leads to a much higher percentage gain in profits. This concept carries over to the junior miners; although they generally have negative margins and no revenue, there is an implied margin for these stocks, based on them eventually finding and bringing a resource into production.
Figures 4, 5: GDXJ versus gold, 2019-2020 and 2009-2012
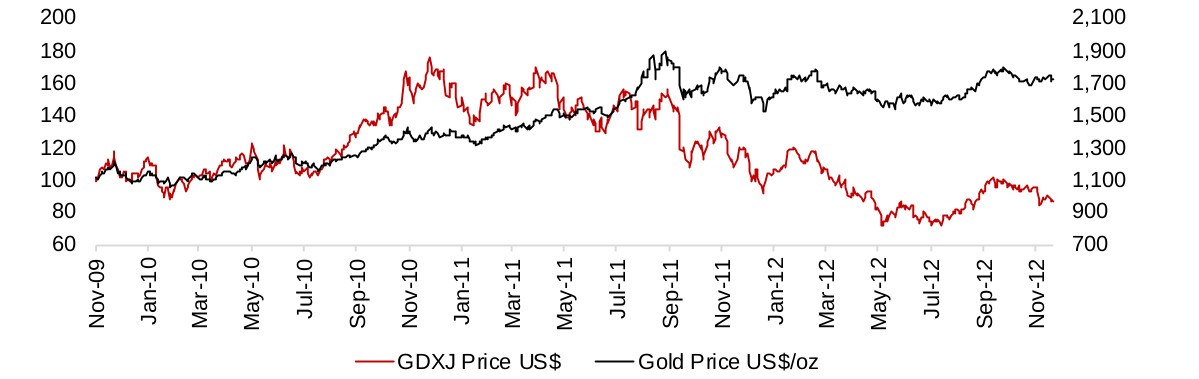
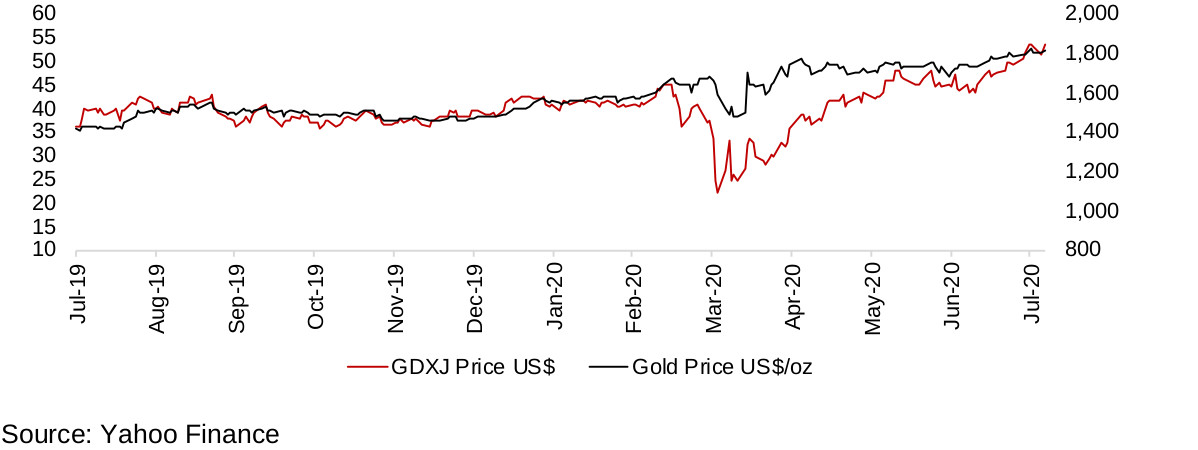
We can see an example of this effect at the start of the 2009 bull market (Figure 4). Here the GDXJ roughly tracks the rise in gold until around mid-2010, when the price of gold starts to move considerably above unit production costs for gold. At this point implied potential margins for these junior miners surge, and so does the GDXJ. The same effect goes into reverse in late 2011, when a certain percentage decline in the gold price drives a much larger pullback in the GDXJ.
So far in the 2019-2020 bull market we have not seen the rise in the gold price well above unit production costs drive a surge in the GDXJ well above the rise in gold, if we track the price from July 2019 (Figure 7). However, this may have occurred if we had not had the global health crisis, as the market crash, in addition to seeing a drop in gold, also added concerns about junior miners accessing capital and their ability to continue exploration. However, since April the recovery in the GDXJ has outpaced the recovery in gold considerably, and we are just reaching the point where the GDXJ's 12-month performance looks about to overtake gold's. If gold continues to hold above US$1,800/oz, we may see a similar dynamic to 2010, with the leverage effect starting to take hold and GDXJ's performance shooting ahead of the gold price.
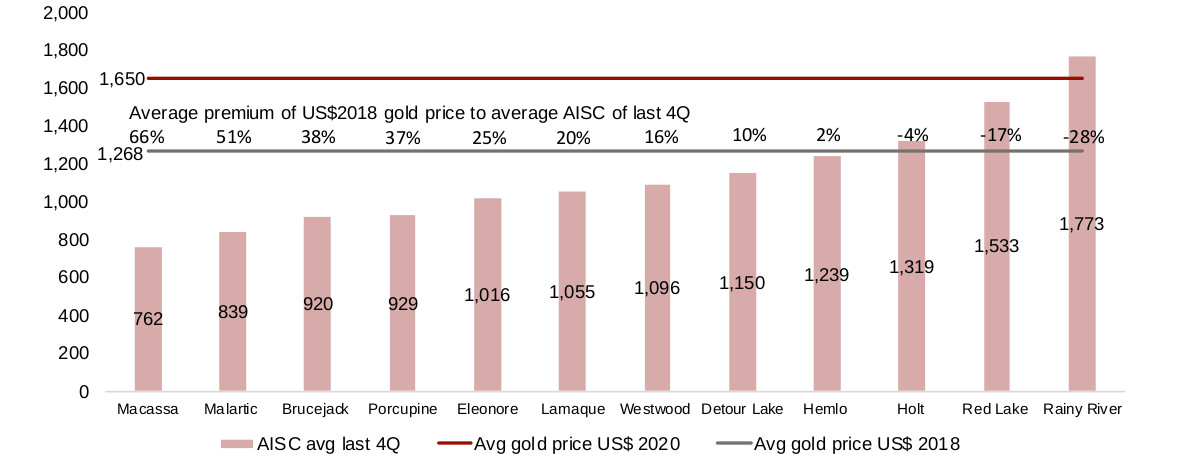
Figures 6, 7: Canadian producing mine AISC to average gold price
Gold price rises to point where most major mines profitable
We can see this leverage effect for gold miners shown in Figures 6 and 7, using the largest Canadian mines as examples. Even if gold holds consistently at just its average so far this year of US$1,650, most major Canadian producing mines would be profitable, and this could be enough to drive a very strong period for the juniors. This is because the high profitability for the producing mines will supply them with significantly more cash flow that they will need to invest, and this could take the form of increasing investments in junior miners. Also, the rising potential profitability will also likely encourage investment from beyond the mining industry. This will increase the potential for new finds, in turn drawing in even more capital, which is critical for junior miners, many of which operate only with enough cash to fund their expenditures of year of less.
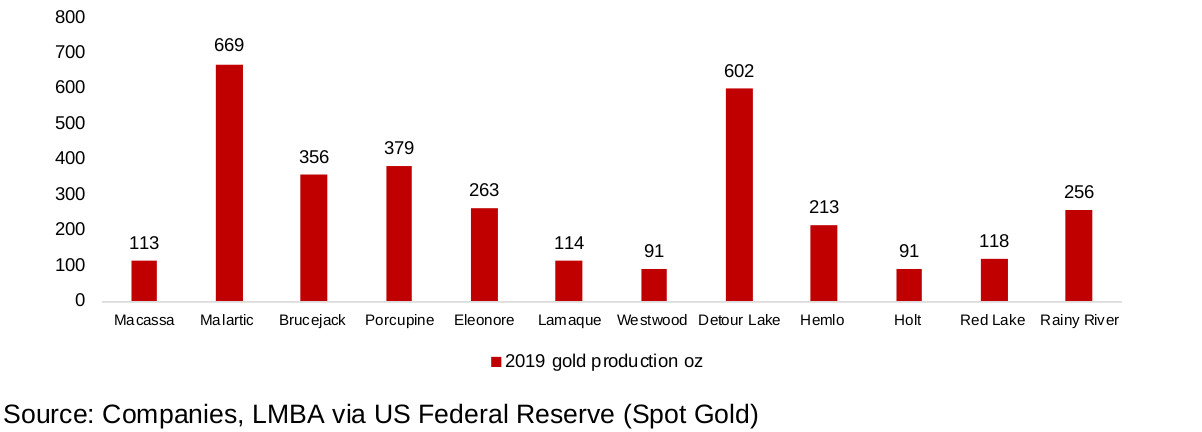
Figure 6 shows just how much the major Canadian producing gold miners' profitability has improved over the past two years, comparing the average gold price in 2018 and 2020 to their all in sustaining cost (AISC). We start with 2018 because it is the most recent year where the gold price was still at the trough levels of the past cycle for a whole year, as it picked up considerably in H2/19. For the AISC, we have ranked this from highest to lowest, and in Figure 7, we can see the ‘weighting' for each mine in terms of production. While we can safely use the 2020 average gold price versus the average of the last four quarters of AISC costs, it could be argued that the 2018 gold price is not comparable to this more recent AISC cost data. However, with inflation relatively low over the past two years, we still view these costs as a reasonable proxy.
At the US$1,268/oz average gold price for 2018, about half the group sees low to negative margins, although weighted by production, most of the major mines are still profitable. Of course, part of the reason that they are the largest producing mines is actually because of these low production costs, as higher cost mines would not have been considering viable by producers during the long trough in gold prices from 2012 to 2018. The average gold price of 2020 so far of US$1,650 is above the AISC of all of the mines except Rainy River (which is producing a lower grade of gold currently and thus facing higher costs). Looking at the last four months, the average gold price rises to US$1,716/oz, which would make all of mines profitable, and most by a significant margin. If this average were to hold, and even if gold did not see further major gains, it would likely be enough to drive continued major investment into the Canadian junior gold mining sector.
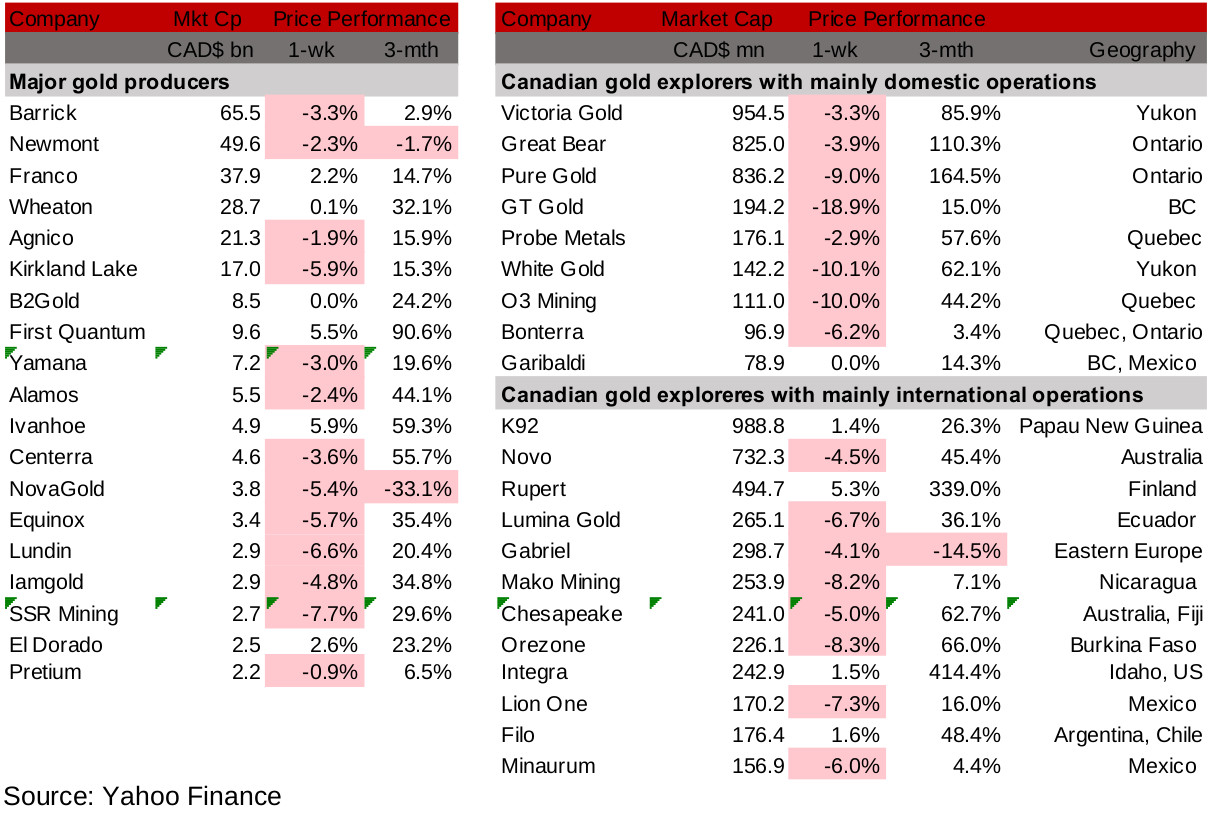
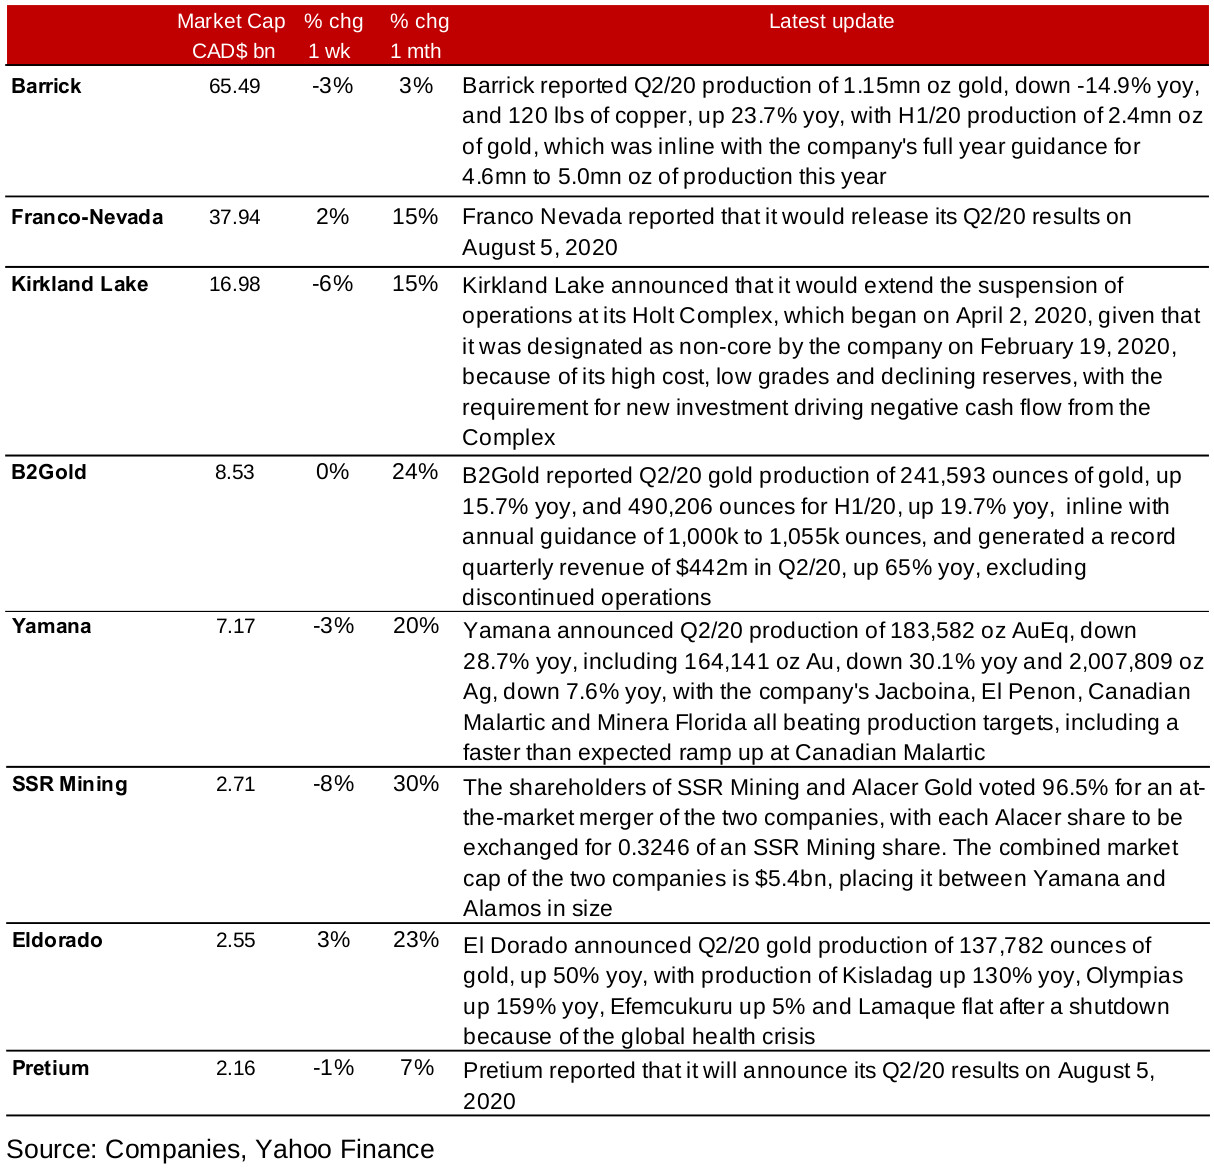
Figures 8, 9: Major producing gold mining stocks and Canadian juniors
Producers miners decline after strong month-long run
The major producing miners declined this week, as investors may be expecting some resistance as the gold price moves above US$1,800, and were also taking profit after a particularly strong run over the past month (Figure 8). Material news flow included preliminary Q2/20 gold production from Barrick, with gold down -14.9%, copper up 23.7% and production inline with 2020 guidance, B2Gold, with gold production up 15.7% yoy and record quarterly revenue, Yamana, with production down 28.7%, but beating all production targets, and El Dorado, with gold production up 50% yoy (Figure 10). Kirkland Lake announced that it would extend the suspension of its low grade, high cost Holt Complex, SSR Mining's planned merger with Alacer Gold was approved, leading to a $CAD5.4bn firm, placing it between Yamana and Alamos in terms of size, and Franco Nevada and Pretium announced their Q2/20 results dates.
Figure 10: Producing gold miners updates
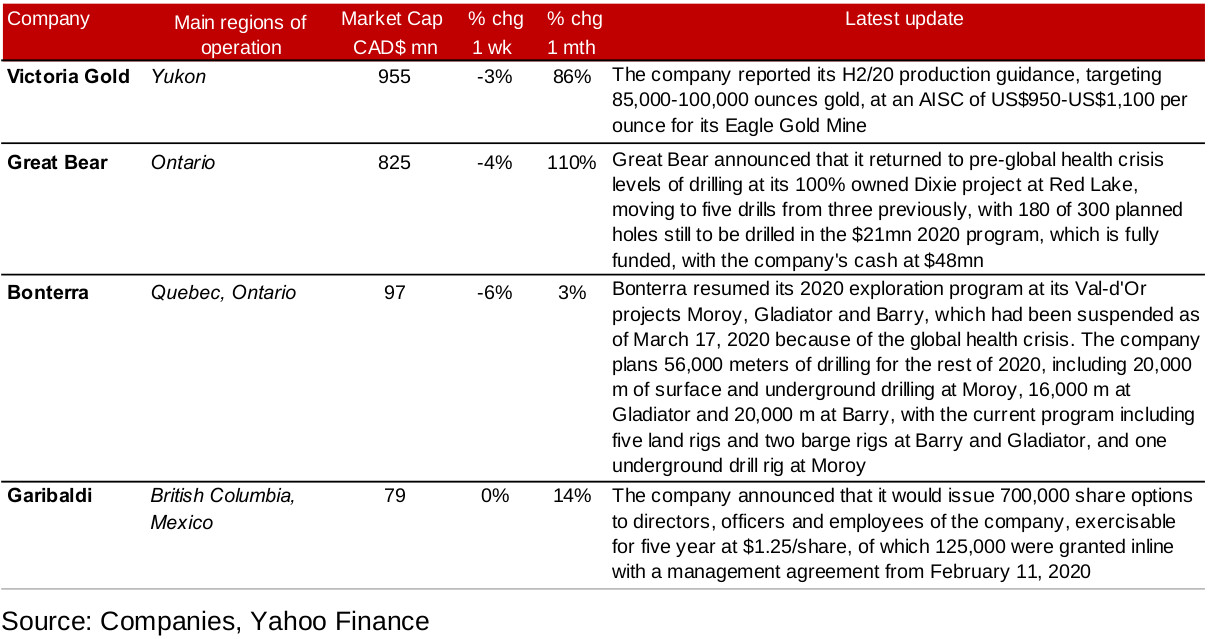
Canadian domestically operating juniors see declines
The Canadian operating junior gold mining stocks were all flat to down this week (Figure 9), with similar drivers to the producing miners, with investors possibly concerned about resistance at a US$1,800/oz gold price, and profit taking after a very strong performance for these stocks over the past three months. There were only four press releases from the group this week, with Victoria issuing H2/20 gold production guidance for its Eagle Gold Mine, Great Bear boosting its drill rigs to five from three, Bonterra resuming its exploration at Val-d'Or, and Garibaldi issuing stock options (Figure 11). Probe Metals, In Focus this week, saw a relatively marginal decline, down just -2.9%.
Figure 11: Canadian junior gold miners operating in Canada updates
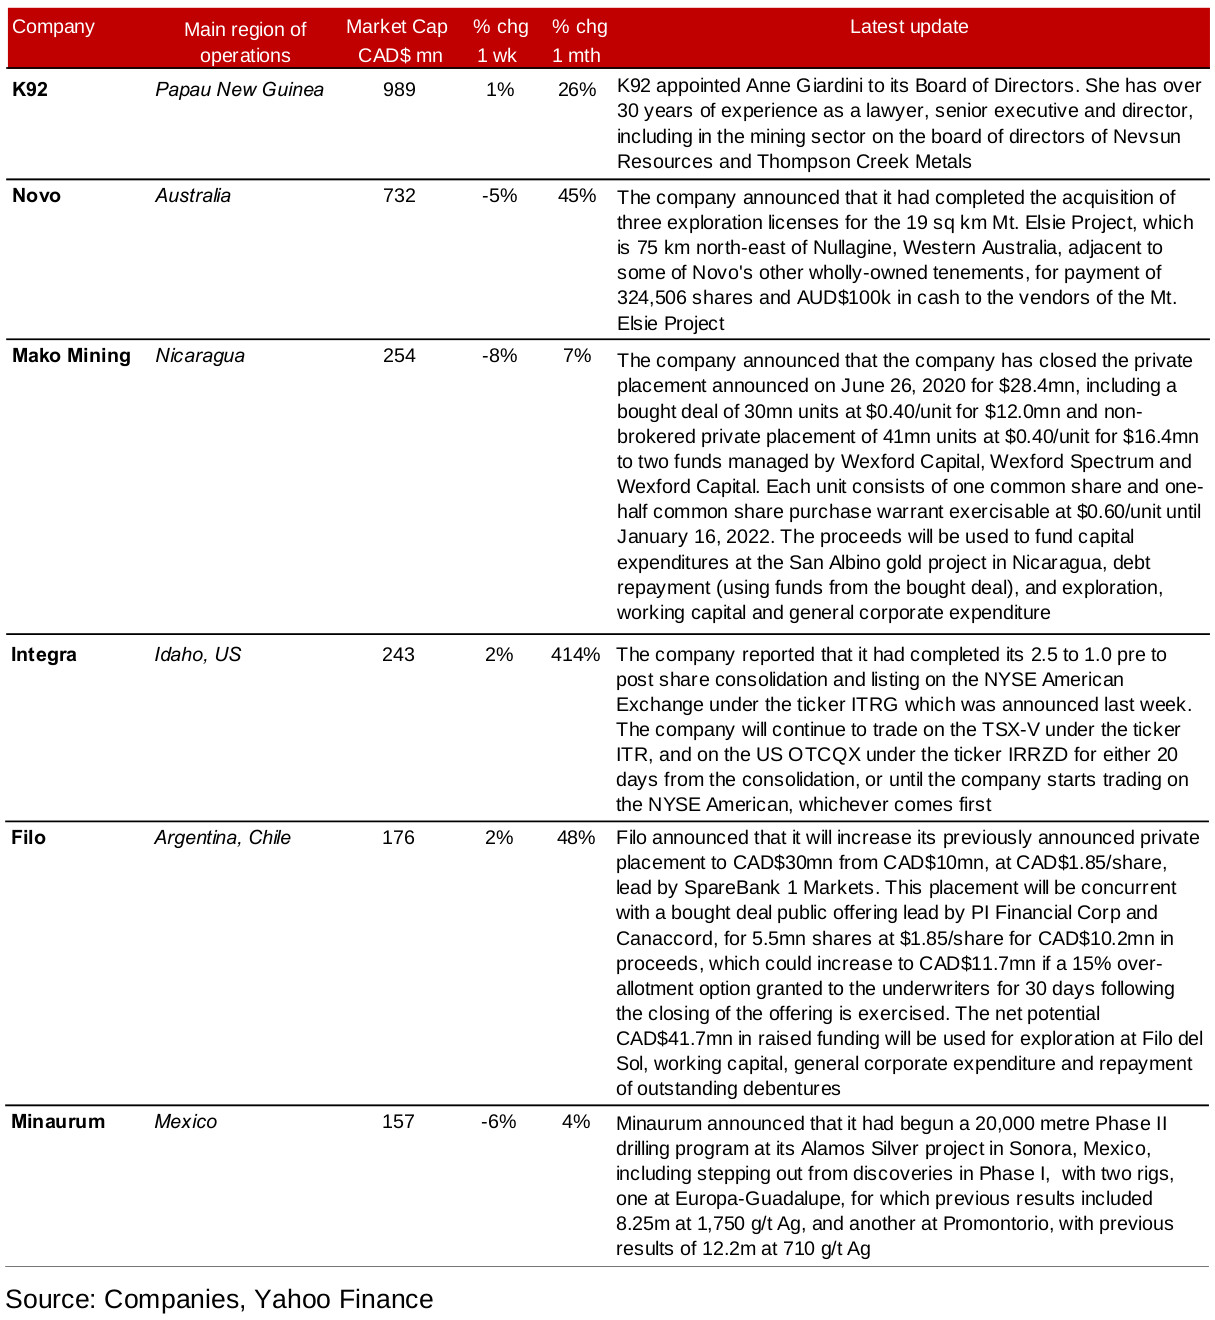
Canadian internationally operating juniors mostly down
The Canadian operating junior gold mining stocks were largely down this week, with a similar story to what we saw with the producing miners and domestically operating junior miners, potential resistance at a US$1,800/oz gold price and profit taking following a few months of solid gains (Figure 9). News flow from this group included a new appointment to K92's Board of Directors, the completion of the acquisition of Mt. Elsie property licenses by Novo, the completion of and further detail on Integra's previously announced listing on the NYSE American exchange, and Minaurum beginning its Phase II drilling program at its Alamos Silver project in Sonora, Mexico (Figure 12). There were also two financing announcements, with Mako Mining closing a private placement, and Filo expanding a previously announced private placement.
Figure 12: Canadian junior gold miners operating mainly internationally updates
In Focus: Probe Metals
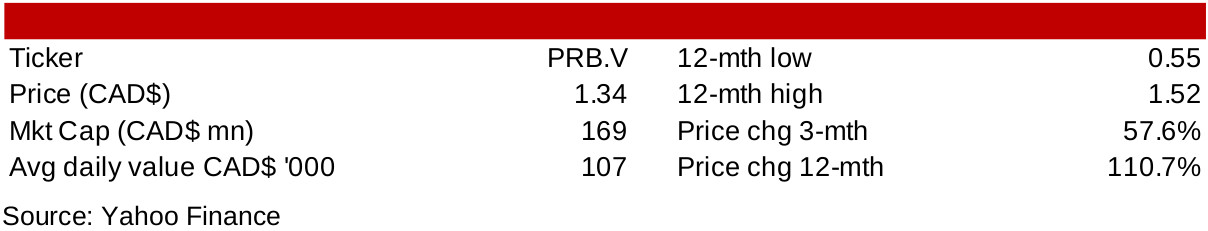
Figure 13: Probe Metals
Probe Metals operates Val-d'Or East in Abitibi Greenstone
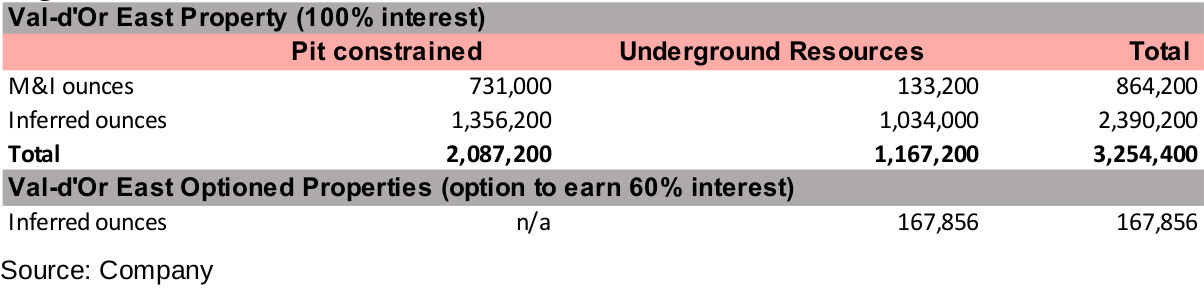
Probe Metals operates the Val-d'Or East project in Quebec's Abitibi Greenstone region, an area of high historic production of 200mn gold ounces with 30mn ounces of reserves currently. The company's core 100% owned Val-d'Or East property holds an estimated 3,254,400 ounces of gold, with M&I of 864,200 oz and inferred resources of 2,390,200 oz, with 2,087,200 oz pit constrained, and 1,167,200 oz underground (Figure 14). The company has increased these resources from just 770,000 in inferred resources in 2016, including through acquiring 100% of the Monique property in March 2020 and increasing its stake in the Detour property from 75% to 100% in May 2020, and expects to update this mineral resource by 2021.
Figure 14: Val-d'Or M&I and inferred resources
Fully funded major drilling programming ongoing
The company is currently operating its 90,000 metre drilling program for 2020, with 55,000 planned for resource expansion, 20,000 metres for infill and 15,000 metres for resource expansion. The results of the most recent drilling results from the Courvan zone, announced in June 2020, with highlights of 8.9 g/t over 10.9m and from the Monique zone, announced in April 2020, with highlights of 5.2 g/t over 14.0m, are shown in Figures 15 and 16. The company is fully funded for the 2020 drilling program, after CAD$17mn in flow through financing completed in December 2019 increased the company's total cash to CAD$30mn.
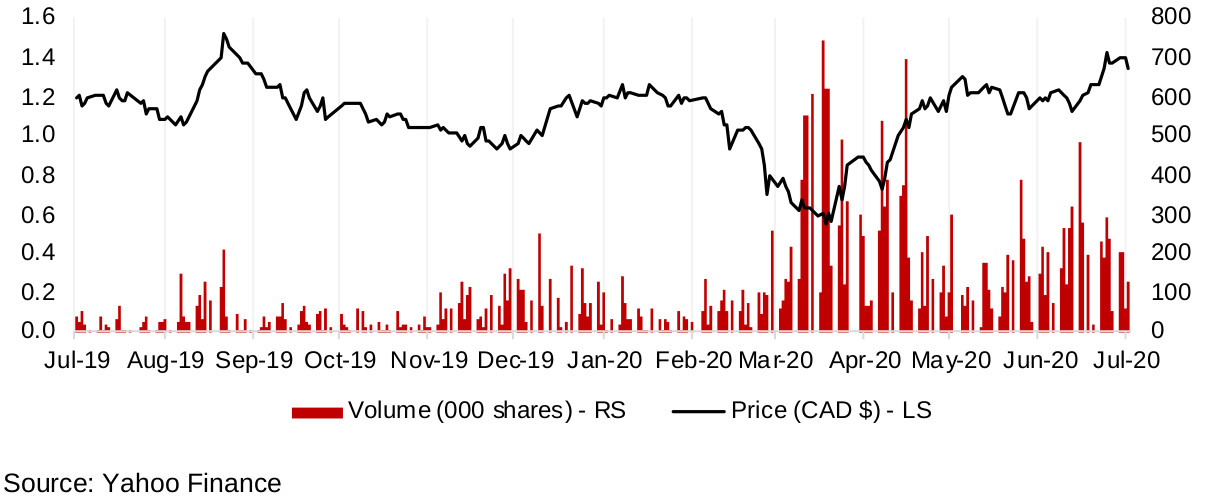
The company has a range of major institutional shareholders, including Newmont, Van Eck, Caisse de depot et placement du Quebec, Merk Investment, AGF Investments, BMO Asset Management and Libra Advisors, and management and the directors of the company hold more than 6%. Probe had made a major recovery off its March 2020 lows, and at CAD$1.34/share currently, is up 57.6% over the past three months, and 110.7% over the past twelve months, and has surpassed its pre-crash average around CAD$1.18mn that held over January and February 2020.
Figure 15, 16: Val-d'Or M&I and inferred resources
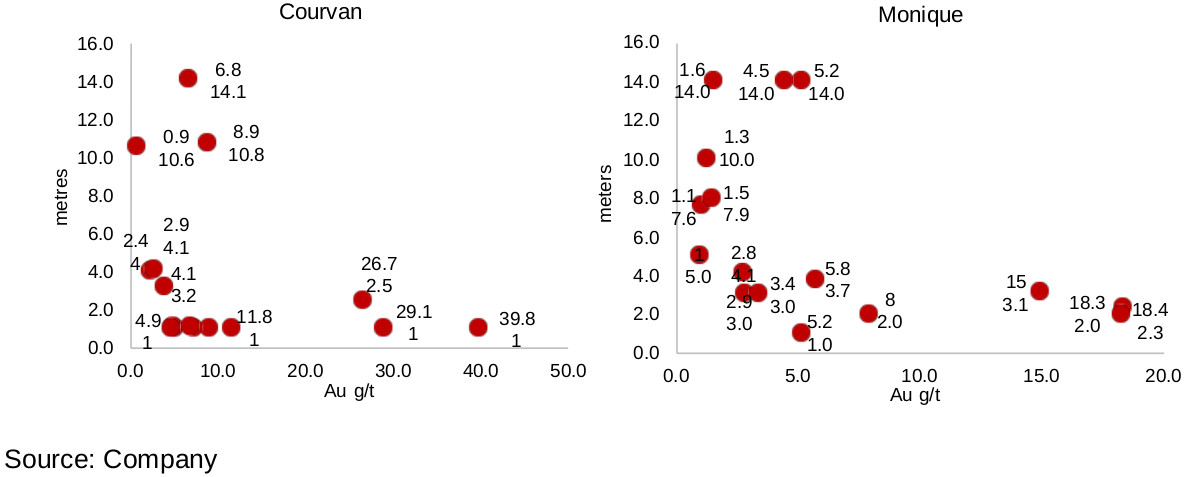
Figure 17: Probe Metals share price, volume
Disclaimer: This report is for informational use only and should not be used an alternative to the financial and legal advice of a qualified professional in business planning and investment. We do not represent that forecasts in this report will lead to a specific outcome or result, and are not liable in the event of any business action taken in whole or in part as a result of the contents of this report.