January 09, 2023
Silver Surge
Author - Ben McGregor
Gold up on rising US unemployment and lower wage inflation
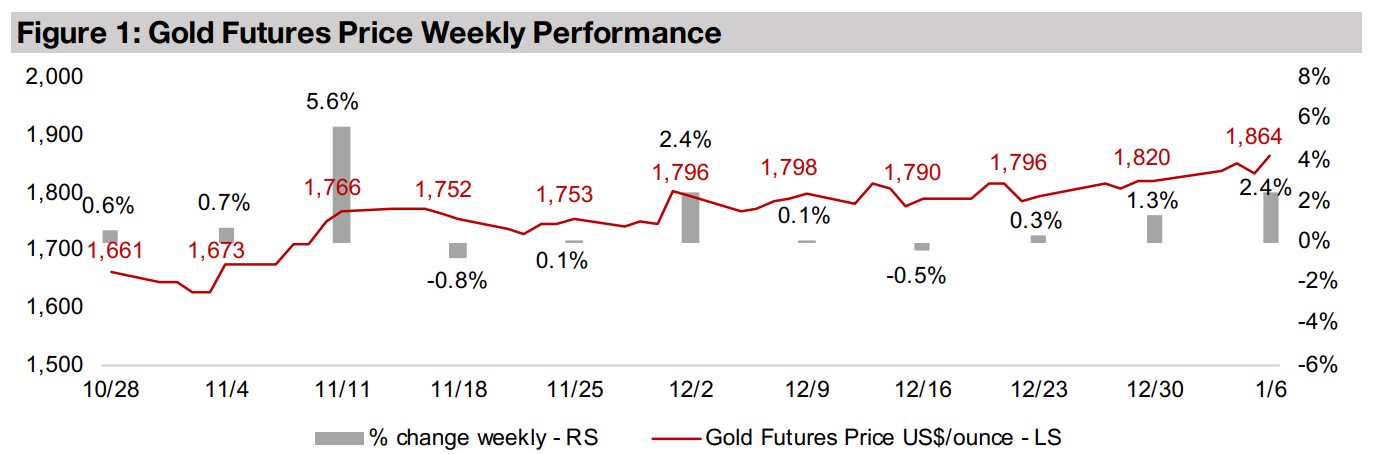
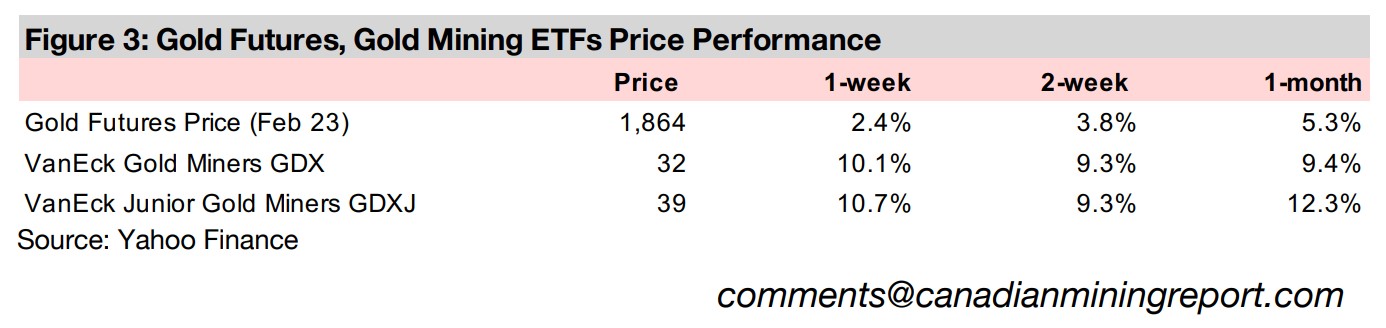
Gold jumped this week up 2.4% to US$1,864/oz, its highest level since June 2022, with the market viewing rising unemployment and lower wage inflation in the US jobs reports as evidence that could lead the US Fed to consider loosening monetary policy.
Silver price surges as inventories decline
This we look at the surge in silver prices, with an abrupt decline in supply, as shown by plunging LBMA inventories for the metal, versus moderate demand growth, sending the gold to silver ratio substantially below its short to medium term average.
Producing and junior gold see major jumps
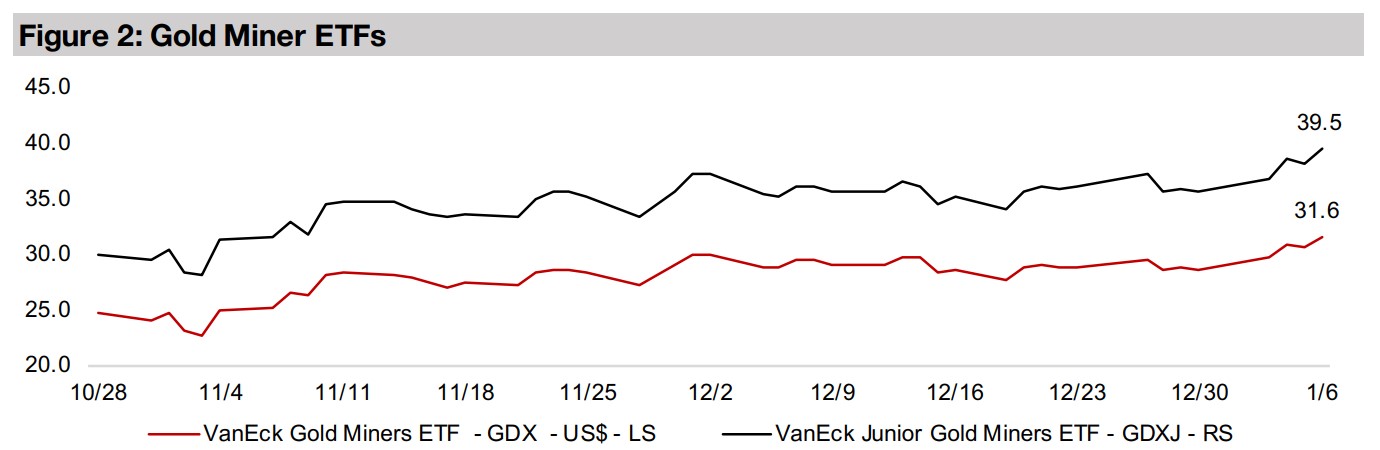
The producing and junior gold miners both saw major jumps, with the GDX up 10.1% and GDXJ rising 10.7% and the larger cap TSXV gold stocks mostly rose as gold gained and equity markets picked up on hopes yet again of a Fed pullback.


Silver Surge
Gold jumped 2.4% to US$1,864/oz, its highest level since June 2022, as a rise in US unemployment and decline in wage inflation in the recent US jobs reports once again buoyed market hopes that enough economic evidence was accumulating to allow the US Fed to pull back on its current aggressive rate hike path earlier than expected. This battle of "Will they or won't they, and when?" in markets with regards to a potential for an easing of rate hikes has dominated the market for the last several months, and looks set to continue well into 2023. It is interesting to see equity prices rise on what is actually weakening economic data, with the market seeming to believe that share prices can weather a period of lacklustre GDP growth but will certainly not be able to handle rates which are not near zero for an extended period.
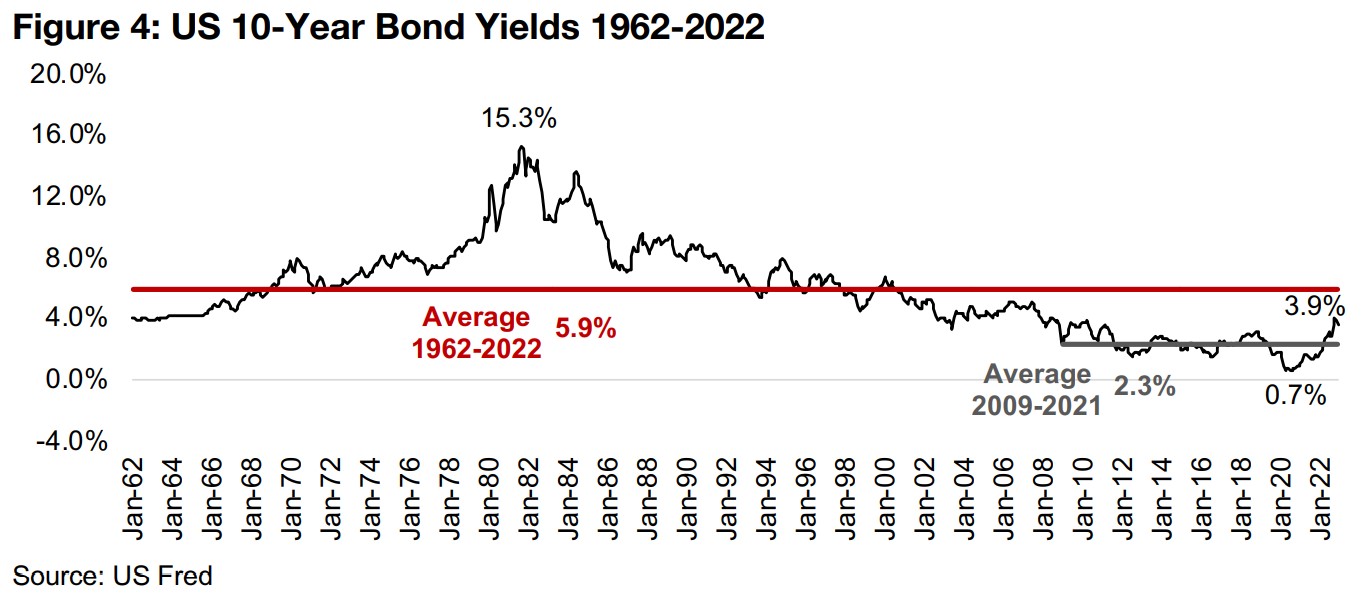
Interest rates still not that high in a historical context
While interest rates might be viewed as excessive compared to the levels of the past decade, they have actually just normalized around historical averages recently and could hardly be considered excessive. The US 10-year bond yield at 3.9% is still considerably below the 5.9% long-term average from 1962 to 2022 (Figure 4). What had in fact been excessive was the massive monetary expansion that was virtually non-stop from 2008 to mid-2022, keeping rates artificially low, with yields averaging just 2.3% from 2009 to 2021. This situation was really only permitted by anomalously low inflation, which was bound to be unsustainable, as proved in 2022. Market participants are well aware that extreme doses of liquidity had been propping up these markets for a very long time. With this liquidity clearly drying up, however, any hints that the taps might be turned on, and ever-dustier wells of monetary stimulus refilled, resulted in periods of elation in equity markets in 2022, but these hopes were repeatedly dashed in 2022 by the Fed reiterating a hawkish stance. We expect more of the same over Q1/23 at least and still see substantial downside rise for stocks.
A lot of economic damage could done even with 'high' rates only through H1/23
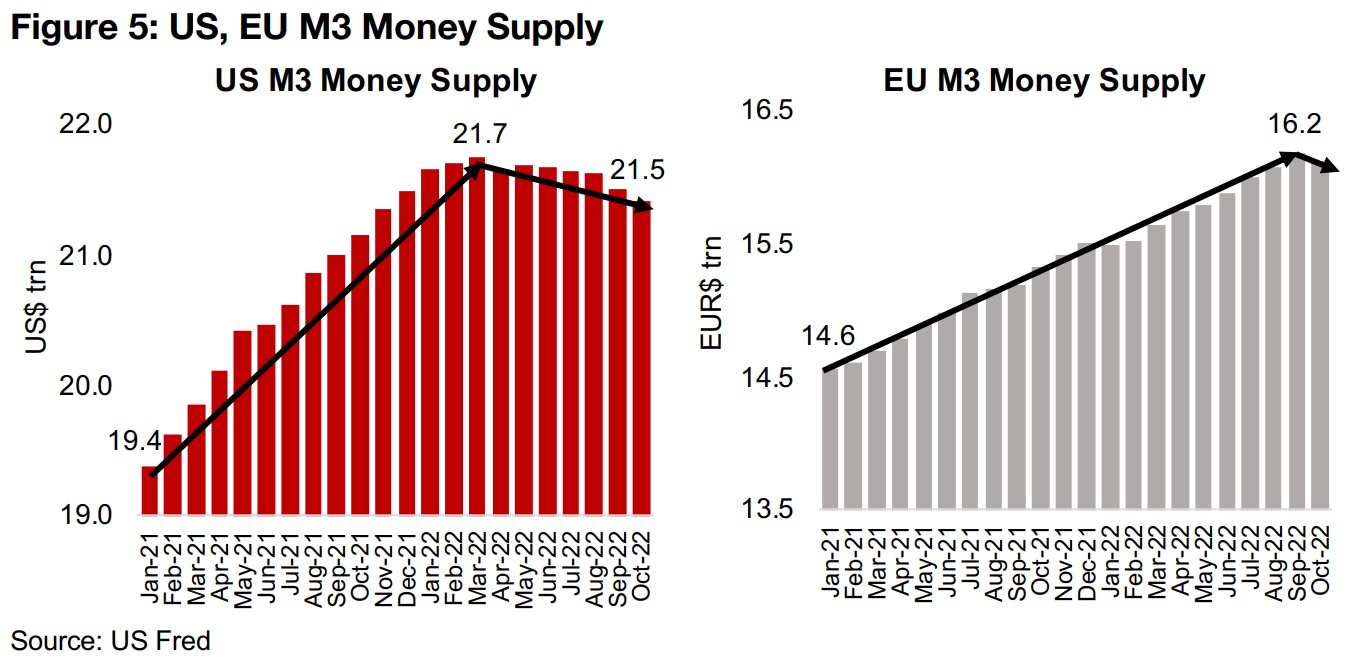
Figure 5 shows the harsh reality of the current liquidity situation, with the US M3
Money Supply declining since March 2022, also around the time many of the base
metals' prices peaked. While Europe had been behind the curve on rate cuts, it has
been catching up with the US in recent months, and EU M3 may have peaked in
September 2022, with it declining substantially in October. As rates have only risen
since, it seems likely November and December data will continue to trend down. With
credit the fundamental lifeblood of the economy and markets, and both having
become accustomed to being awash with it over the past decade, it seems unlikely
such a monetary contraction will generate strong GDP or a booming stock market.
Even if the Fed pulls back by mid-year, as markets currently expect, by that point
over a year of 'high' interest rates could have already created a lagged tsunami of
negative economic outcomes that will not easily be reversed by a few 50 bps cuts.
Any pullback early enough to avert this outcome, say in Q1/23, might be hoping for
too much, with the Fed having not given even a hint of leniency on their rate hikes so
far. We would likely need to see unemployment rise quite a bit off levels still near
decade lows before easing language is started to be included in their press releases.
With unemployment likely to remain low and inflation high through at least Q1/23, this indicates a pull back around mid-2023 at the earliest. By that point the cumulative negative economic effects could be hitting equity earnings hard, potentially offsetting easing by Central Banks. The markets are well aware of this potential scenario, and are thus hoping for a 'miracle' turn around by the Fed and other major central banks – almost immediately – to head it off at the pass. We expect that such a sudden shift is exceedingly unlikely, with the Fed clear that even once they see evidence of strongly declining inflation, they will maintain high rates for an extended period.
The recent big swings in equity markets and gold stocks still look risky
Given all this, big spikes in share prices, including for the gold stocks, like the ones seen this week, and several big run ups in Q4/22, make us more skittish than confident. This is because as we have outlined at length in previous weeklies, huge daily spikes in equity markets (and the gold stocks) are not evidence of a strong, sustainable bull market, but usually indicate an unrooted, risky bear market, with major gains susceptible to painful reversals. While we remain moderately upbeat on the gold price as a driver of gold stocks, it is the broader equity market that is the main source of our concern, with the potential that a market-wide multiple contraction continues, offsetting gains even in sectors with strong underlying drivers.
...but there is some probability that gold finally does go on a big run in 2023
All that said, we are not completely ruling out a gold bull run this year that is so substantial that it is able to offset the broader pressure on equity markets, but we don't rate its probability as that high. There is the certainly the potential that a spike in economic or geopolitical risk sends investors piling into gold, and in retrospect we may have already entered the gold stock rally of 2023 over the past week. However, we don't weight this scenario highly enough to suggest that the risk-averse jump aggressively into gold miners, especially junior gold, as bear market downswings can be just as crushing as upswings, like the one this week, are exhilarating. Nonetheless, for risk-takers content to endure some likely swings, easing into the producing gold miners, and some of the stronger juniors, is not now entirely unreasonable.
Silver heads back above average since 2020
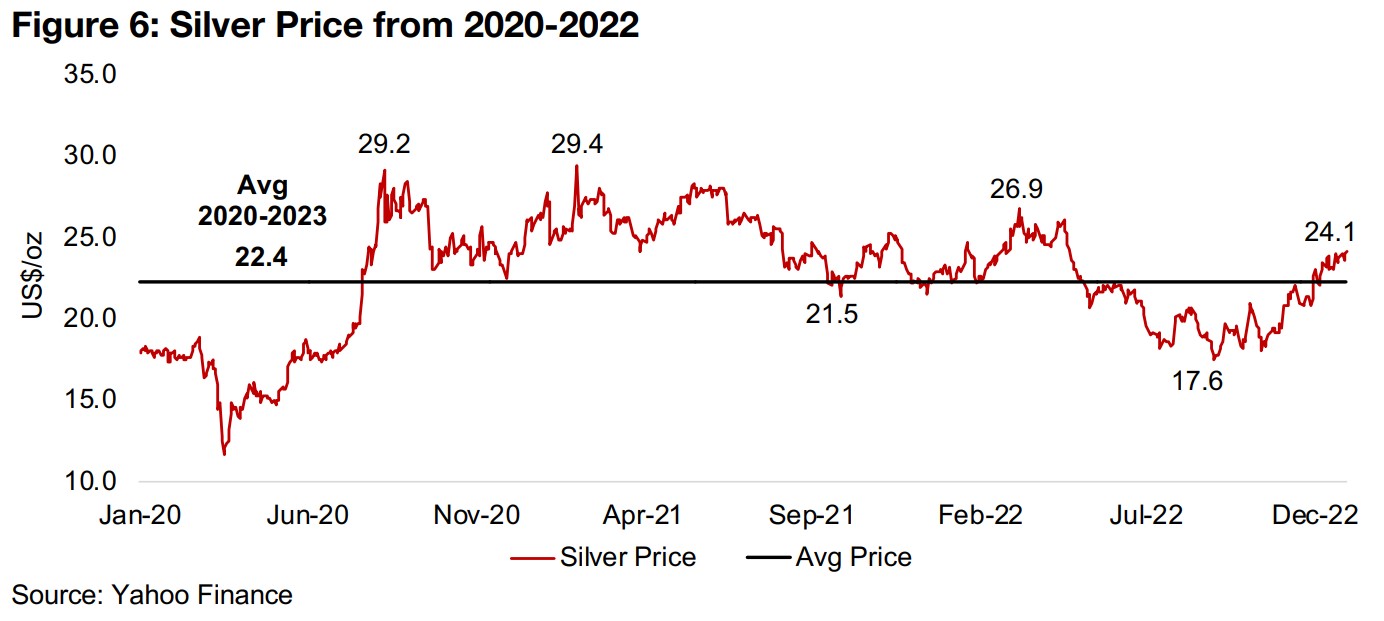
The silver price has had a concerted swing off lows of US$17.6/oz in September 2022
up to over US$24.0/oz currently, and has just starting to move above the US$22.4/oz
average since 2020. The previous notable rise in its price was in early 2022 to
US$26.9/oz, along with broader rise in the base metals, with the silver price driven by
a split of industrial factors, like the base metals, but also monetary factors, similar to
gold (Figure 6). Prior to that, the last big run up in silver was early 2021, to its highs
of the past three years at US$29.4, driven by a brief flurry of Wallstreetbets related
speculation. This did not have a particularly strong fundamental foundation and was
reversed quickly as these 'underground' traders had previously been able to
manipulate individual stocks, but had limited success trying to take a run at the
comparably huge overall silver market.
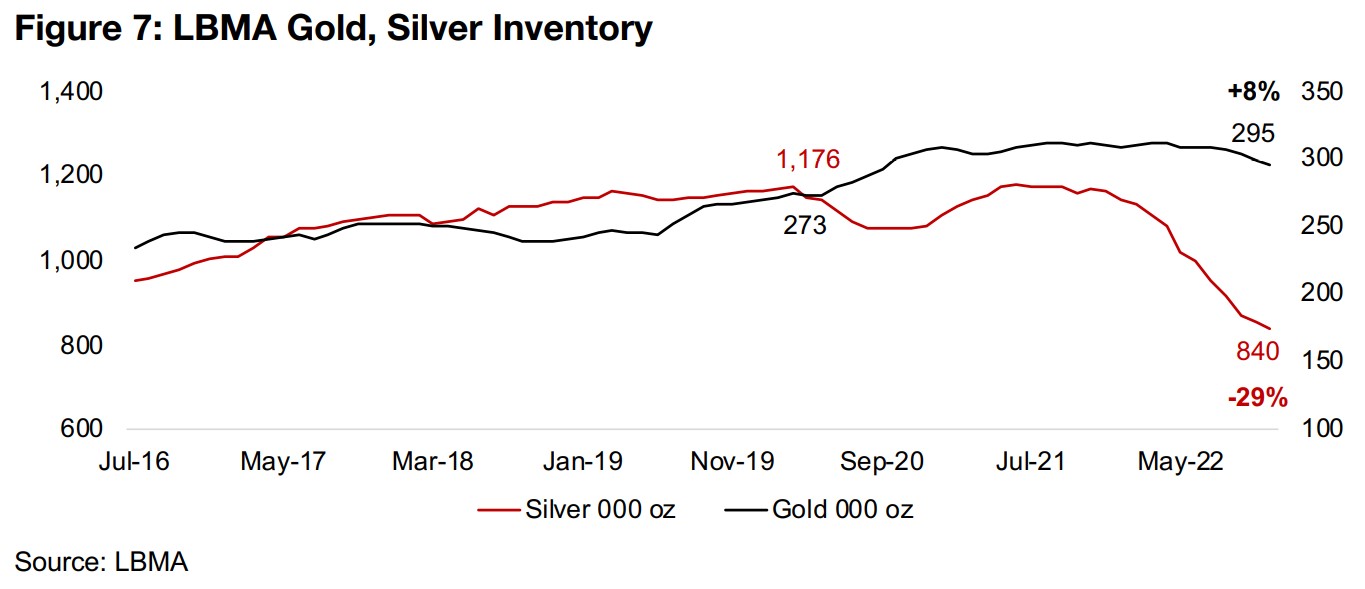
The recent rise has been partly driven by a major decline in available silver inventory,
with the LBMA showing a -29% drop from 1,176 mn oz in March 2020 in to just 840,
mn oz in November 2022, with the gold inventory rising 8% over the same period to
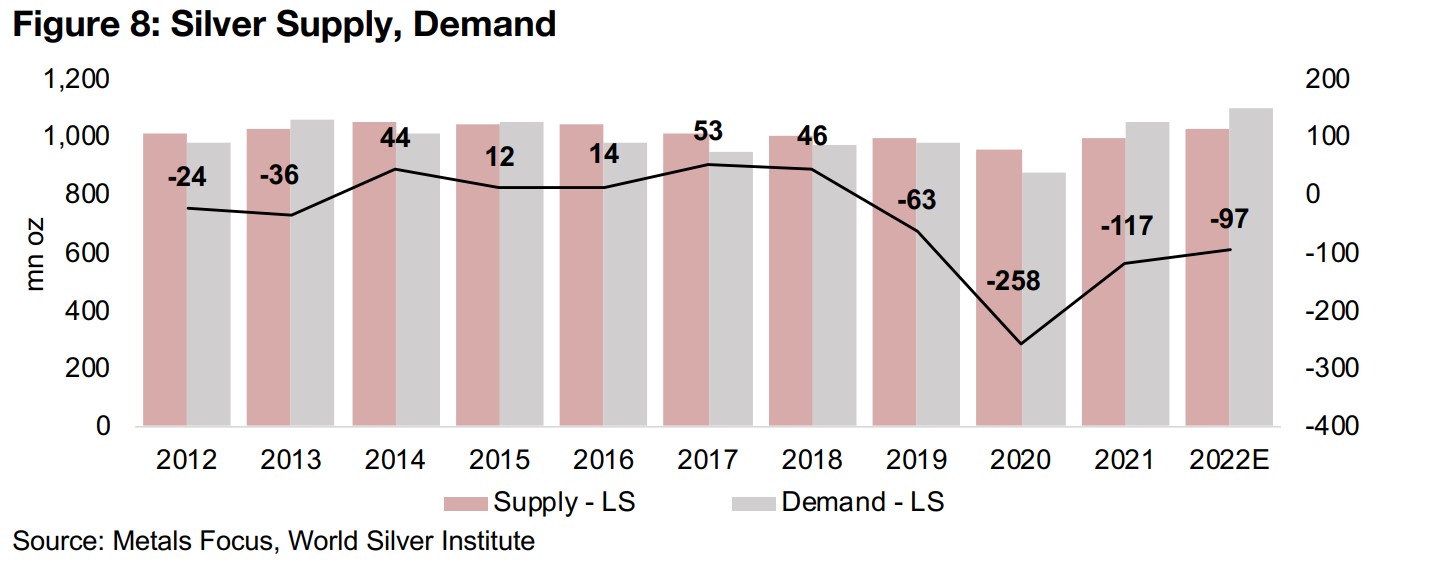
295 mn oz (Figure 7). The silver market has actually been in deficit since 2019, and
reached its most severe point 2020 at 258 mn oz, with the deficit narrowing to 117
mn oz in 2021 and forecast to reach 97mn in 2022 (Figure 8).
Existing silver market deficit exacerbated in 2021
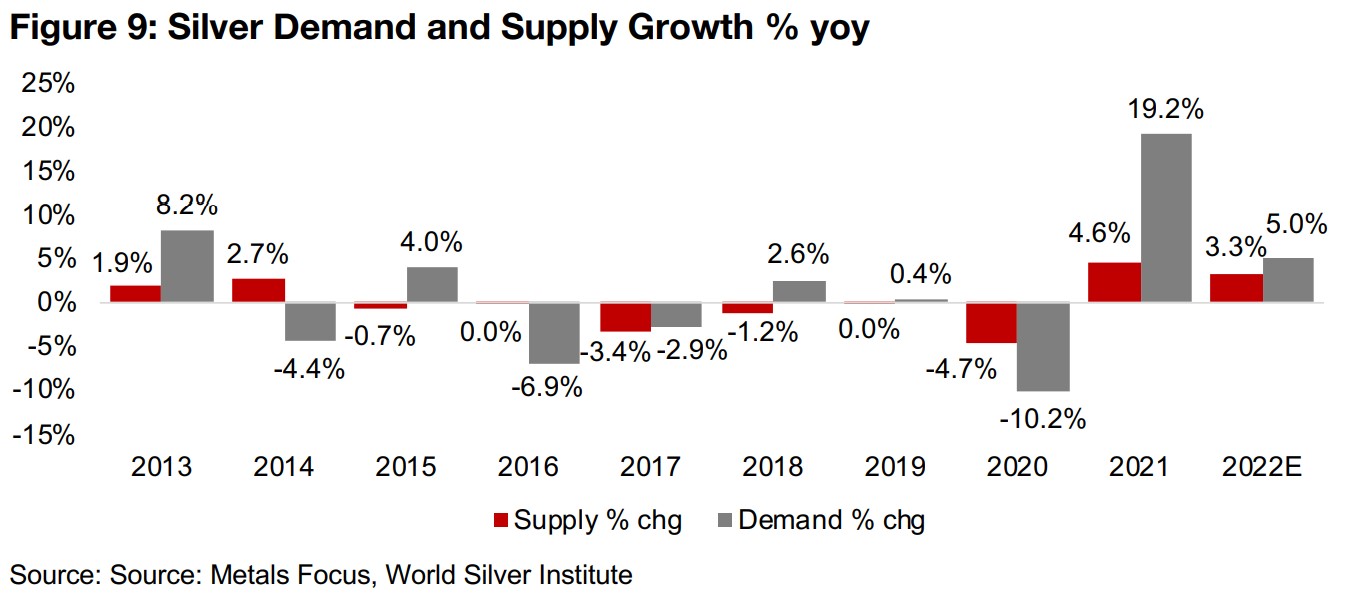
The current supply shortage is likely rooted especially in the 19.2% jump in 2021
silver demand, off a contraction of -10.2% in 2020, with supply only rising 4.6%,
seeing the industry enter 2022 already drawing down heavily on inventories (Figure
9). While in 2022 silver demand is forecast to rise a comparably modest 5.0%, supply
grew just 3.3%, which will have exacerbated the imbalance from 2021, with the
drawdown in LBMA inventories starting around mid-2021 and gaining pace since.
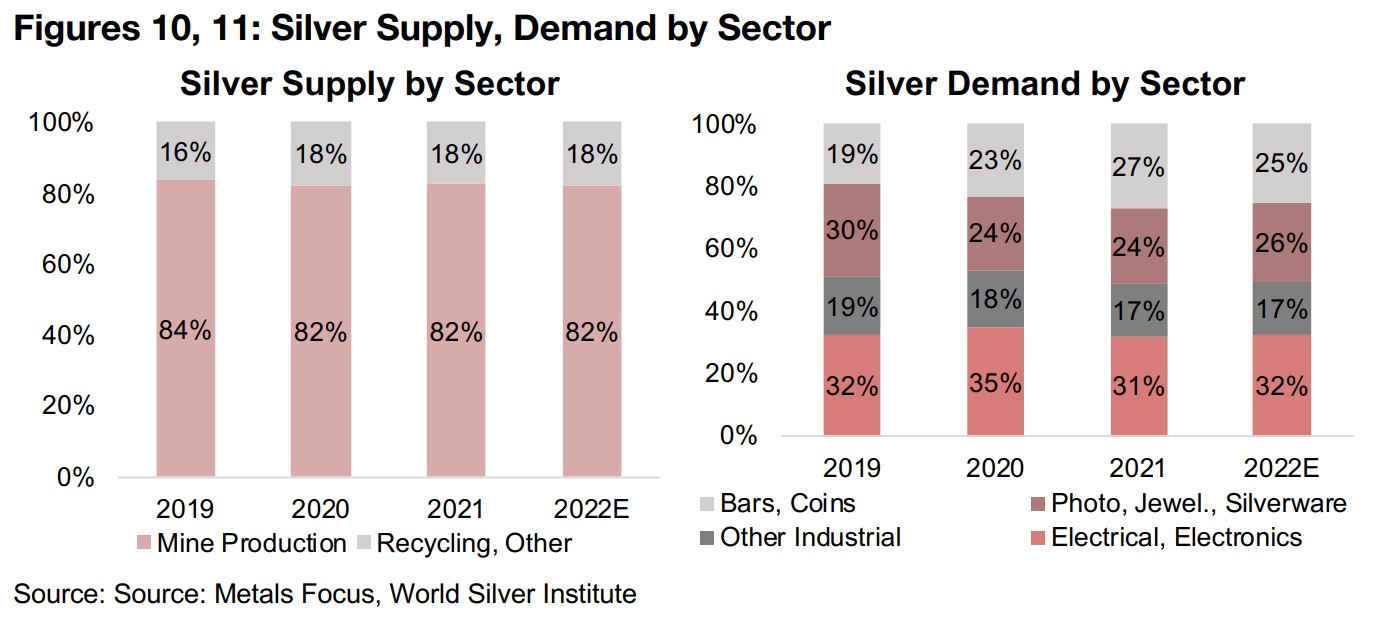
The majority of silver supply, or 82% from 2020-2022, was from mines (with the
remainder from recycling), which saw operational interruptions from the global health
crisis, while supply chain disruptions held back shipments of the metal (Figure 10).
The electrical and electronic industries are the largest sources of silver, increasing to
32% of the total in 2022E total from 31% in 2021, with photography, jewellery and
silverware demand increasing to 26% of the total in 2022E, with bar and coin demand
declining to 25% and other industrial uses increasing to 26% (Figure 11).
Monetary drivers likely adding to silver's gains
The supply crunch and industrial demand is likely only making up part of silver's rise, and we suspect that its monetary drivers also are playing a significant part. While gold does have some industrial uses, its price tends to be driven almost entirely by monetary factors, with silver likely a balance between the two. With monetary driven gold going on a substantial run over the past several weeks, is suggests that the silver price may have also benefited from similar themes on the monetary side.
Gold to silver ratio below short to medium-term, but not long-term, average
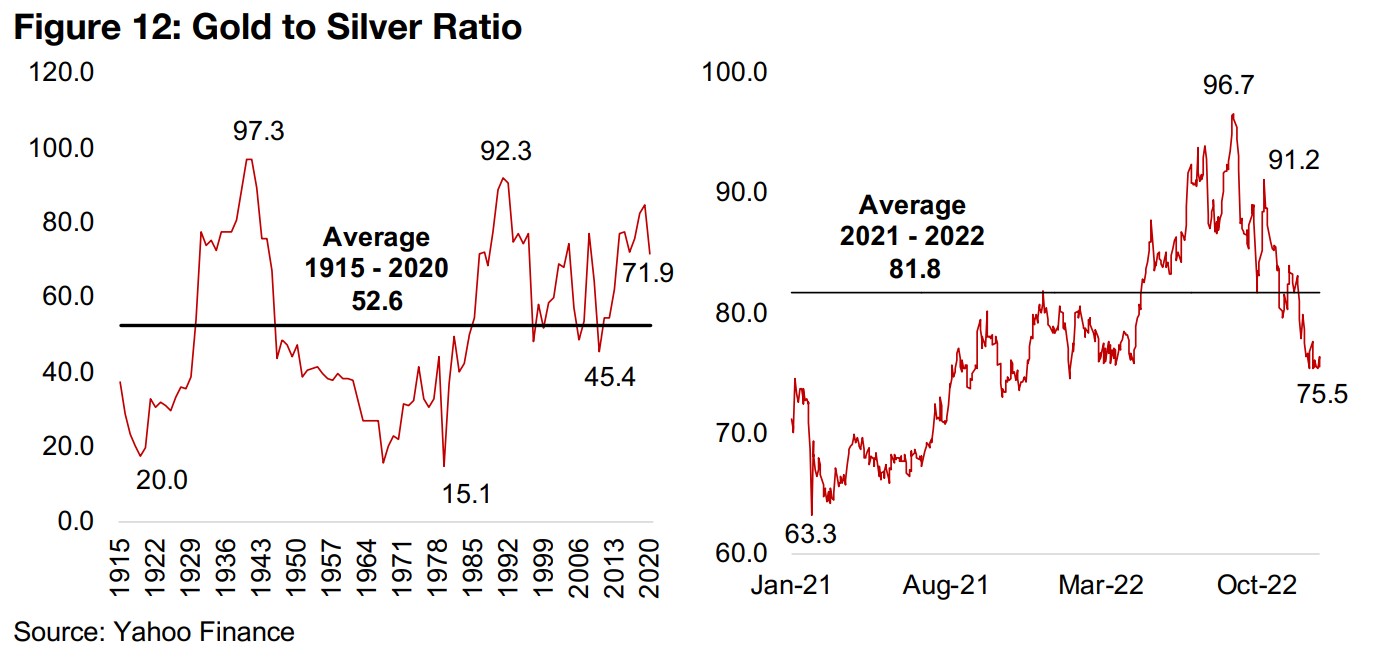
The rise in the silver price has seen the gold to silver ratio decline from its peak of 96.7 in September 2022 to just 75.5 currently, dipping substantially below its 81.8 average since 2021, but still above lows of 63.3 reached during the wallstreetbets buying frenzy (Figure 12). This could hint that silver's move is somewhat overdone and that a relative rise in gold may be coming, or that silver demand will decline even further if the global economy continues to cool, bringing it more inline with supply and bringing down the price.
Silver stock outlook mixed as market pressure could offset metal price gains
However, the timeline for such moves remains unclear, with silver supply likely to remain extremely tight at least over H1/23 while demand may continue to ease only comparably gradually. Also, the gold to silver ratio will still have a long way to go if it heads for the early 2021 lows, or the longer-term average of 52.6 from 1915-2020. Although consensus forecasts for 2023 are looking for a moderate decline in the silver price, this would depend on the supply deficit easing, mostly likely from a global-economic slowdown driven decline in demand, in our view. For silver stocks, we see a similar situation to gold, with some chance of a continued silver price breakout likely to be overshadowed by a decline in equity markets overall.
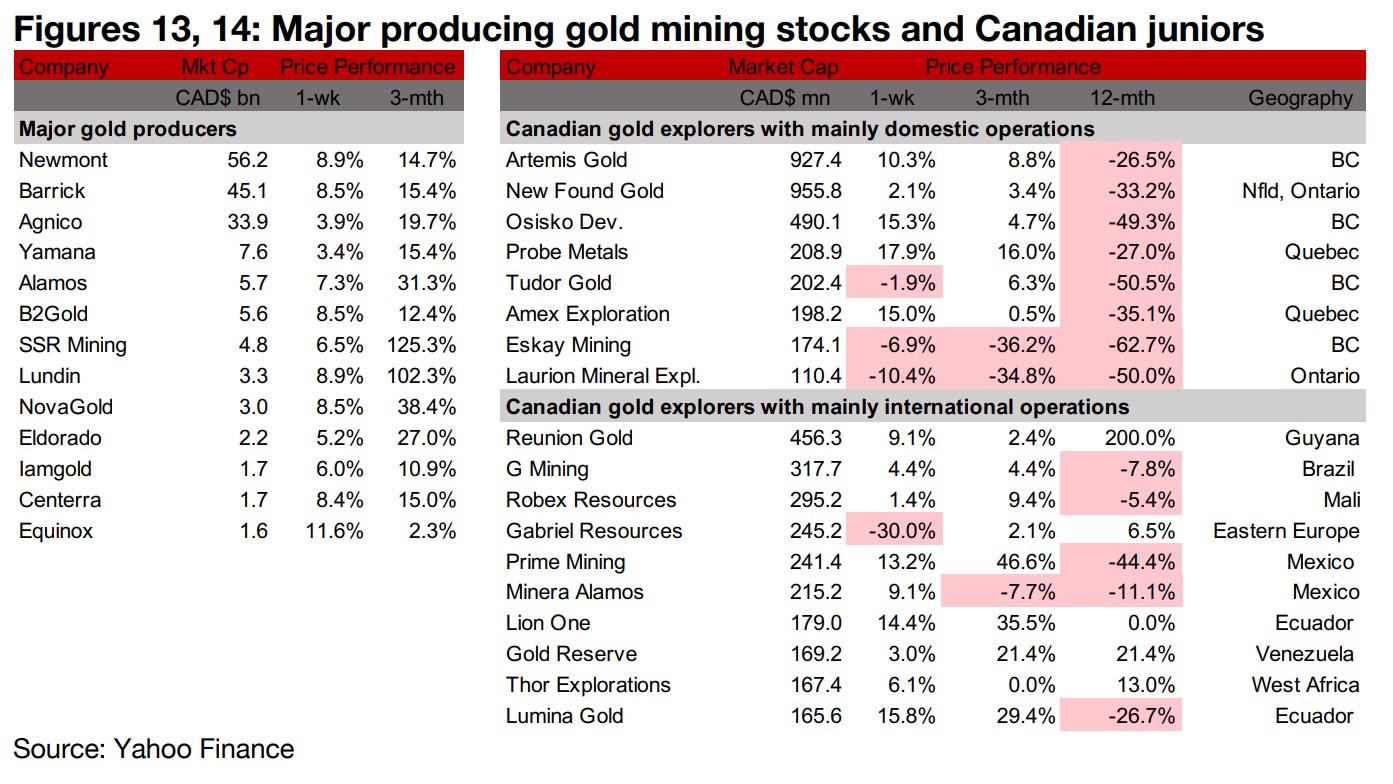
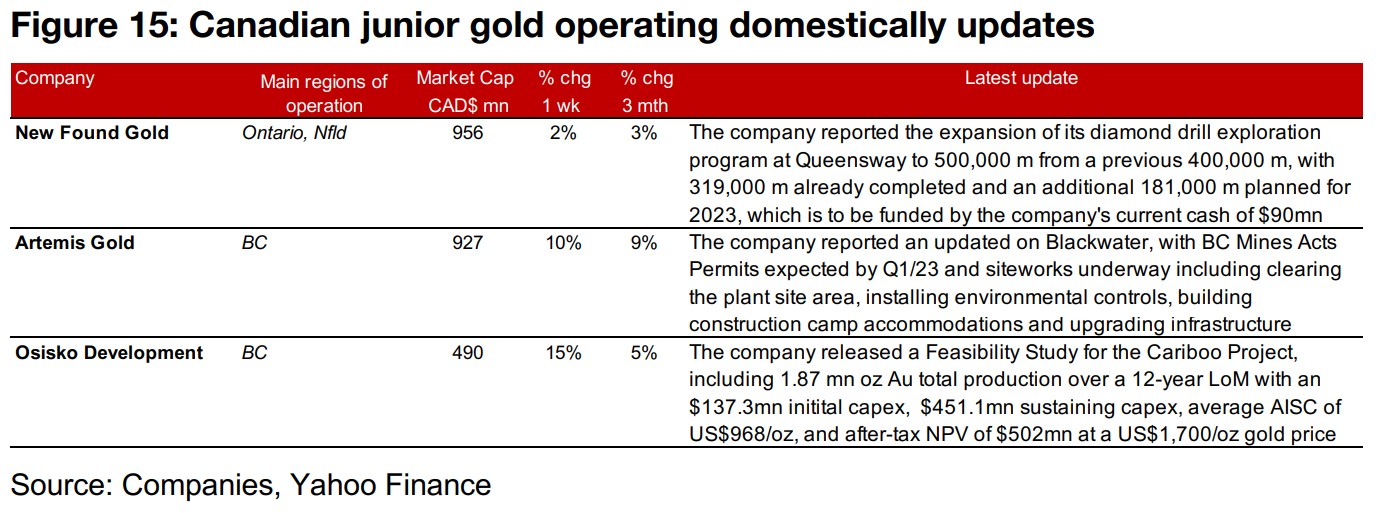
Producers surge and TSXV gold stocks mostly rise
The producing gold miners all rose substantially and the TSXV junior gold miners were nearly all up on the jump in gold and equity markets (Figures 13, 14). New flow this week was all from the Canadian juniors operating mainly domestically, with New Found Gold expanding its diamond drill program at Queensway to 500,000 m from 400,000 m, with 319,000 already completed. Artemis Gold reported an update for Blackwater, including progress on permitting and siteworks, and Osisko Development released a Feasibility Study for the Cariboo Project, with an after-tax NPV of $502mn at a US$1,700/oz gold price (Figure 15).
Disclaimer: This report is for informational use only and should not be used an alternative to the financial and legal advice of a qualified professional in business planning and investment. We do not represent that forecasts in this report will lead to a specific outcome or result, and are not liable in the event of any business action taken in whole or in part as a result of the contents of this report.