June 10, 2024
Silver Supported by Persistent Deficit
Author - Ben McGregor
Gold dips as US employment data strong
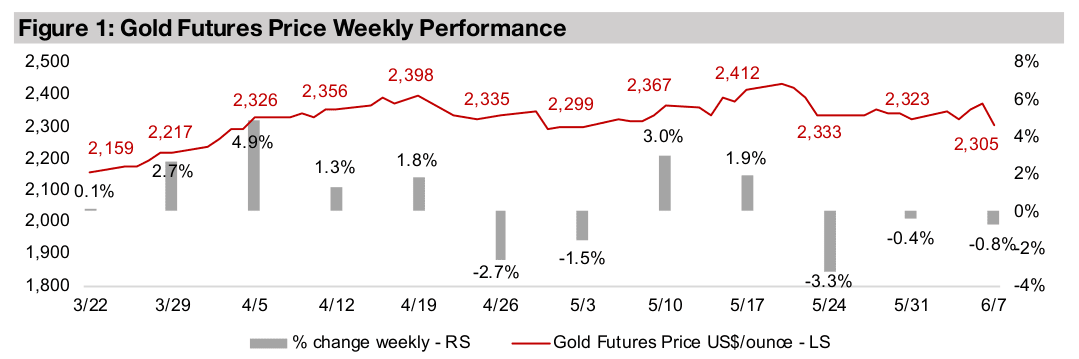
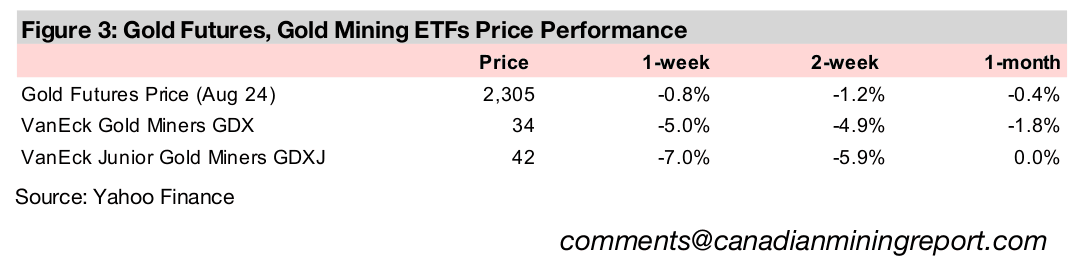
Gold declined -0.8% to US$2,305/oz, as US employment data came in hotter than expected, leading to concerns the Fed would hold off on rate cuts, while the metal has consolidated around an average US$2,350/oz over the past two months.
Silver price could be supported by continued deficit
While silver participated in the partly speculative rise of many major metals over the past two months, its gain also has fundamental underpinnings, with a significant deficit expected for this year especially on a large pickup in industrial demand.
Producers and junior gold both take a hit
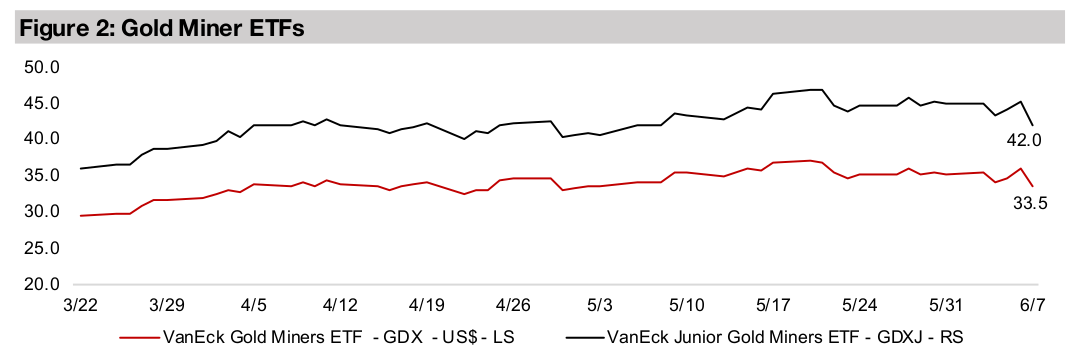
The producing and junior gold stocks both fell, with the GDX losing -5.0% as gold dropped and the overall gain in large cap equities did not carry over to the mining sector, while the GDXJ slumped -7.0% driven by a plunge in small cap equity.


Silver Supported by Persistent Deficit
The gold price dropped -0.8% to US$2,305/oz, as a strong US jobs report once again
raised concerns that the Federal Reserve would not cut rates anytime soon. US
nonfarm payrolls were 272k for April 2024, 43% above expectations, although the
unemployment rate rose to 4.0%, the highest since the start of 2022. While the
markets took a substantial hit on the release, US large caps, led especially by tech,
still ended the week up, with the S&P 500 gaining 0.94% and Nasdaq rising 1.59%.
However, small caps were weak, with the Russell 2000 plunging -2.7%, showing that
investors still remain quite cautious further out on the risk spectrum. This is in line
with a shift in markets towards ‘safer assets’ this year that we have highlighted in
recent weeks. While US Tech still leads the market YTD, over the past two months it
has been substantially outperformed by more defensive sectors, including a rise in
the producing gold stocks and a significant gain in the utilities sector.
Gold fundamentals still strong as it consolidates over past two months
After its huge 30% gain from early October 2023 to mid-April 2024 on a combination of rising financial and geopolitical risks, gold has consolidated for the past two months, range trading around an average US$2,350/oz. Some factors that could have been attenuating further gains are a year to date rise in bond yields and the US$, although both these negative drivers have eased since mid-May 2024. Still in support of gold are continued strong central bank buying and ETF inflows this year. Relative measures of gold versus other key metals and commodities overall still do not point to a significant overvaluation for the metal, and several major investment banks still have US$2,500/oz price targets for this year.
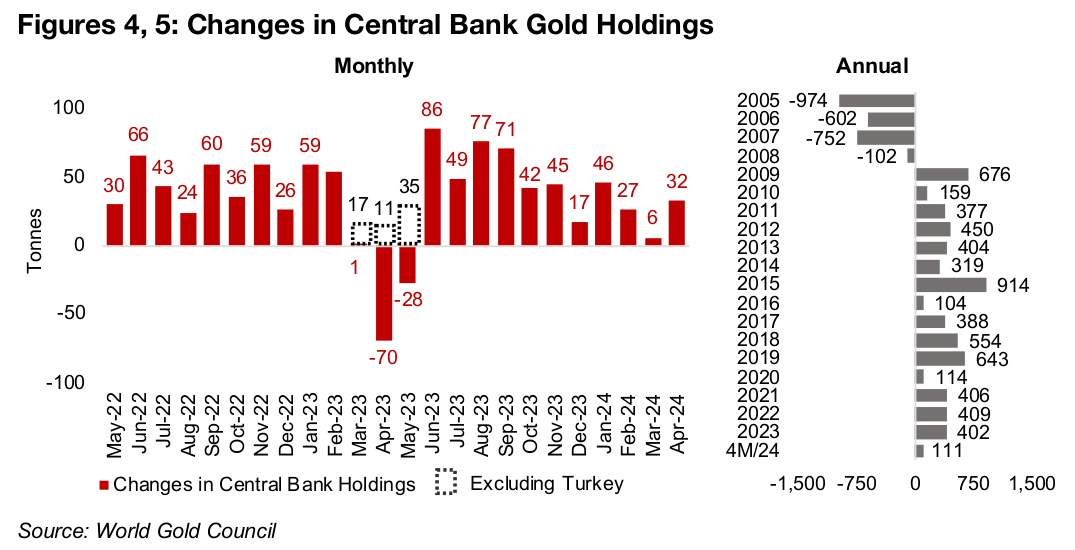
Central bank buying of gold has remained strong so far in 2024, with 111 tonnes of
net purchases over the first four months of the year (Figure 4). Purchases were strong
in January, February and April 2024, at 46, 27 and 32 tonnes, respectively. March
was weakest month of the past two years, at only six tonnes, excluding the
exceptional situation in Turkey in mid-2023. The current run rate is on track for nearly
350mn tonnes in net purchases this year. This is moderately below the over 400
tonnes added in each of the past three years and the 421 tonne annual average since
a fifteen year central bank gold buying spree started in 2009 (Figure 5).
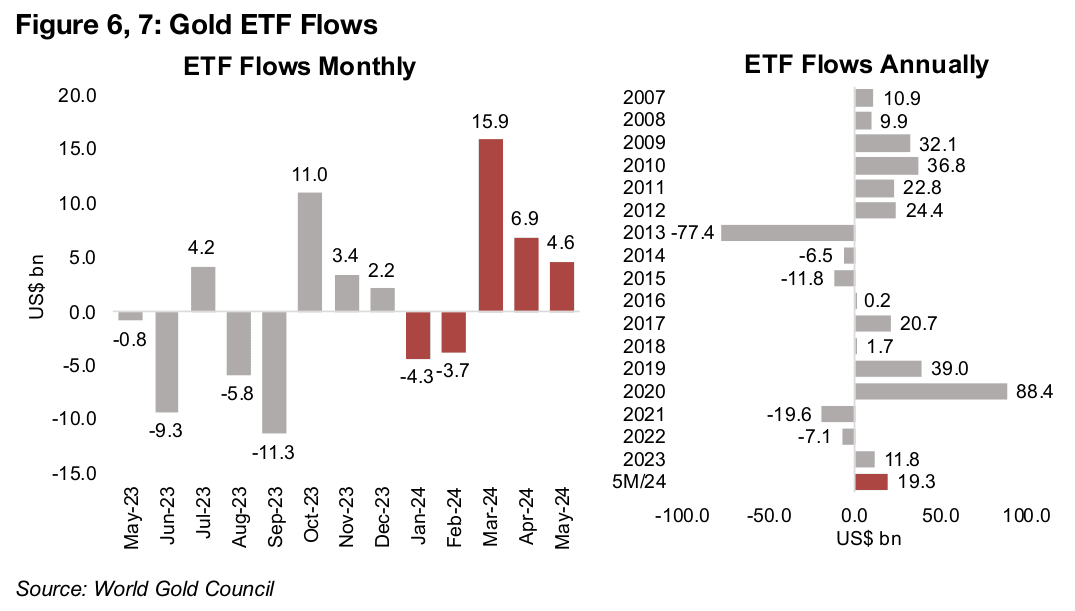
Gold ETF inflows show strong continued market interest in the metal through to May
2024. The US$8.0bn in outflows in the first two months of 2024 were reversed twice
over with a jump to US$15.9bn of inflows in March 2024, with US$6.9bn added in
April 2024 and US$4.6bn in May 2024 (Figure 6). With US$19.3bn in total ETF inflows
so far, this year is well on track to surpass last year’s net additions of US$11.8bn,
after large net outflows in 2021 and 2022 (Figure 7).
While gold ETF inflows in 2024 could easily surpass the most recent few years, the
big hurdle would be to beat the massive US$88.4bn and US$39.0bn of inflows in
2019 and 2020. This followed a six-year gold bear market when the market had
heavily sold off its positions in the metal, only to come storming back in 2019. While
a reversal to gold outflows by central banks and for the ETFs can’t entirely be ruled
out this year, we see the probability weighted towards further inflows for both given
continued very high economic and geopolitical risk.
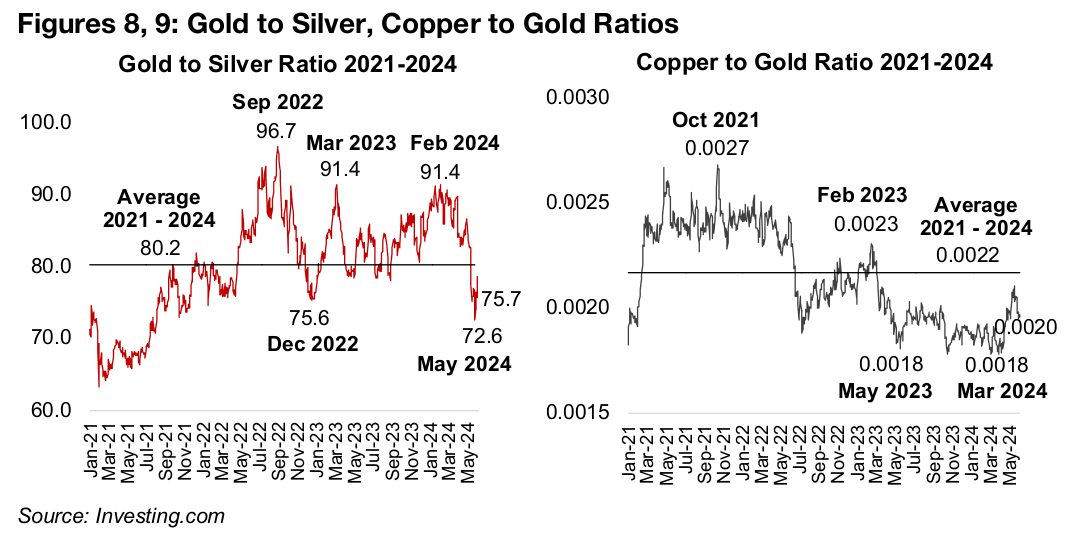
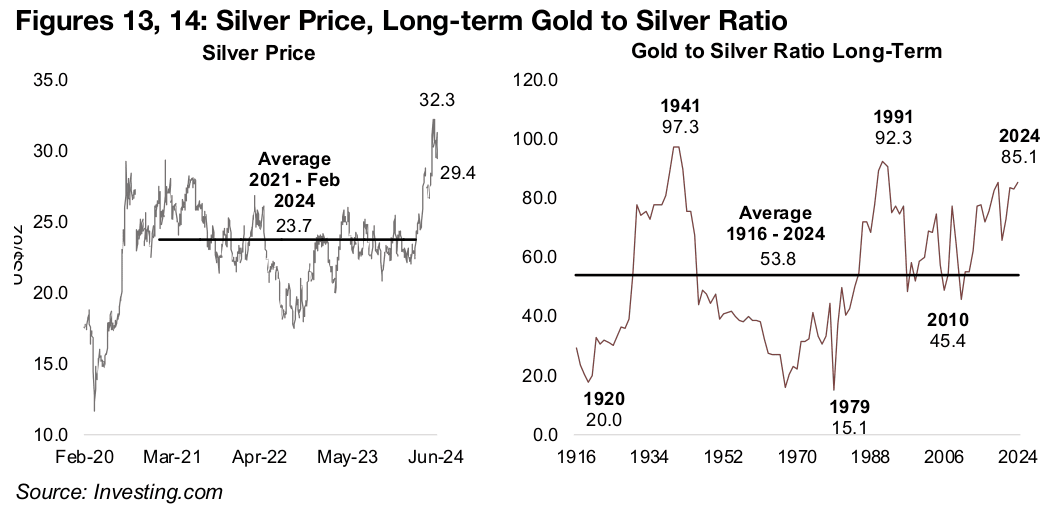
Comparing gold to silver, copper, oil and the CRB commodities index overall still do not show the metal as heavily overvalued. While the gold to silver ratio started to look high in February 2024, peaking at 91.4x versus an 80.2x average since 2021, it plunged as silver rose along with many industrial cycle-driven metals especially since April 2024 (Figure 8). The ratio dropped as low as 72.6x in May 2024, and while it has recovered to 75.7x since, this is still well below the average since 2021, suggesting a degree of gold undervaluation, at least in the short-term. Copper’s similarly aggressive recent move drove its ratio versus gold ratio up from lows of 0.0018x to almost back to the 0.0022x average since 2021 in May 2024 (Figure 9). The ratio has declined to 0.0020 since, indicating a degree undervaluation for copper.
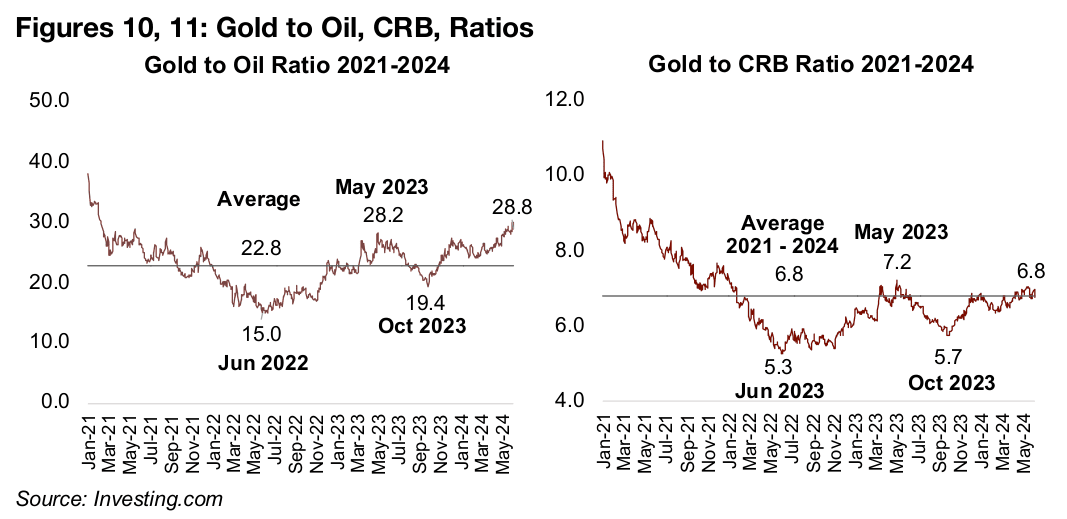
The gold to oil ratio at 28.8x does look high versus the average of 22.8x since 2021 and is well off its June 2022 lows of 15.0x (Figure 10). However, this is more because of a particularly low oil price on a surge in supply than an overvaluation of gold. The gold price looks quite fairly valued versus the wider basket of commodities shown by the CRB Index, with the ratio at 6.8x, exactly in line with the average since 2021 (Figure 11). Gold had actually looked somewhat undervalued versus commodities at the recent lows of 5.3x in June 2023 and 5.7x in October 2023.
Silver could be supported by expected continued deficits
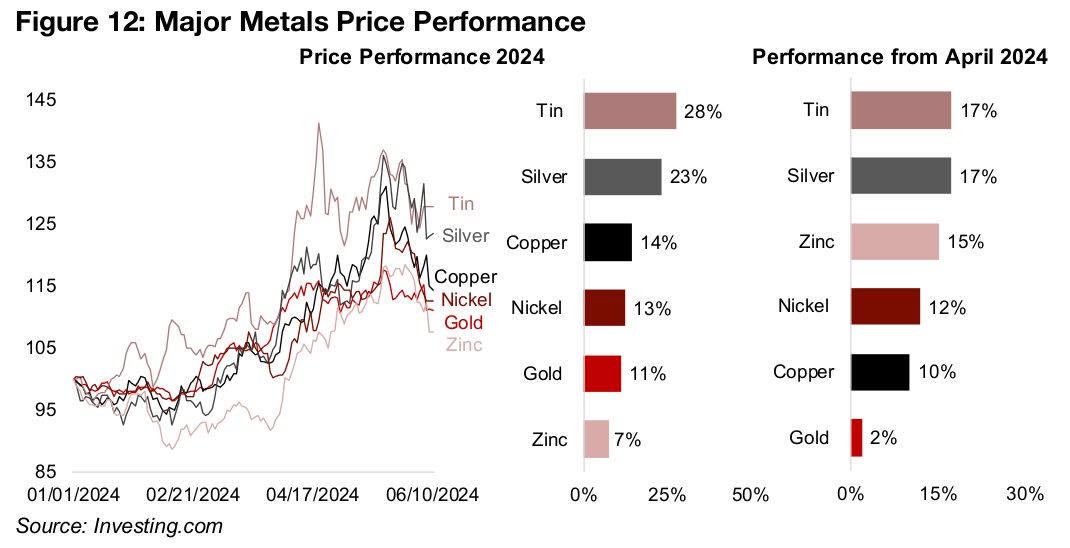
While gold, driven mainly by monetary factors, has done well in absolute terms this year, up 11%, it has been substantially outpaced by several other major metals driven much more by industrial factors (Figure 12). This has especially been the case in a rally of these metals since April 2024, in which gold participated less, rising just 2% versus double-digit gains for several of the other major metals. This strong move in the industrial metals had been viewed by the market as increasingly speculative and therefore reversed to a degree over the past two weeks. However, it has had some fundamental support, including the rising inflation concerns driving up prices for many commodities. Some specific metals also have also had underlying supply demand situations warranting a strong rise, including silver.
This has seen the silver price reach as high as US$32.3/oz this year, and it now stands at US$29.4/oz after a moderate pullback and appears to have broken out of a persistent trading range from 2021 to February 2023 averaging US$23.7/oz (Figure 13). While silver’s rise has seen the gold to silver ratio drop below the average since 2021, as shown above, using instead the longer-term average of just 53.8x suggests that silver could still have substantial room to gain versus the gold (Figure 14).
The silver market has faced a major deficit for the past three years which is expected to continue into 2024. The World Silver Institute (WSI) expects silver demand to rise 2.0% in 2024E, after slumping -6.6% in 2023, while supply will contract -0.7% after declining -0.5% in 2023 (Figure 15). This is expected to drive a widening deficit this year to -215.2mn oz from -184.3mn ounces in 2023, before accounting for ETPs.
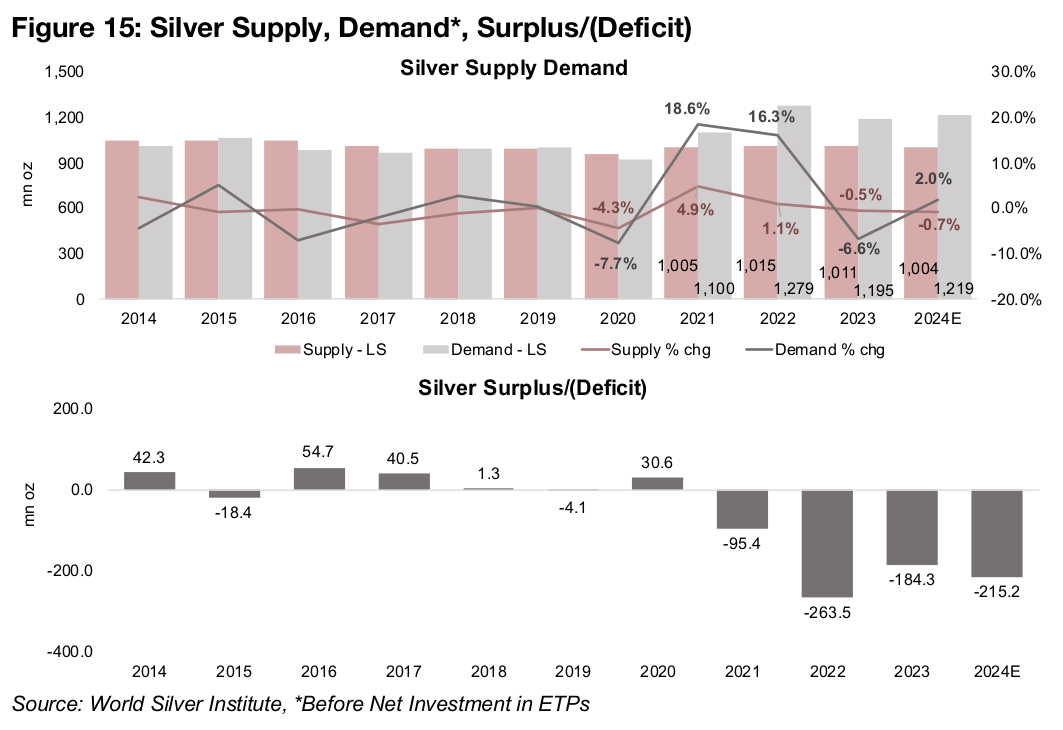
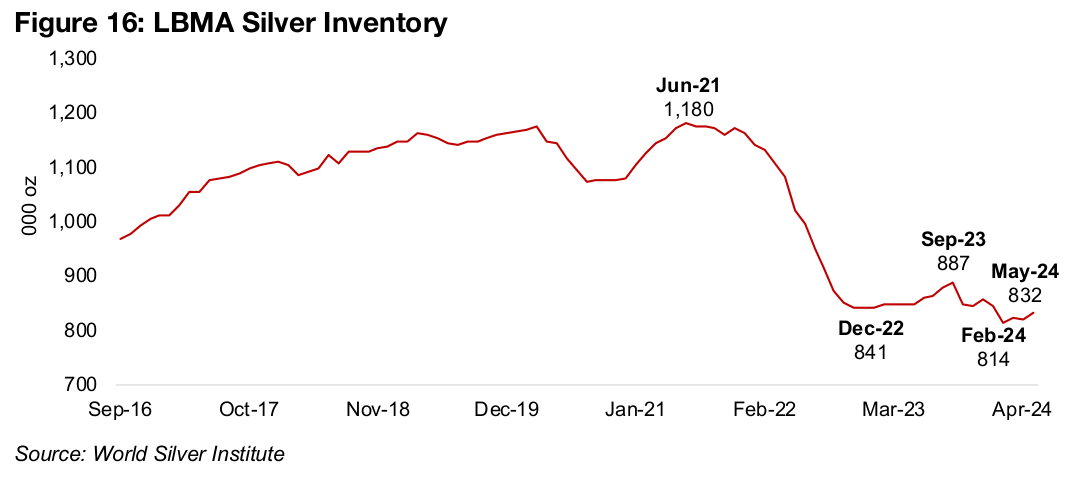
Pressure in the silver market began in 2021, when demand spiked 18.6%, after declining -7.7% in 2020, outpacing even strong supply growth of 4.9%. High demand growth continued into 2022, up 16.3%, while supply increased just 1.1%. The persistent deficit started to deplete silver inventories, with LBMA data showing a 29% decline from 1,180k oz in June 2021 to 841k oz in December 2022 (Figure 16). Inventories then flattened, helped by a -6.6% plunge in silver demand in 2023, while supply dropped -0.5%. After rising to 887k oz by September 2023, they hit new lows of 814k oz in February 2023 and recovered slightly to 832k oz as of May 2024.
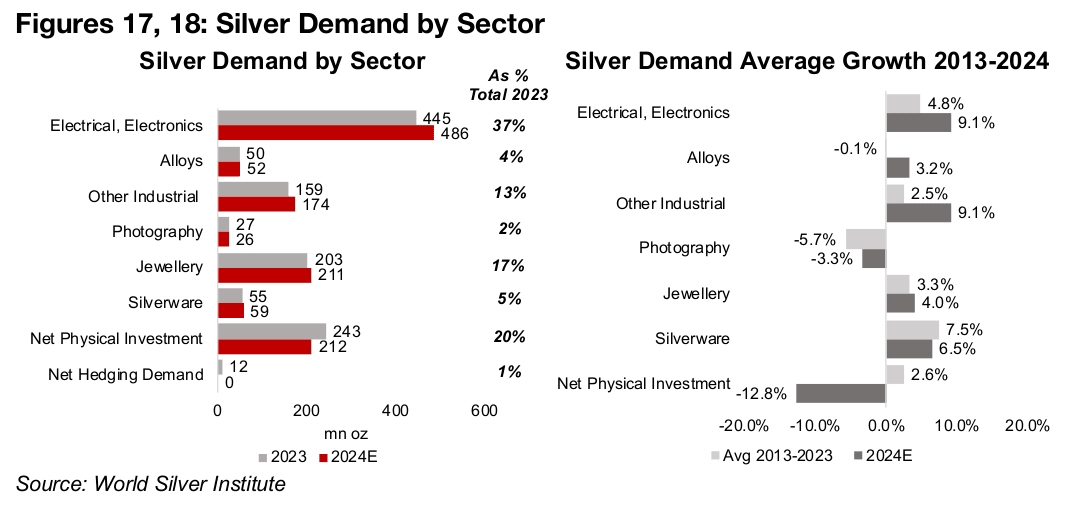
The majority of silver demand is from industrial uses, at 54%, with 37% for electrical
and electronics, 4.2% for alloys and 13.3% for other industrial uses (Figure 17). The
other main demand, totalling 37%, could be considered monetary, with jewellery at
17% and net physical investment at 20%. This leaves the metal roughly half exposed
to industrial factors, similar to copper, and half to monetary factors, like gold.
We see some risk to the level of the forecast deficit coming from the demand side,
as the chance of a global slowdown in H2/24 lingers, and could drag down both
economic, and therefore silver, demand. This could drive a narrower silver deficit and
lower price for the metal. The WSI 2024 forecasts for industrial silver demand growth
are also high versus the average from 2013-2023. Electrical and electronics growth
is forecast at 9.1% this year, versus 4.8% on average over the last decade (Figure
18). Alloy growth is estimated at 3.2% and other industrial growth at 9.1% for 2024,
versus near flat, and an average 2.5%, respectively, over the past ten years.
While the forecasts for photography, jewellery and silverware are more in line with the
ten-year average, net physical demand is expected to contract -12.8%, far below the
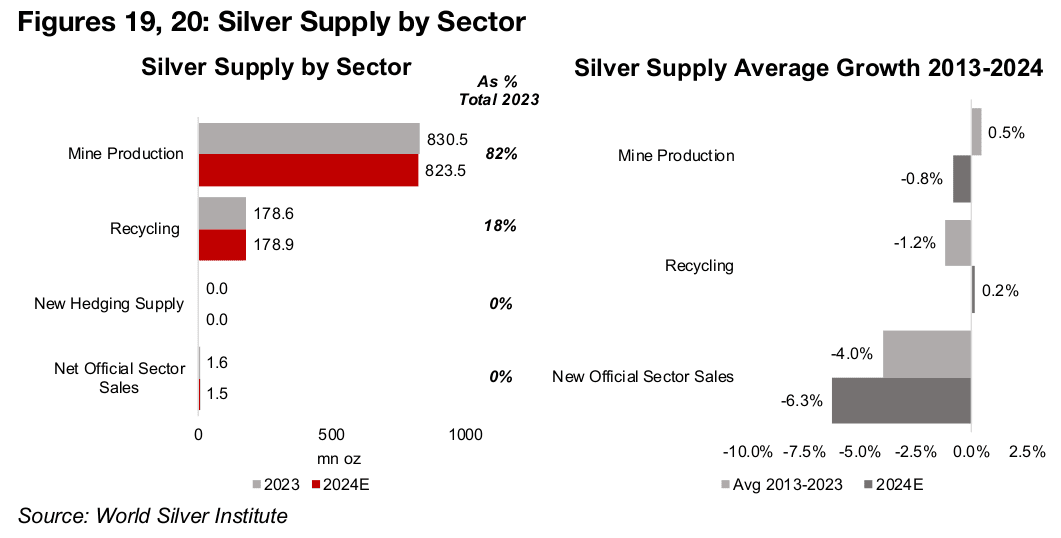
historical 2.6% average growth. On the supply side, while over 80% is from mines, a
substantial 18% is from recycling (Figure 19). The WSI expects relatively low mine
production this year, with a -0.8% contraction, versus a 0.5% gain from 2013-2023,
and recycling near flat, versus a -1.2% contraction in the prior decade (Figure 20).
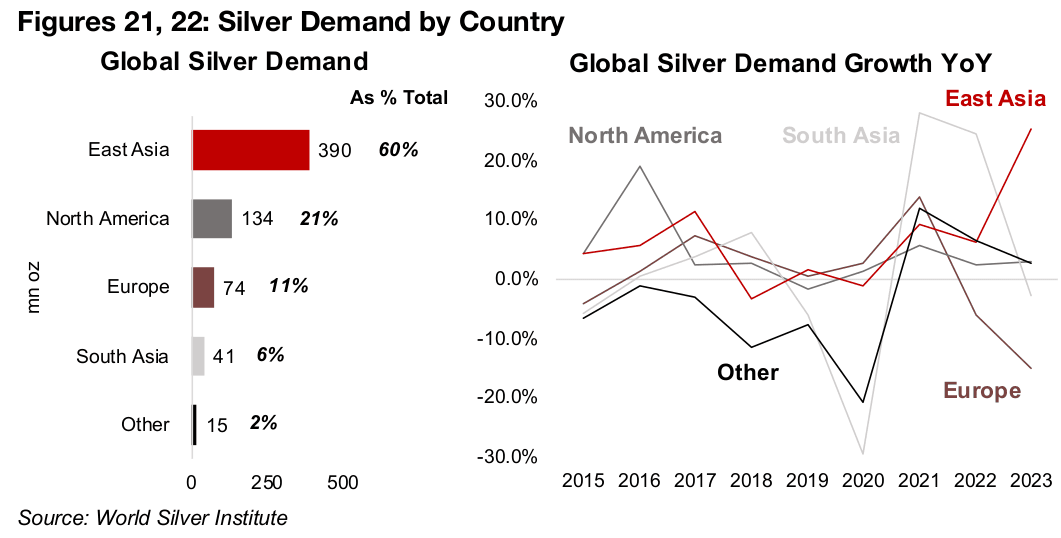
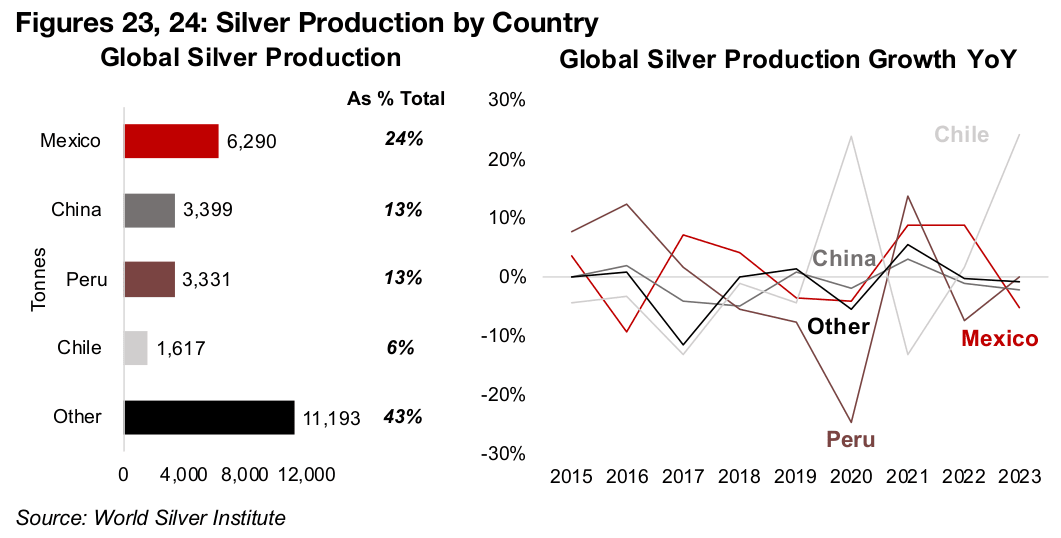
While WSI had not released detailed 2024 forecasts for silver demand or supply by country or region, it does provide data up to 2023. The big move on the demand side has been growth from East Asia, by far the largest source of global usage, at 390mn oz, or 60% of the total, with growth spiking in 2023 well above all other regions (Figures 21, 22). On the supply side, just four countries account for over half of global supply, Mexico, China, Peru and Chile, at 24%, 13%, 13% and 6% of the total in 2023 (Figure 23). The biggest growth in 2023 came from Chile, while supply from the other three countries and the aggregate of the rest of the world declined last year (Figure 24). The WSI expects supply growth for 2024 to be driven by growth in Mexico and the US, offset to some degree by declines in Peru and China.
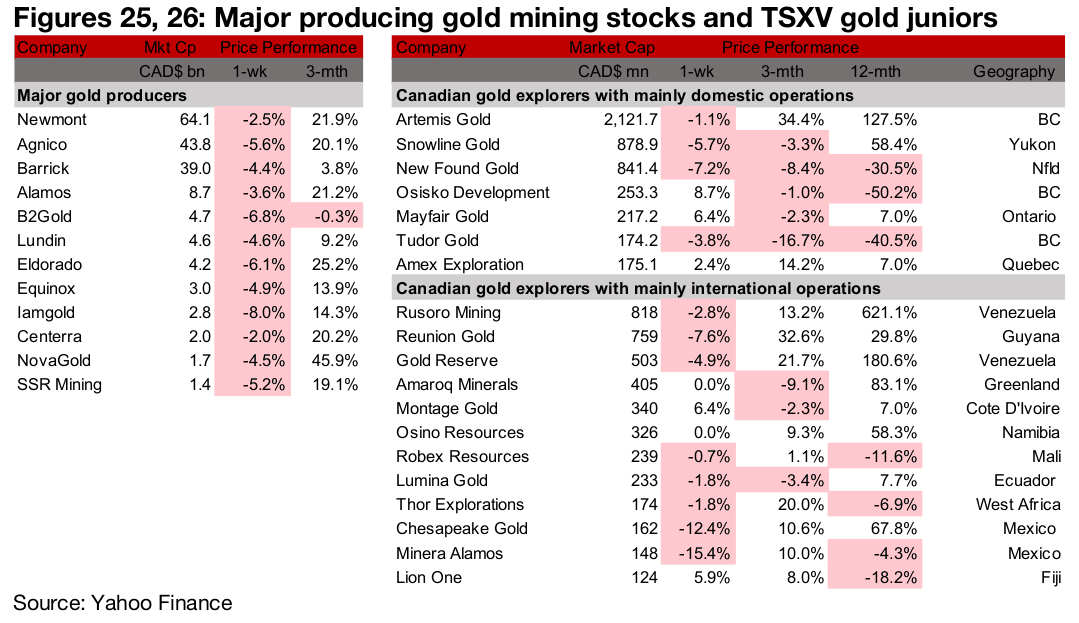
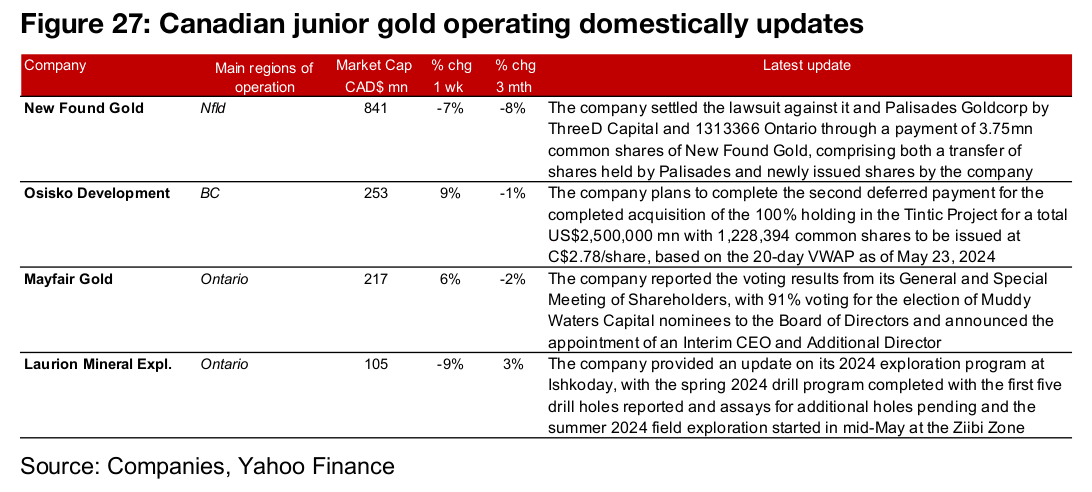
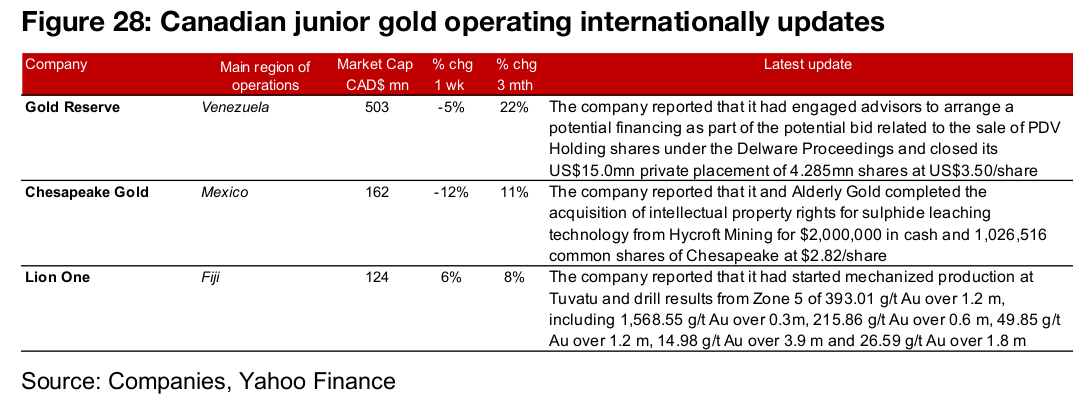
All major gold producers and majority of TSXV gold down
All of the major gold producers and the majority of the TSXV gold stocks declined (Figures 25, 26). For the TSXV gold companies operating domestically, New Found Gold settled a lawsuit through the transfer and issuance of shares, Osisko Development plans to complete the second deferred payment for the Tintic Project totalling US$2.5mn, Mayfair Gold reported that shareholders had voted for the nominees to the Board of Directors proposed by Muddy Waters and Laurion provided an update on its exploration program at Ishkoday (Figure 27). For the TSXV gold companies operating internationally, Gold Reserve engaged advisors for a potential bid related to PDV Holding shares and closed its US$15.0mn private placement, Chesapeake Gold completed the acquisition of intellectual property rights from Hycroft Mining for US$2.0mn and Lion One started mechanized production at Tuvatu and reported Zone 5 drill results (Figure 28).
Disclaimer: This report is for informational use only and should not be used an alternative to the financial and legal advice of a qualified professional in business planning and investment. We do not represent that forecasts in this report will lead to a specific outcome or result, and are not liable in the event of any business action taken in whole or in part as a result of the contents of this report.