
July 08, 2024
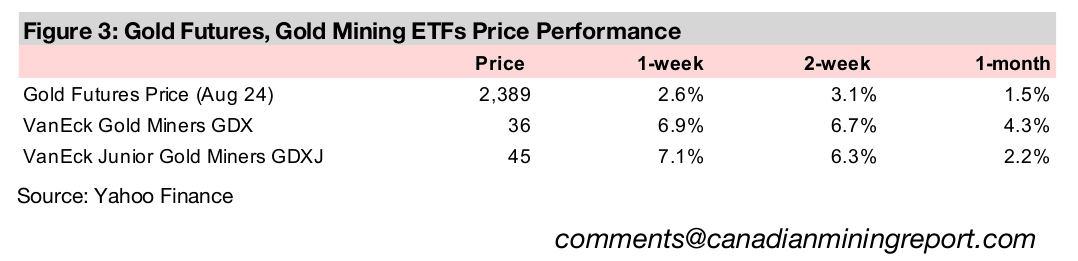
Gold rose 2.6% to US$2,389/oz, near the top of its three-month trading range, as comments by the Fed Chairman and US and EU economic data boosted market hopes that global central banks could continue an increasingly dovish stance.
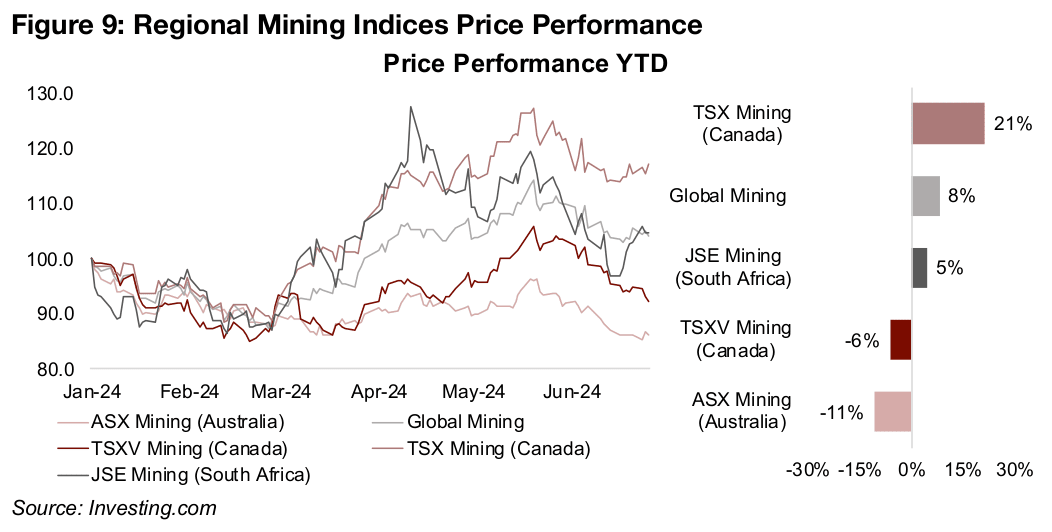
The TSX Mining Index has outperformed other regional mining indices in part because of a relatively low exposure to iron ore and while the TSXV Mining Index has underperformed, this has been driven mainly by a single huge stock, Sigma Lithium.
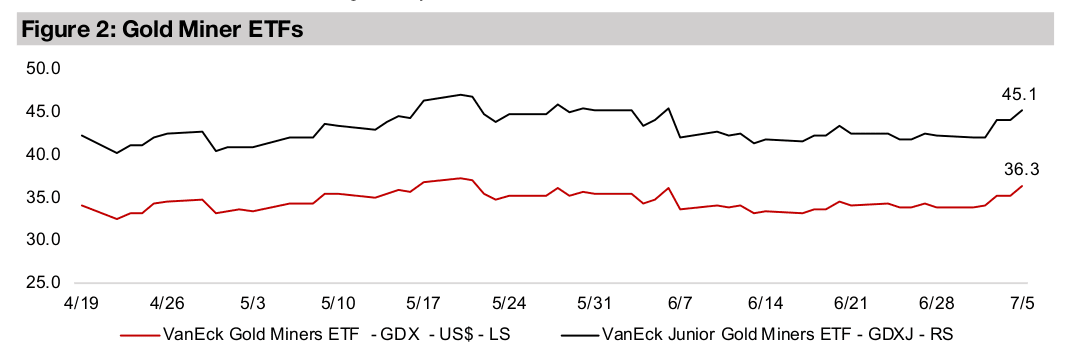
The gold stocks surged with the GDX up 6.9%, boosted by the jump in the metal and large cap equities, while the GDXJ increased 7.1% even without the support of a rise in small caps, with the Russell 2000 down, while TSXV larger cap gold mostly gained.


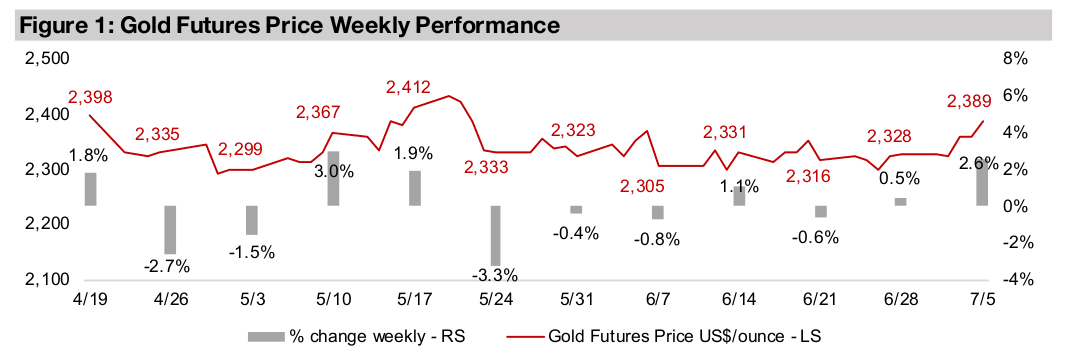
Gold rose 2.6% to US$2,389/oz, its strongest gain in eight weeks as economic news
encouraged markets that the shift to a more dovish stance by global central banks
this year would continue. Both gold and equities started to pick up early in the week
following comments by Fed Chairman Powell at the ECB Central Bank Forum,
indicating substantial progress had been made on reducing inflation but that a move
closer to their 2.0% target would still be required before any rate cuts. European CPI
inflation was also released, with the headline figure inline with expectations, declining
month on month to 2.5%, while core inflation of 2.9% was slightly above estimates.
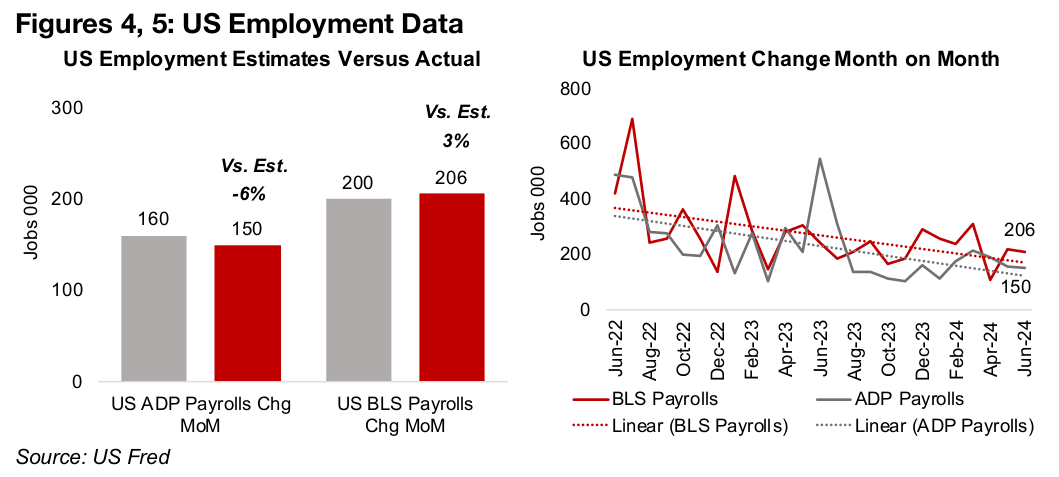
Gold and equities continued up after mid-week US employment data, which while
mixed was weak enough that markets saw it as supportive of the Fed’s apparent
softening stance on potential rate cuts. The June 2024 ADP payrolls were moderately
weaker than expected, up 150k, below estimates for 160k, although wage inflation
was down to 4.9% year on year, the lowest rate in nearly three years (Figure 4). The
rise in June 2024 nonfarm payrolls of 206k was just ahead of the 200k estimate. Both
series have trended down for the past two years, indicating a weakening employment
situation (Figure 5). This is also shown by a rising unemployment rate, which rose to
4.1%, versus a 4.0% forecast, while wage inflation increased 3.9% yoy, inline with
estimates (Figure 6). While still very low versus its long-term history, the
unemployment rate has picked up substantially from lows of 3.4% earlier this year.
While large cap equities gained, with the S&P 500 rising 1.4%, this was once again
concentrated in tech, with the Nasdaq surging 2.6%, and was not a broad risk on
move that filtered down to small caps, with the Russell 2000 off -1.2%. The rise in
the metal and large caps drove up the gold producers, with the GDX ETF rising 6.9%,
and the small cap weakness did hold back the gold juniors, with the GDXJ up 7.1%.
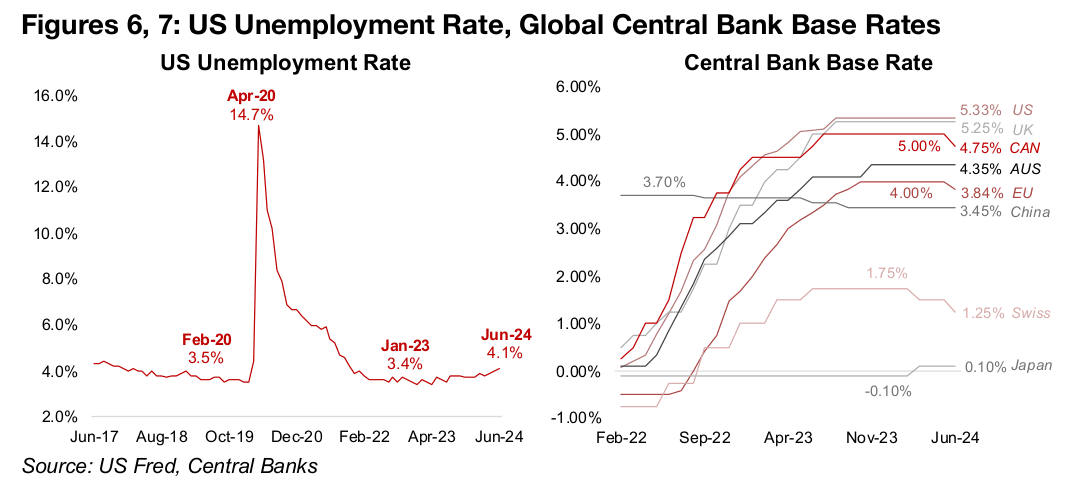
The monetary policy of global central banks has clearly become more dovish overall
in 2024, with most major banks still hiking rates well into the middle of last year. The
Swiss National Bank was the first to make a cut to its base rate in March 2024, and
has been followed over the past month by both the European Central Bank and
Canada (Figure 7). The US, UK and Australia have all held rates steady since mid-
2023 and rate cuts seem a far higher probability than any more increases.
China has been cutting rates since 2022, although very gradually, and its rates never
got to the near zero levels of most of the other major economies. Japan has been the
only central bank to hike rates this year, but the move has been a very minimal one
to just above zero. The start of a major rate cutting cycle could be a significant driver
for gold, as it implies a rising money supply, against which the metal is considered a
major hedge.
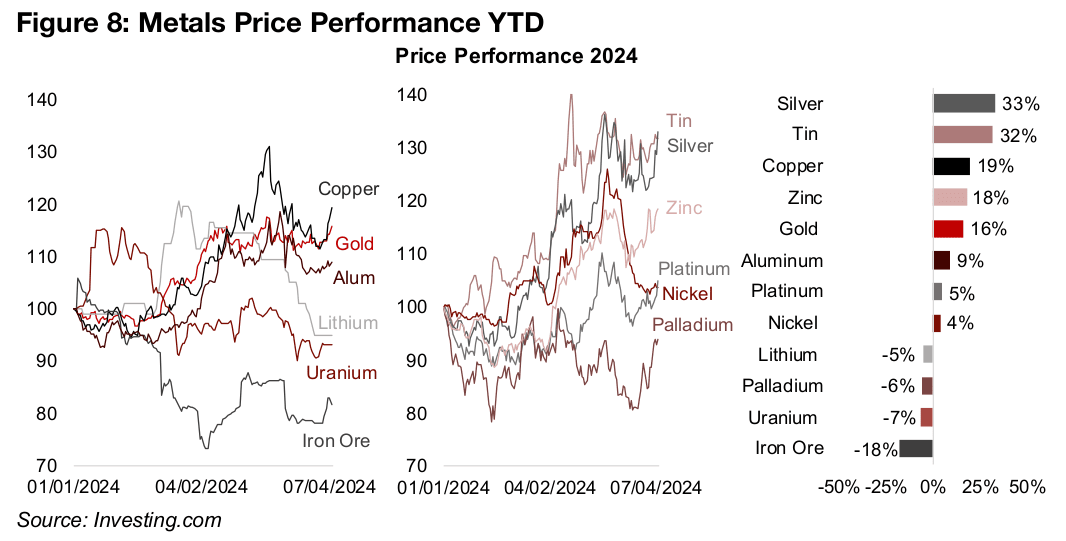
The bullishness this week carried over to the broader metals sector beyond just gold,
with most prices making a significant rebound (Figure 8). Of the three global industrial
bellwethers, both copper and iron ore saw substantial jumps and aluminum a more
gradual rise. The mid-tier industrial metals tin and zinc, which remain in tight supply
conditions, both gained, although nickel also rose even given market oversupply.
For the other precious metals, silver spiked as the market is expected to remain in a
heavy deficit for the fourth year in row. Palladium jumped substantially and platinum
more moderately on slowing EV sales, which boosted hopes for stronger demand for
combustion engine automobiles which require both metals for their autocatalytic
convertors. Even the relative laggards lithium and uranium were still flat for the week.
The strong overall performance for the metals this year has not translated into across the board gains in the mining stock indices. Markets still seem hesitant to price in the metals’ moves this year as sustainable, with mining valuations remaining near the lowest of the major global sectors, and some indices have been hit by the underperformance of specific metals. Canada’s S&P/TSX Mining Index has been the strongest regional index, up 21% so far this year, significantly outpacing the 8% gain in the S&P/TSX Global Mining Index, and 5% rise in the Johannesburg Stock Exchange Mining Index (Figure 9). Canada’s TSXV Index of junior miners has declined -6% and Australia’s ASX Mining Index lost -11%.
S&P Dow Jones reports the top ten constituents for their Global Mining, TSX Mining,
TSXV Mining and ASX Mining Indices and the FTSE for the JSE Materials Index
(Figure 9). While the exact weighting is not widely publicly available, as the indices
are market cap weighted, these top ten tend to make up the majority of the movement
in the indices given their large market caps. Combining this with the major metals
each of these companies produce gives an overall picture of what has likely been
moving these indices this year.
One critical driver of the TSX Mining Index outperformance seems to have been its
limited exposure to iron ore, which has been the weakest performing major metal year
to date. The top ten constituents of the index do not have major iron ore operations,
but do have significant gold, copper and silver exposure, and all of their prices have
surged this year. In contrast, a high iron ore weighting has been a major issue behind
the underperformance of Australia’s mining Index, with BHP, Rio Tinto and Fortsecue
having far larger market caps than other constituents and heavy exposure to iron ore.
South Africa’s materials index is also heavily exposed to iron ore, with BHP also its
largest market cap component, and its ninth largest constituent also an iron ore
company. The JSE Materials also has a strong platinum weighting, which has had
only moderate gains this year compared to many other major metals. The Global
Mining Index is mostly a combination of large TSX and ASX constituents, and
therefore its performance falls in between the two, with largest outside addition the
U.S.’s Freeport-McMoran.
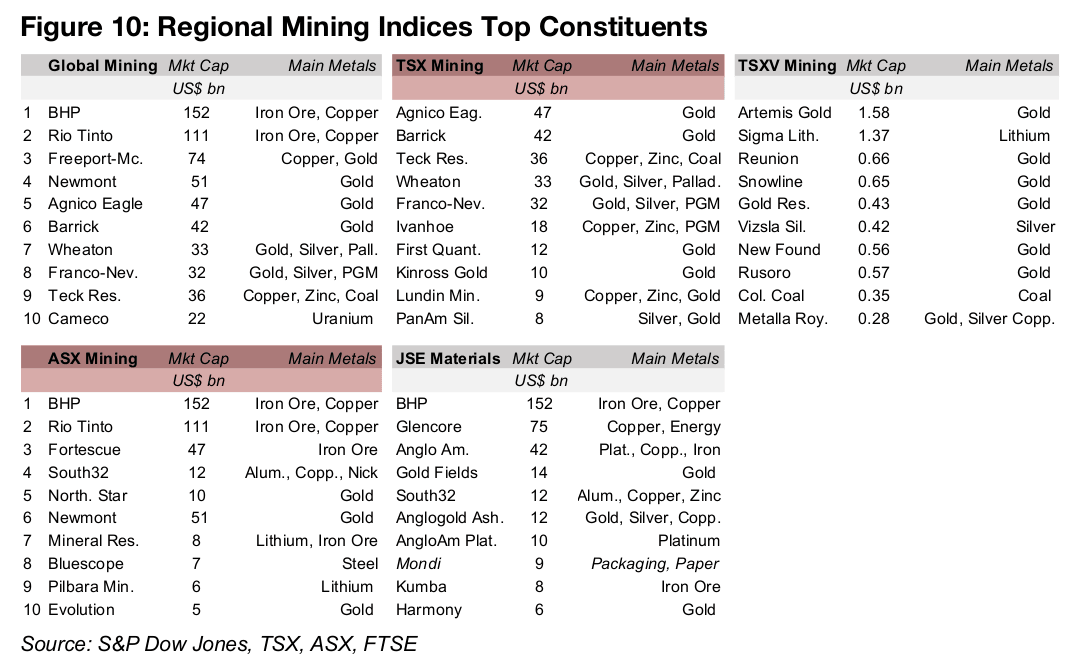
We note that there is some mismatch between the JSE Mining Index used in Figure 9 and the JSE Materials Index in Figure 10, with the constituents of the former not widely available. However, only one company in the JSE Materials top ten is not from the mining sector, Packaging and Paper company Mondi, so the JSE Materials Index likely comprises most of the top JSE Mining Index constituents.
The underperformance of the TSXV Mining Index has been a lithium problem rather
an iron ore one. Most of the major constituents are gold and silver stocks which have
benefited from the rise in their underlying metals. The one non-metal constituent of
the TSXV Mining Index, Colonial Coal, has been an upward driver for the index, with
its stock price gaining this year given a rising coal price. However, the second largest
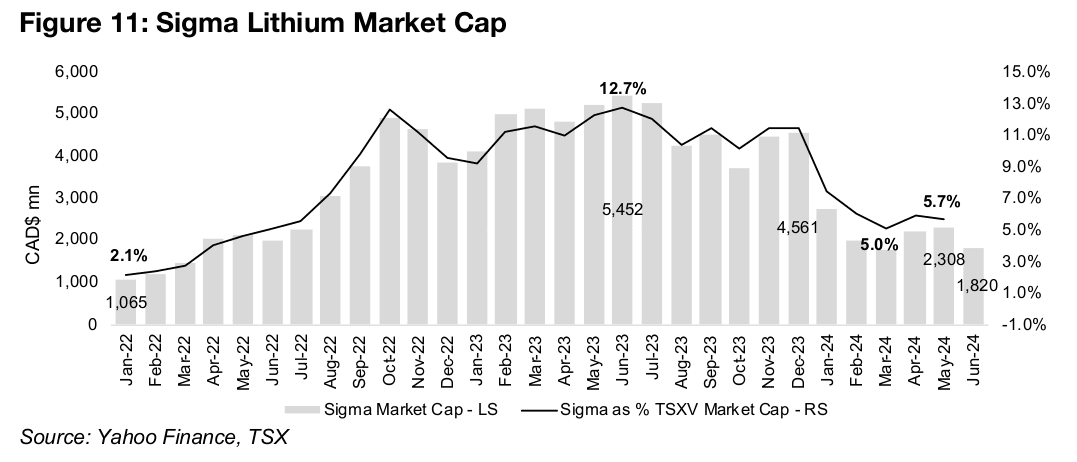
component, Sigma Lithium, has had an outsized effect over the past two years.
Sigma started 2022 at a market cap of CAD$1,065mn, or just 2.1% of the total TSXV
Mining market cap, but had jumped to CAD$5.4bn, or 12.7% of the market as of June
2023, becoming by far the largest stock on the index, as lithium surged (Figure 11).
However, the plunge in lithium since mid-2023 has reduced Sigma Lithium to a
market cap of just CAD$2,308mn, or 5.7% of the index, as of the most recently
reported TSXV Mining market cap statistics. Sigma dropped again in June 2024 to
$1.8bn, down -21% versus the end of May 2024, while the TSXV Mining Index
declined only -11% over the same period, suggesting its share of the index market
cap has likely declined further.
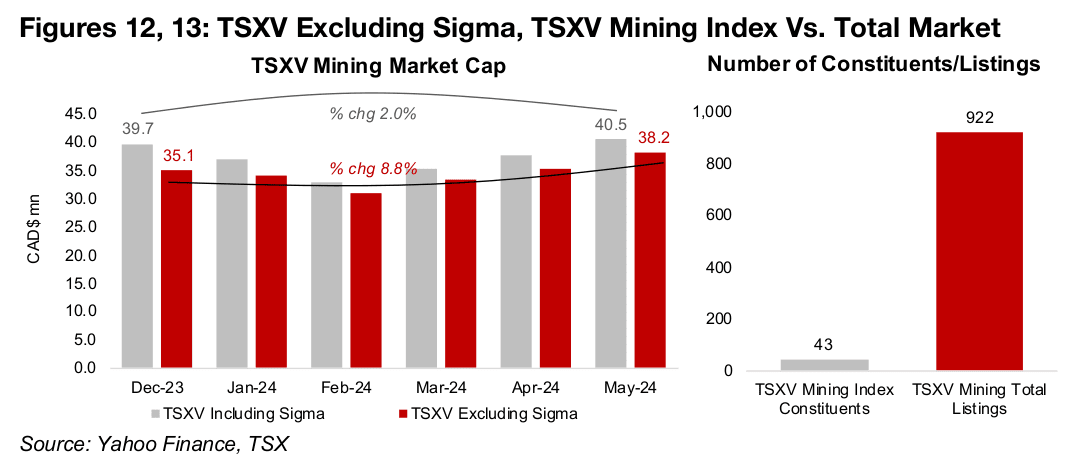
This single stock masks what otherwise would have been a decent performance for
TSXV Mining through to May 2024. The market cap of the TSX Mining Sector rose to
CAD$40.5bn as of the most recent May 2024 report from CAD$39.7bn, adding less
than 1.0$bn, for just a 2.0% gain (Figure 12). However, excluding Sigma Lithium, the
market cap would have risen from CAD$35.1bn to CAD$38.2bn, up nearly
CAD$3.0bn, or an 8.8% increase. This is a quite strong performance especially
considering the index is comprised of small cap stocks which overall have been under
pressure this year, given rising underlying risk aversion in markets, at least beyond
the tech sector.
There is some mismatch in the TSXV Index Market Cap and the TSXV Mining Index
performance from end-December 2023 to May 2024, but it is relatively minor, with
the former up 2.0% and the latter gaining 3.2%. This can be expected given that the
TSXV Mining Index is comprised of only 43 constituents in total, while the TSXV
Mining sector actually had over 900 listings in total as of the May 2024 TSX report
(Figure 13). However, these over 40 constituents comprise well over half of the TSXV
Mining market cap, and therefore lead to a relatively low performance spread
between the two sources.
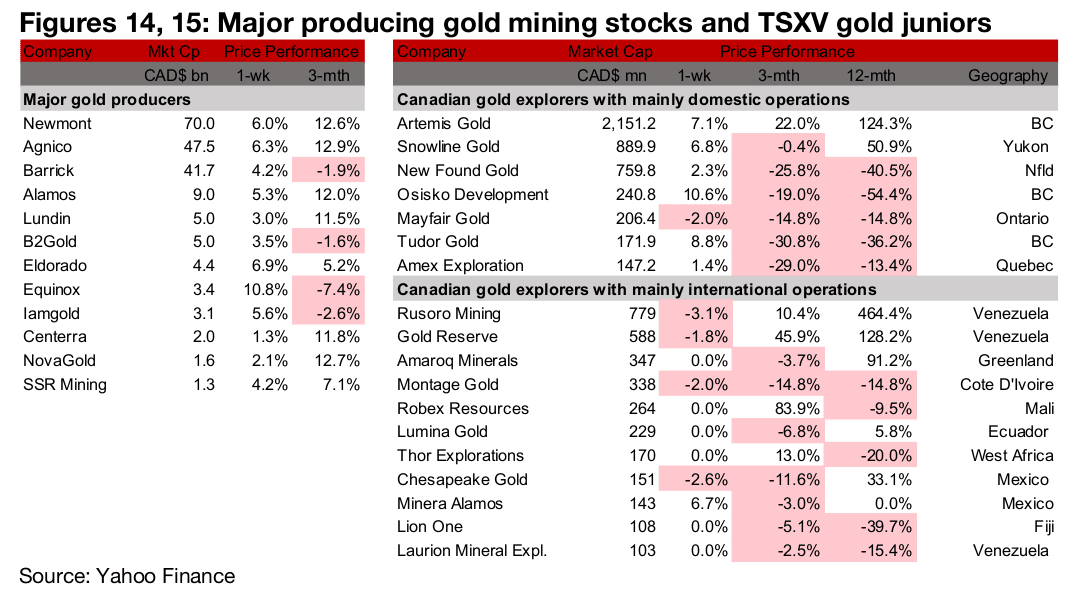
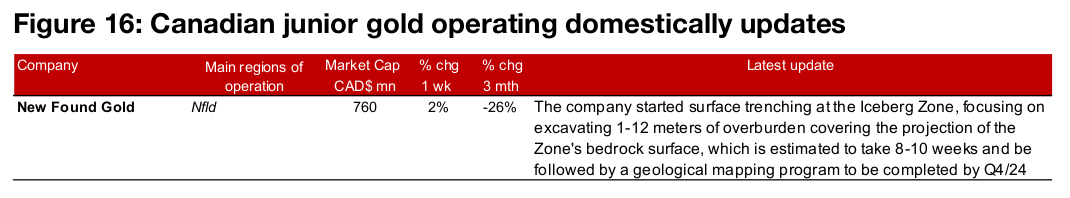
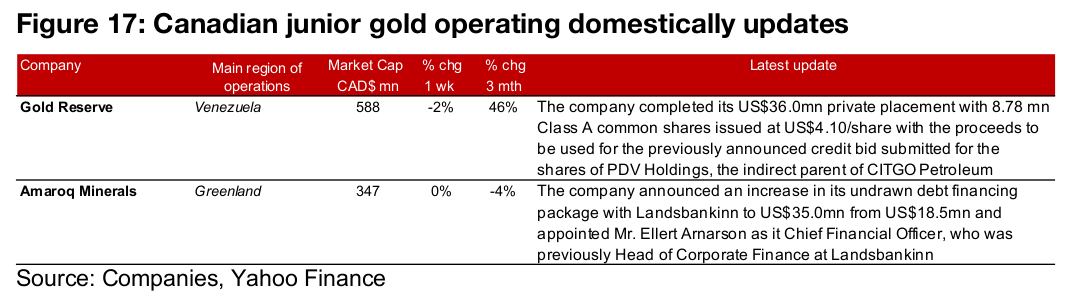
All of the large gold producers rose and TSXV gold were mostly up (Figures 13, 14). For the TSXV gold companies operating domestically, New Found Gold started surface trenching at the Iceberg Zone (Figure 15). For the TSXV gold companies operating internationally, Gold Reserve completed its US$36.0mn private placement and Amaroq Minerals announced an increase in its undrawn debt financing package to US$35.0 mn and appointed a new Chief Financial Officer (Figure 16).
Disclaimer: This report is for informational use only and should not be used an alternative to the financial and legal advice of a qualified professional in business planning and investment. We do not represent that forecasts in this report will lead to a specific outcome or result, and are not liable in the event of any business action taken in whole or in part as a result of the contents of this report.
Author
Ben McGregor authors the Weekly Roundup at CanadianMiningReport.com, providing sharp analysis of the metals and mining sector. With a talent for spotting trends, Ben distills complex market shifts into clear, engaging insights on TSXV junior miners. His weekly updates cover gold, copper, uranium, and more, blending data-driven perspectives with a knack for identifying opportunities. A vital resource for investors, Ben’s work navigates the dynamic junior mining landscape with precision.