February 17, 2025
Pullback from Parabolic Move
Author - Ben McGregor
Gold reverses from highs on US inflation surprise
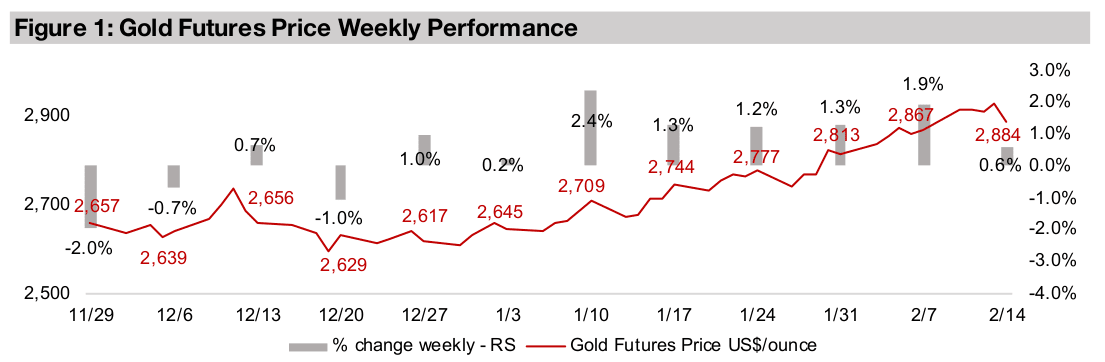
Gold rose 0.6% to US$2,884/oz after a major pullback from highs of US$2,946/oz reached mid-week as US CPI inflation for January 2025 continued to rebound, surprising to the upside, lowering expectations of further rate cuts soon by the Fed.
Market becoming ‘believers’ of gold but ‘agnostic’ on other metals
This week we look at the price performance in recent months and supply demand forecasts for the base metals versus gold, which show the market remaining ‘agnostic’ on the former but apparently finally becoming ‘true believers’ in the latter.
Producing gold still up after metal reversal, juniors down
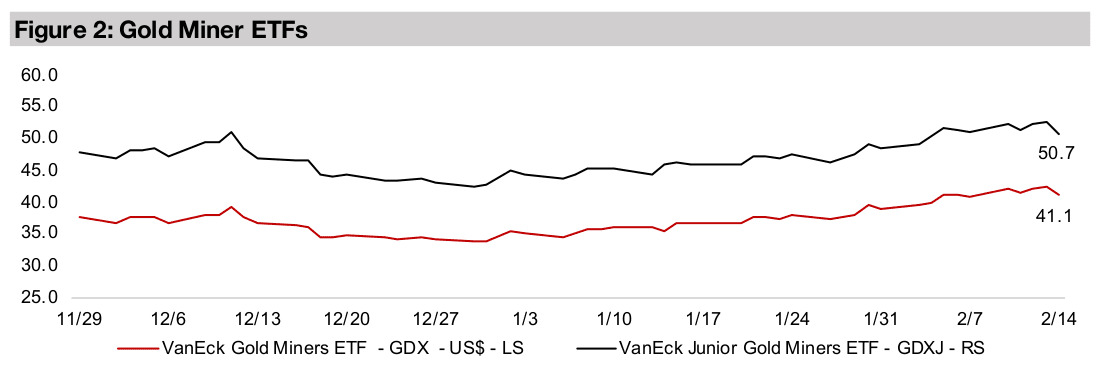
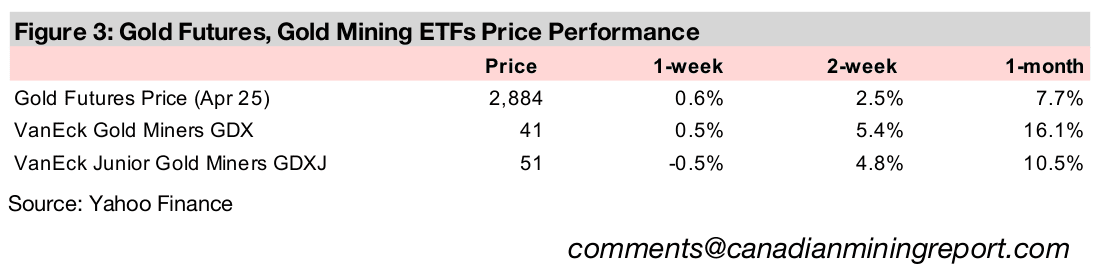
The gold stocks were resilient with the metal still seeing moderate gains even after a significant reversal from its highs, with the producing gold stocks gaining with the GDX up 0.5% and the juniors declining moderately with the GDXJ down -0.5%.


Pullback from Parabolic Move
The gold price pulled back to US$2,884/oz from a mid-week high of US$2,946/oz,
ending the week still up 0.6 %. The reversal came as the US CPI Index for January
2025 came in ahead of expectations, with higher inflation more likely to see the US
Fed hold off on further rate cuts. With many other major countries continuing to cut,
this implies relatively high US rates and in turn a potentially strong US dollar and bond
yields, with both these tending to move inversely to the gold price.
Headline US CPI inflation was 3.0%, ahead of consensus estimates of 2.9%, up from
2.9% in the previous month and at its highest level since May 2024. Core inflation
rose to 3.3%, has remained consistently above the Fed’s 2.0% target, and in recent
months has shown the first sign of a gradual increase, after a steady decline from
mid-2022. This has boosted market concern of a resurgence of inflation, and is very
likely a major factor driving gold recent gains, along with a still rising global money
supply and the potential impact of new tariffs.
Such a drop in the gold price was to eventually be expected on some catalyst, given
the parabolic move in the metal price over the past two months, up US$300/oz from
the most recent lows of US$2,629/oz in late December 2024 to the new all-time highs
reached this week. However, this pullback actually does not stand out in absolute
size or percentage terms versus previous gold bull markets, with much more severe
declines typical, followed by the metal going on to set new highs.
We considered last week whether the gold bull market could be maturing and
concluded that it may be early in the final phase and that a top is still likely many
months, or even a year or more away. The retail market only really began to get behind
the gold trade in H2/24 and we expect that it is still building momentum. We still see
more than enough economic and political disruption currently to continue to drive up
the gold price this year.
Market remaining agnostic on many metals since Q4/24
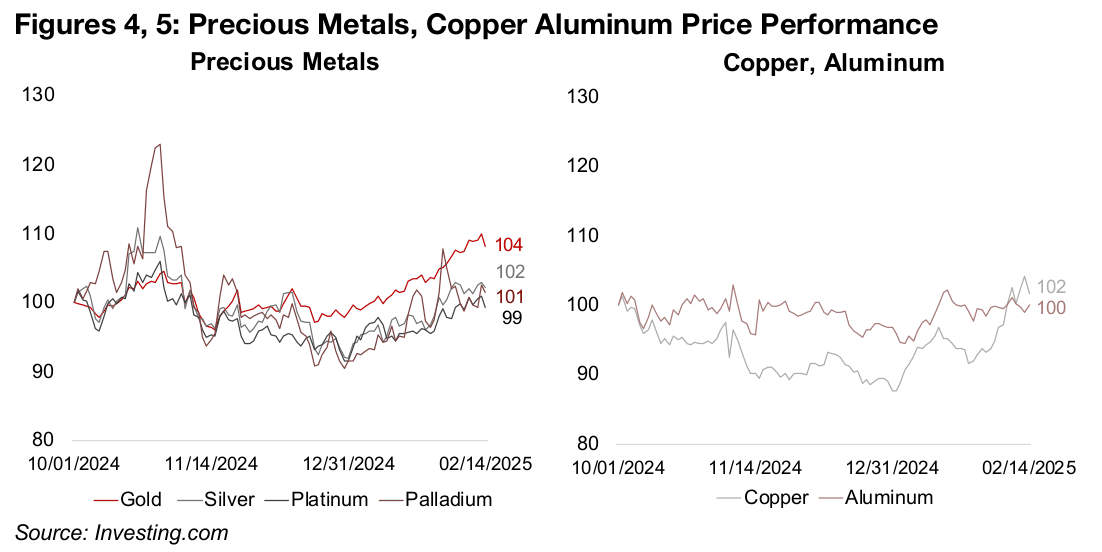
While the wider market seems to be finally becoming ‘true believers’ in gold after a long period as ‘atheists’, it has remained comparably agnostic recently on most of the rest of the major metals. While gold has gained 8% since October 2024 and had the only clear uptrend since mid-2024, other precious metals have been near flat, with silver up 2%, palladium gaining 1.5% and platinum down -1% (Figure 4). Copper and aluminum have also not moved much, up 2% and 0.1% respectively (Figure 5). With the exception of gold, all these metals have most of their demand driven by the industrial cycle. The lack of any real trend either way in these other metals therefore shows that the market remains unclear on which way the global economy will go this year, but they seem to be content to hedge risk by increasing their holdings of gold.
The relatively muted move in silver has occurred even as the supply demand balance for the market is expected to move into its fifth year of major deficit. While this might be expected to boost the silver price, the imbalance is expected to improve in 2025, with the deficit contracting to -150 mn oz in 2025 from -215 mn oz in 2024 (Figure 6). However, the market may already have priced this lower deficit forecast into silver and require either unexpectedly high supply or weak demand to drive up the price substantially. Silver has a major component of its demand from industrial factors, similar to copper, and the probability of a shock from this seems weighted to the downside, given the IMF forecasts a slowdown in growth in 2025 for many major countries. This compares to almost entirely monetarily-driven gold, which is less likely to take a hit to its price from a weakening industrial cycle.
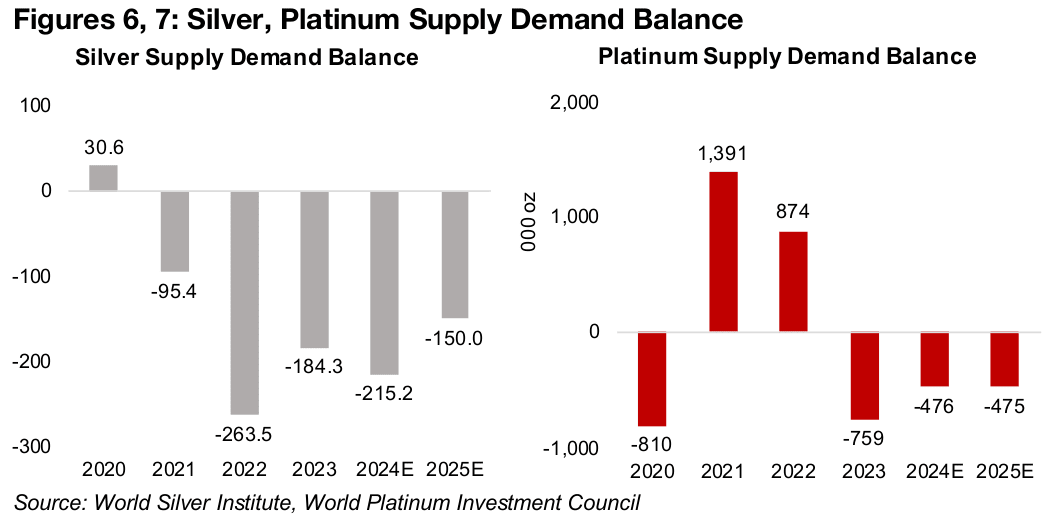
There is also expected to be a large deficit for platinum in 2025, of -475k oz, although this is flat from -476k oz in 2024 (Figure 7). As with silver, the expected deficit has not done much to support the metal price in recent months, and may be largely priced in. The market may also be expecting the auto industry to weaken, with platinum’s use in autocatalysts the largest proportion of its demand. Global auto sales growth is currently forecast to rise only by a few percent in 2025.
Major 2025 deficits for copper, aluminum not boosting prices
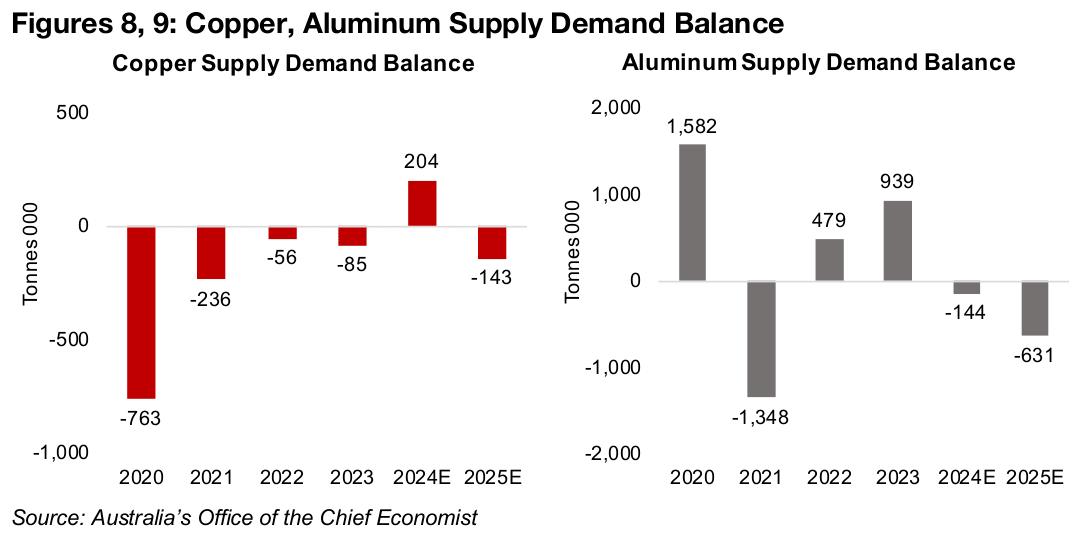
The lackluster move in the copper price since H2/24 can be explained partially by a
move to a 204k tonne surplus in 2024, as estimated by Australia’s Office of the Chief
Economist (AOCE), after a deficit of -85k tonnes in 2024 (Figure 8). However, the
AOCE forecasts a slide into a -143k deficit for 2025E, which if realized, might be
expected to boost the copper price. However, the market may be pricing in a worse
decline in demand than the AOCE and expecting a slowdown in industrial growth.
Assuming the market is not pricing in an offsetting supply shortfall this could lead to
the relatively flat copper price action seen in recent months.
For aluminum, after a major surplus in 2022 and 2023, the AOCE forecasts a smaller
-144k tonne deficit for 2024, widening to -631k tonnes in 2025 (Figure 9). Similar to
copper, if such a major deficit is realized, it could drive up the aluminum price
substantially. However, there again may be a situation where the market is not pricing
in as high as level of demand as the AOCE. Overall we see the chance of a surprise
in broad industrial demand, for which copper and aluminum are both major proxies,
as weighted to the downside. This could keep pressure on these two metals this year,
in the absence of a major shortfall shock on the supply side.
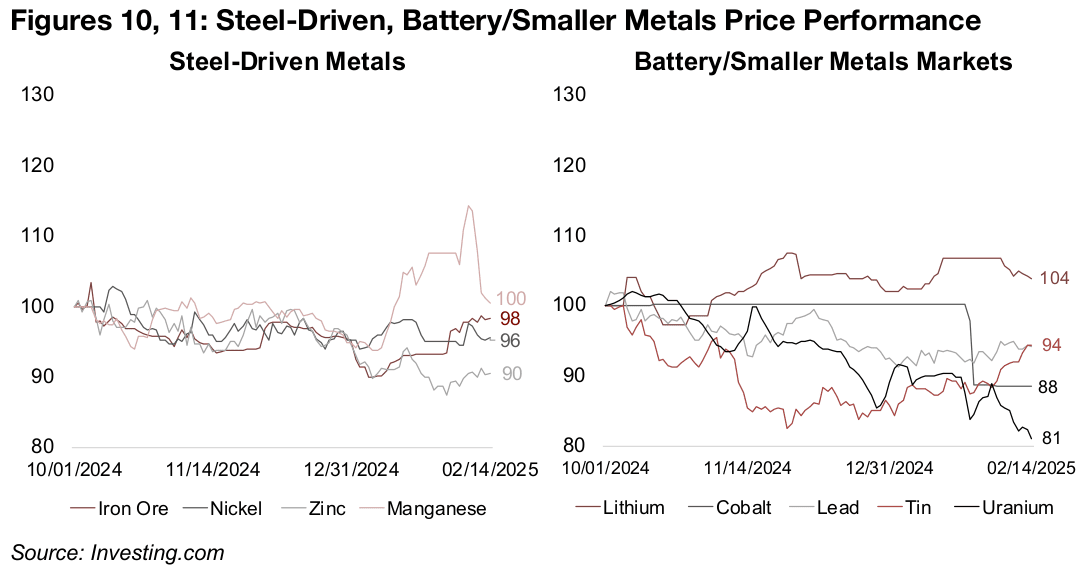
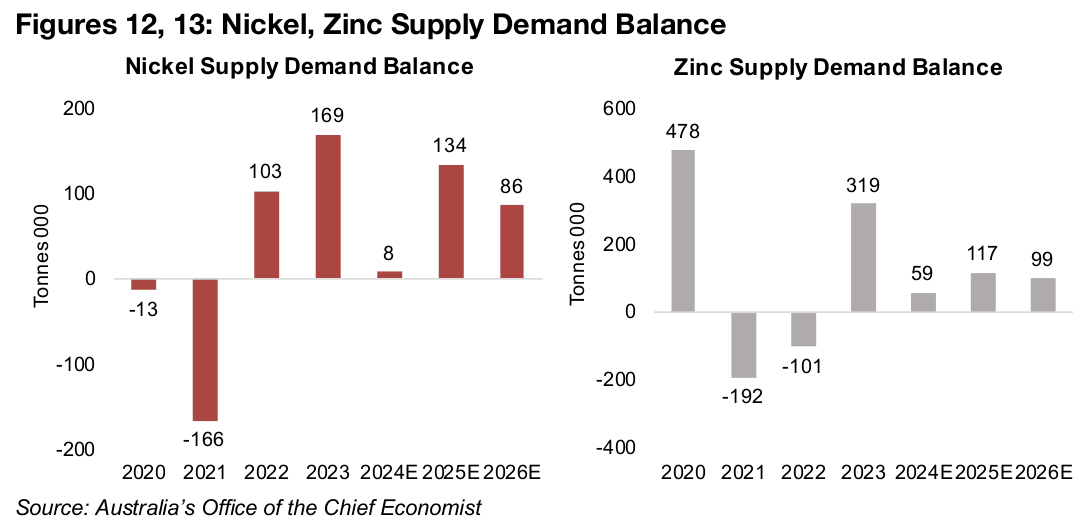
Most of the metals that have the majority of their demand for use in steel have also been quite flat since Q4/24 on the continued slowdown in this industry (Figure 10). Iron ore, which is the largest of these four markets, is down 2%, with steel accounting for nearly all of its demand. Zinc’s -10% decline has been the largest of the four, as it is expected to have its third consecutive year of surplus in 2025, at 117k tonnes, nearly twice the 59k tonnes in 2024, and a 99k tonne surplus in 2026 (Figure 13). Nickel is down -4%, as the near balance achieved in 2024 by the market after two years of major surpluses is expected to fade into oversupply of 134k tonnes in 2025 and persist in 2026 at 86k tonnes (Figure 12). While the manganese price saw some brief strong gains early this year, these have reversed, leaving it flat since Q4/24.
Prices down overall for battery and other smaller metals markets
Most of the battery metals and other smaller metals markets have seen price declines
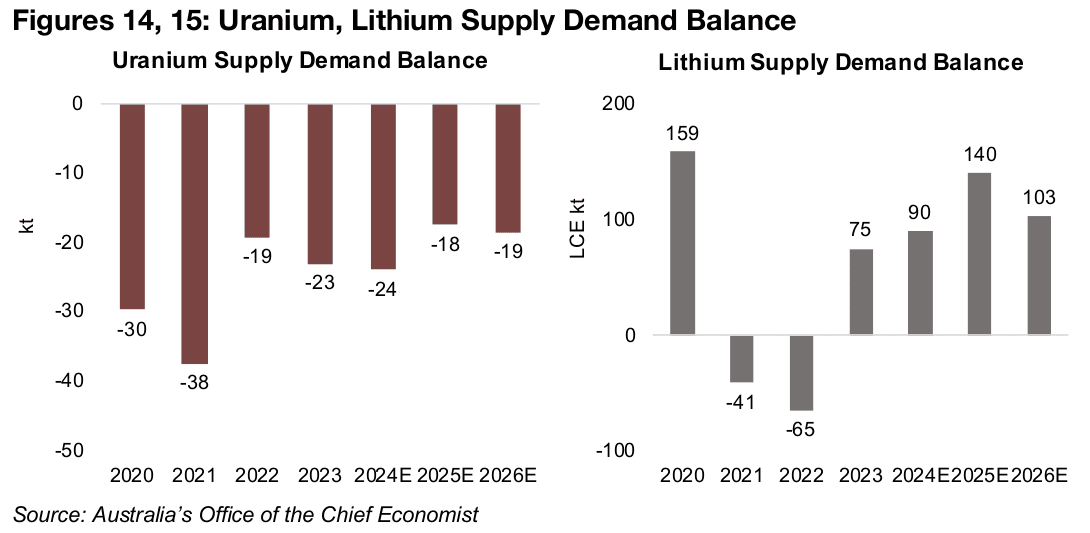
since Q4/24, with lead and tin down -6%, cobalt -12%, uranium -19%, and only
lithium gaining, up 4% (Figure 11). Uranium has weakened the most, down nearly
20%, as it continues to reverse a parabolic move in 2023 and 2024. While the AOCE
does show a persistent supply deficit for the metal, this does not include recycled
material, which offsets most of this shortfall. A strong secular move towards global
government support for nuclear power which will drive strong uranium demand
seems likely to continue. However, the uranium price did enter a rather euphoric
phase that had likely started to frontload the future gains for the metal, and this seems
to have been replaced with more moderate expectations for immediate demand.
The lithium price seems to finally be flattening after an over two-year slump. There
was a large surplus of 90kt of lithium carbonate equivalent (LCE) in 2024, and this is
expected to widen to 140k in 2025 (Figure 15). The deficit has been driven especially
by a major expansion of lithium chemical production capacity in China, which
accounts for about 80% of global supply. There has also been a slowdown on the
demand side, with the rate of EV sales declining. However, the market may be viewing
the 87% plunge in lithium from its November 2022 peak as having sufficiently priced
in these developments.
The cobalt price is down -12%, and similar to lithium, is driven by EV battery demand and saw a surge in recent years before a major collapse. The tin price, which has very broad-based demand across many sectors, similar to copper, is down -6% and also continues a reversal from a major spike. Lead is also driven by battery demand, but not for EVs, and therefore has not been hit by the issues in that sector, and is down only -6%.
Clear split between gold, silver stock ETFs and rest of sector in 2025
The split between gold and the other metals stocks since Q4/24 has been reflected in the major mining ETFs. The GDXJ ETF of junior gold is up 1.8% and GDX ETF of gold producers has risen 1.6% since Q4/24, but the base metals and other mining ETFs are all down by over -10% (Figure 16). While the silver price has underperformed gold, the ETF of silver producers has outperformed, up 2.8%. The silver stocks could be pricing in an eventual price convergence of the two metals, with the gold to silver ratio 11.2% over its average from 2021-2025, and a mean reversion potentially implying a rise in the silver price.
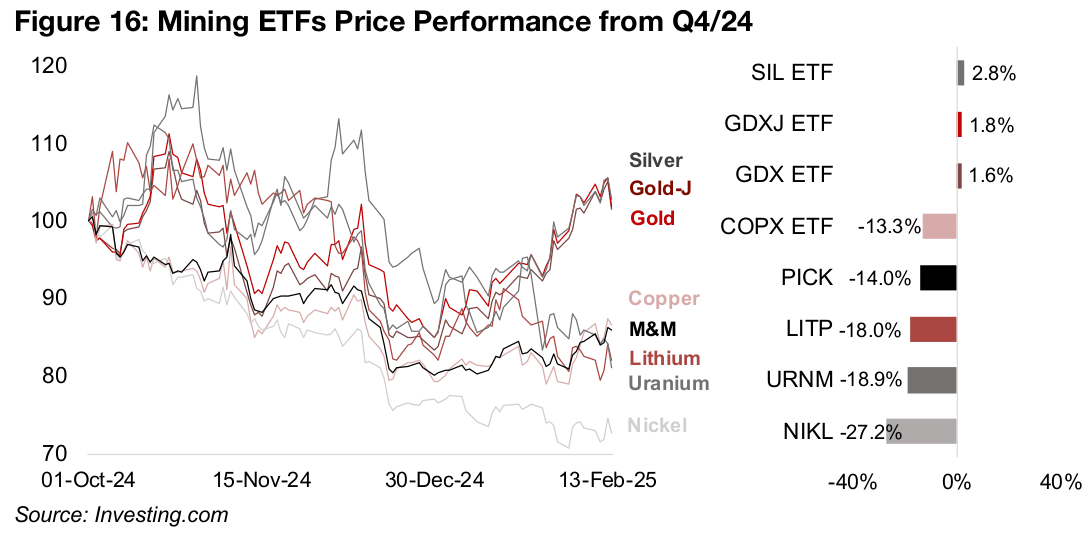
For the base metals the COPX ETF of copper producers is off -13.3%, even with the
metal near flat, as the market may be pricing into stocks potential weakness in the
industrial cycle. Similarly the PICK iShares Global Metals & Mining ETF, which has
high exposure to stocks especially driven by iron ore, but also aluminum, may be
pricing in a downturn in these metals that diverges from the recent flat price action.
The market could also be forecasting rising costs for these companies on a continued
pickup in inflation, which could reduce margins, even if the metal prices hold up.
The factors behind the weakness in the other sector ETFs is more clear, given the
negative sentiment on their underlying metals. The LITP ETF of lithium producers is
off -18.0%, with the market still skeptical on the sector after a nearly 90% plunge in
the metal, even though it has flattened recently. The URNM ETF of uranium producers
has declined -18.9%, which is similar to the decline in the metal price, and the NIKL
ETF of nickel producers is down -27.2%, which is far below the only -4% decline in
the metal price.
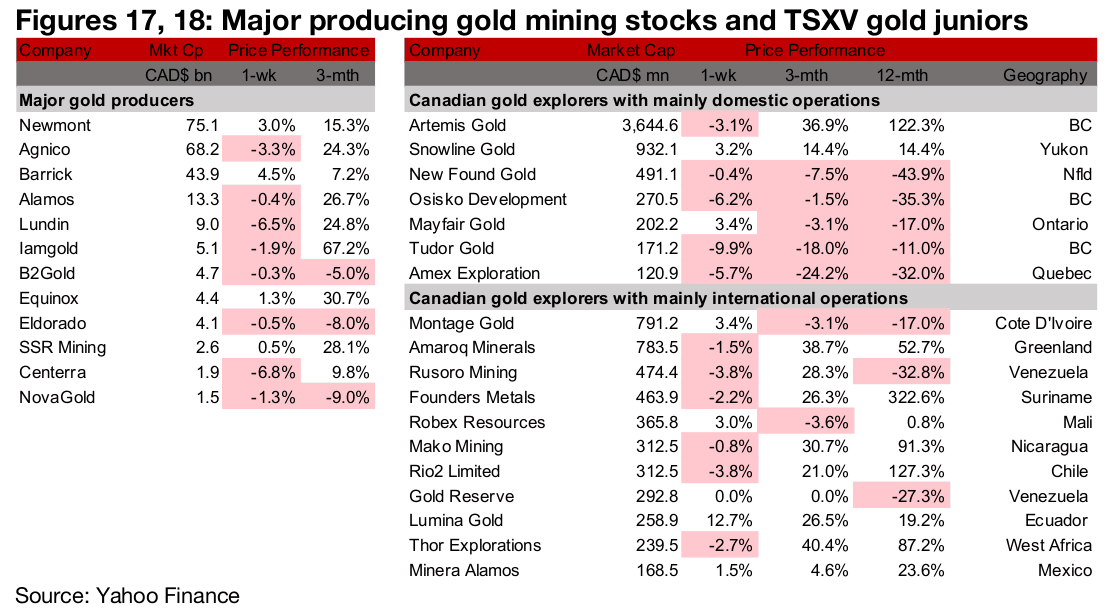
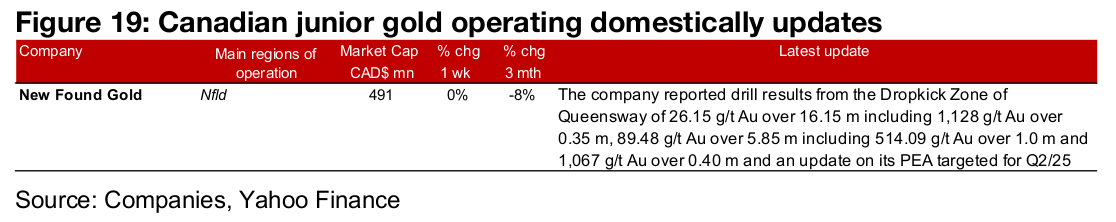
Major gold producers and TSXV gold mainly down
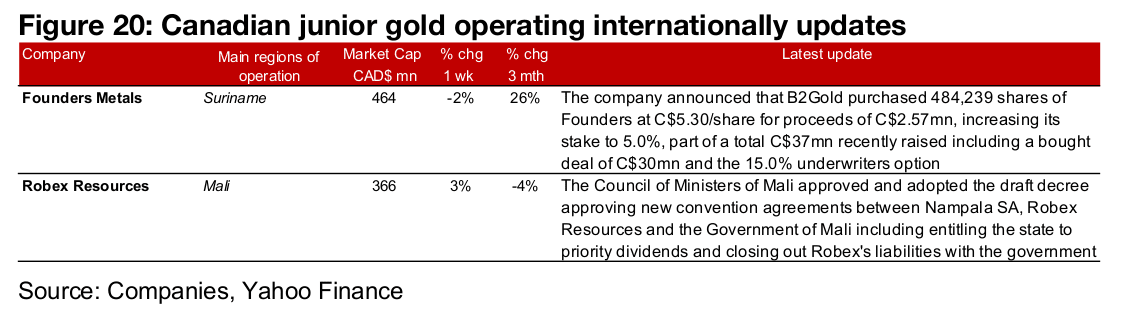
Most of the major gold producers and TSXV gold declined on the pullback in the gold price (Figures 17, 18). For the TSXV gold companies operating domestically, New Found Gold reported drill results from the Dropkick Zone of Queensway (Figure 19). For the TSXV gold companies operating internationally, Founders Metals saw B2Gold increase its stake in the company and Robex Resources reported that the Mali government approved a decree entitling the state to priority dividends which will close out its liabilities with the company (Figure 20).
Disclaimer: This report is for informational use only and should not be used an alternative to the financial and legal advice of a qualified professional in business planning and investment. We do not represent that forecasts in this report will lead to a specific outcome or result, and are not liable in the event of any Icon and logotype combination business action taken in whole or in part as a result of the contents of this report.