August 14, 2023
Precious Metals Outperform
Author - Ben McGregor
Gold up as markets remain edgy
The gold price rose 0.3% to US$1,946/oz and has held in the mid-US$1,900s for five weeks as markets continue to remain edgy, with the Nasdaq, which had been driving the equity rally since March, now down nearly ten percent from its recent peak.

Precious Metals Outperform
Gold rose 0.3% this week to US$1,946/oz, with the price holding around the mid-US$1,900s/oz for the past five weeks. Markets still remain edgy, as they balance the
fear of an extended period of high rates with hopes that the Fed may start pulling
back, as the economic data remains mixed. US CPI inflation for July 2023 reported
this week ticked up slightly to 3.3% from 3.1% in July 2023, the first month on month
rise in a year, which could be taken as a negative by markets betting on a continued
decline in inflation. However, core inflation, which excludes volatile food and energy
prices, and is more of a focus for the Fed than headline inflation, declined for the
tenth consecutive month, to 4.70%, somewhat offsetting the overall inflation rebound.
On the whole, the equity markets took the news somewhat negatively, with the S&P
500 down -0.61% for the week and the Russell 2000 small cap index off -1.74%. The
GDX ETF of producing gold stocks and GDXJ ETF of junior gold stocks were both
down -0.7%, showing a slight underperformance of the relative index for the GDX
and considerable outperformance for GDXJ. The bullish sentiment especially of
Q2/23 seems to be fading, with the Nasdaq, which had been the main driver of the
market rally since March 2023, now off -9.4% from its late-June 2023 peak, and the
S&P and Russell 2000 sliding from late-July 2023 highs (Figure 4).
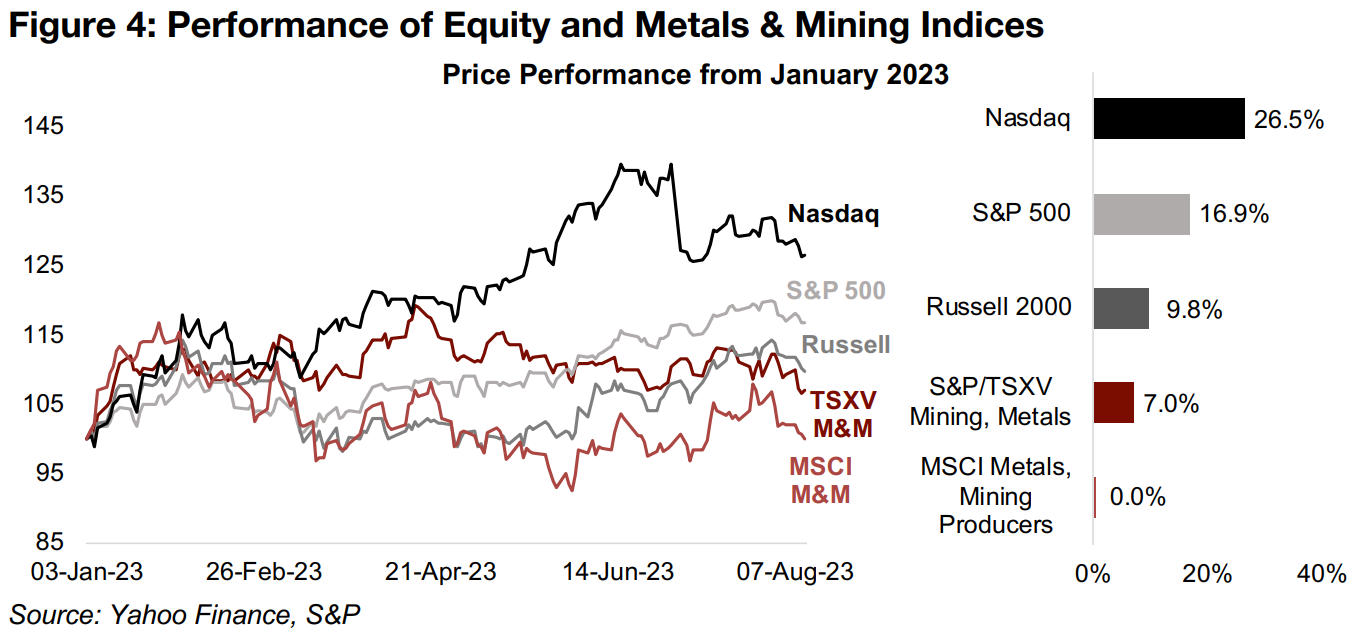
While even with the pullbacks, the performance of the Nasdaq and S&P remain strong this year, up 26.5% and 16.9%, the valuations of these indices remain lofty in historical terms, and therefore still risky in our view. Small caps have had a much more moderate gain, with the Russell 2000 small cap index up just 9.8%, providing evidence of some risk aversion by markets. The S&P/TSXV Metals and Mining Index, up 7.0%, has underperformed the Russell 2000 moderately, but far outpaced the MSCI Metals and Mining Producers Index, which has had a flat performance.
Large sector weight differences for MSCI and TSXV Metals & Mining Indices
The underperformance of the MSCI World Metals and Mining Producers Index versus
the S&P/TSXV Metals and Mining Index can be explained by the major differences in
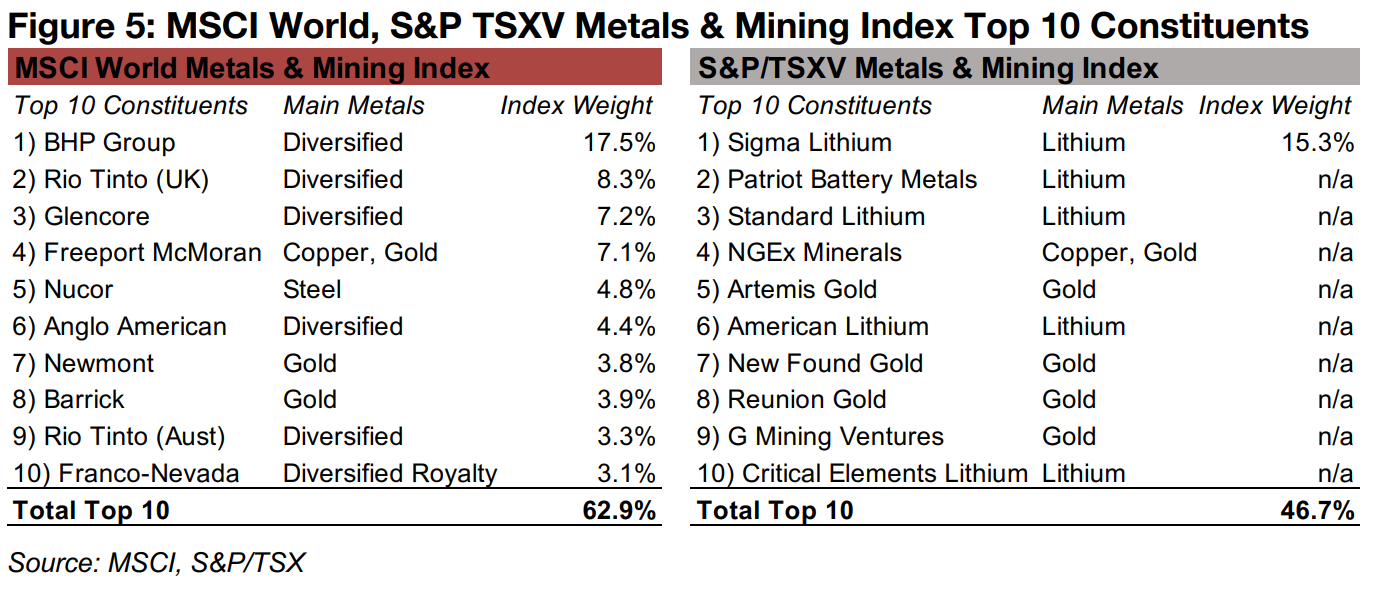
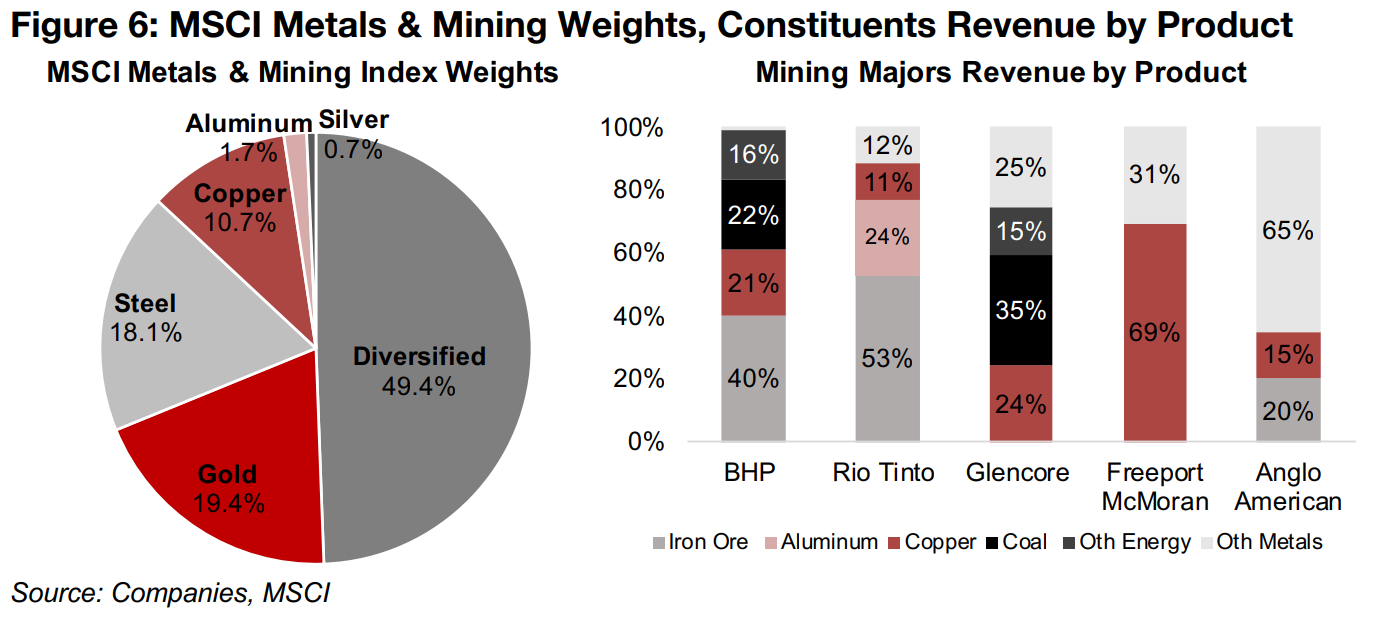
their composition, shown by their top ten constituents (Figure 5). The MSCI Metals &
Mining Index has a wider exposure to a range of metals, building materials and the
energy sector than the TSXV Metals and Mining Index (Figure 6), which is mainly
weighted to gold, lithium and copper. Half of the MSCI Metals & Mining Index is
diversified industry giants, and there is considerable exposure to copper from
Freeport McMoran, steel from Nucor and gold from Newmont and Barrick.
For the TSXV Metals and Mining Index, only the weight of the top holdings, Sigma
Lithium, at 15.4%, and the top ten in aggregate, at 46.7%, are provided, but this is
enough to give us a sense of the overall index. Half the top ten are lithium companies,
four gold, and one copper, and our tracking of roughly the Top 50 stocks in the index
shows the heavy lithium-gold-copper concentration likely continues below the Top
Ten. While this heavy exposure to the lithium price is a concern given the metal's
price decline this year, it has only returned to its still relatively high late-2021 level.
Also, many of the TSX lithium stocks did not seem to have priced in the lithium surge
in 2022, perhaps because the market considered this a very temporary phenomenon,
and many of these stocks continue to hold up even as the lithium price declines. The
gold price has held up reasonably well in 2023, offering further support for the TSXV
Metals and Mining Index, with its large percentage exposure to the sector, in contrast
to the declines in copper, iron ore, coal, aluminum, and steel that have likely been
curbing the relative performance of the MSCI Metals and Mining Index.
Major metals' markets overall continue to cool
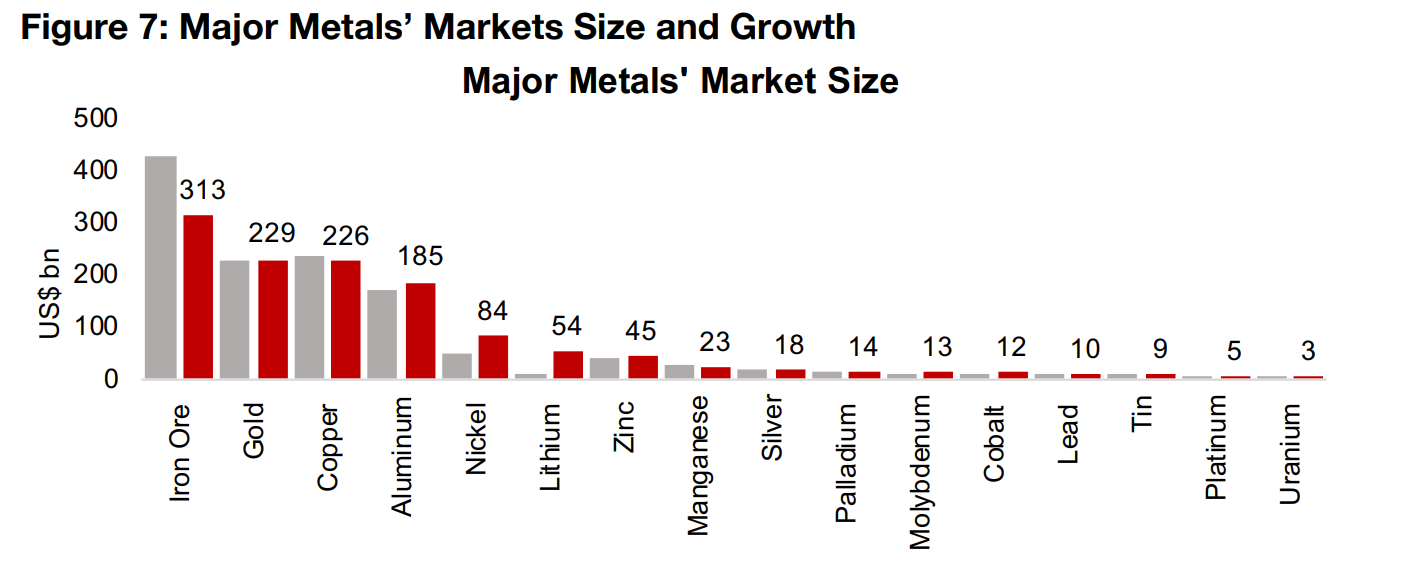
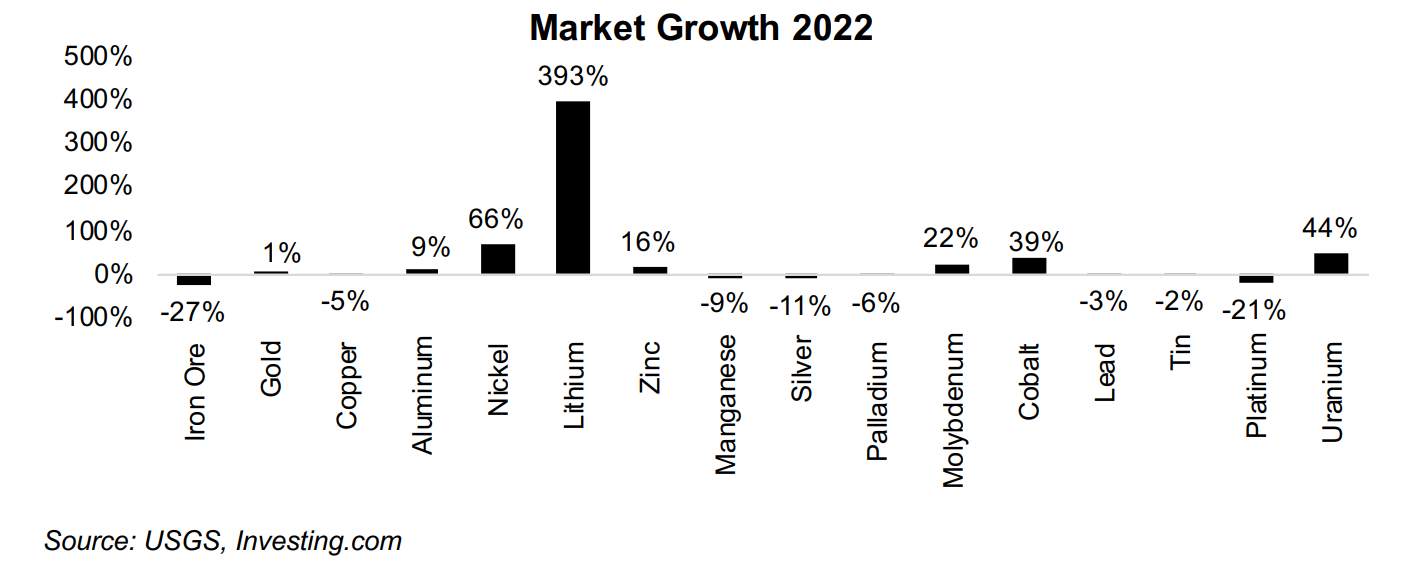
Overall, the metals markets have continued to cool in 2023, extending a trend that started in 2021, after a boom for many of these markets in 2021. Of the big four markets, only aluminum saw a considerable expansion in 2022, rising 9% to US$185bn, with gold near flat, growing 1% to US$229bn, copper edging down -5% to US$226bn, and iron ore slumping -27% to US$313bn (Figure 7). Of the sixteen largest markets, only five, nickel, lithium, molybdenum, cobalt and uranium saw substantial growth in market size, driven by strong sector specific dynamics, with the macro backdrop which drives iron ore, copper and aluminum weakening after the 2021 surge. The trends for these markets overall so far in 2023 are pointing to an overall outperformance by the precious metals and a broad weakening for the base metals, but strength in some smaller metals that have strong sector specific drivers.
Precious metals relatively strong over past year
The precious metals have remained relatively strong over the past year, with all of
them driven to some degree by their use as monetary substitutes. Even though
inflation has been declining, the market's expectation seems to be for an eventual
return to a major monetary expansion, explaining the continued relatively strong
positions in these metals as a hedge. There is also the issue of broader rising
economic and geopolitical risks, against which these precious metals are viewed as
protection, further boosting buying.
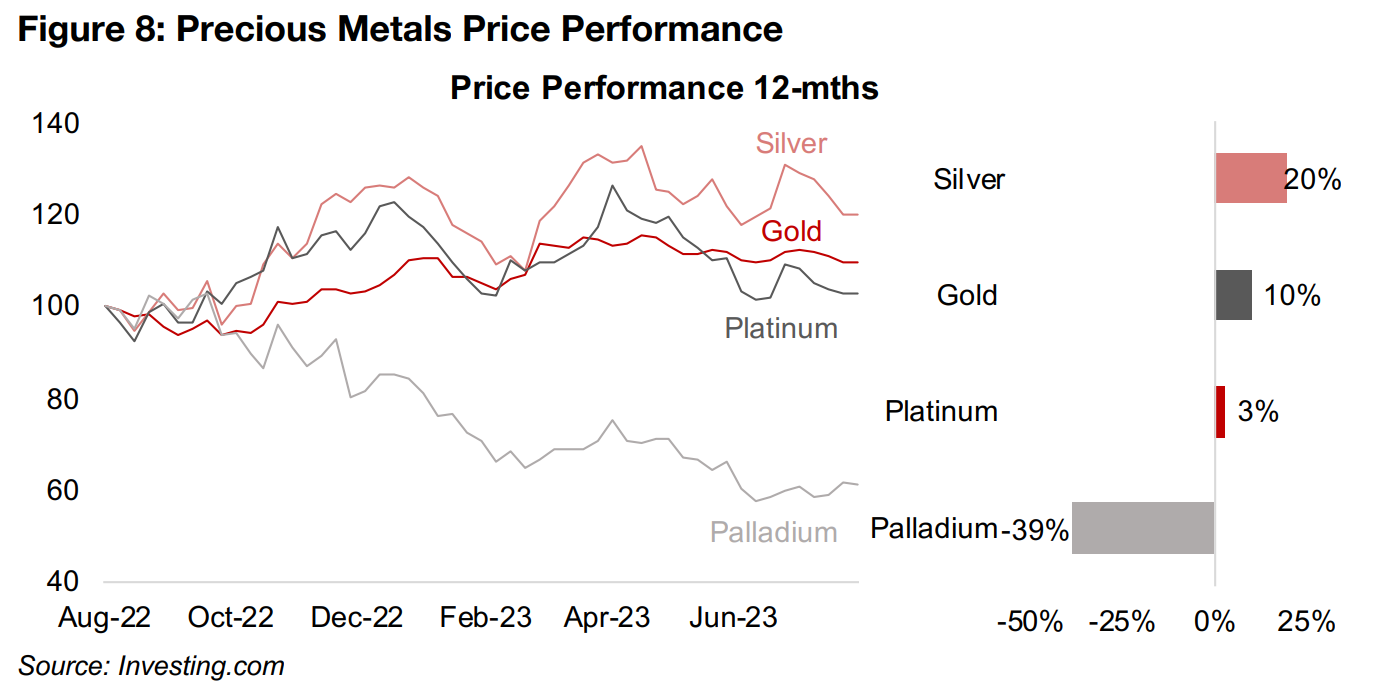
Beyond these broader macro drivers, silver's 20% gain over the past twelve months,
the highest of the four, has been driven by a mix of monetary and industrial drivers.
On the industrial side, this year is expected to be the third straight major supply deficit
for the metal, on high demand from an increasingly electronic global economy, which
has kept its price gain well above the average for the major metals (Figure 8).
In contrast, gold's 10% gain has been almost entirely driven by monetary factors,
with its industrial use marginal. Platinum and palladium have major industrial drivers,
especially their use in autocatalytic convertors, as well as being monetary substitutes,
similar to silver. However, platinum has a far higher proportion of its demand from
monetary factors, with jewellery and investment accounting for 35.8% of the total,
and autocatalysts just 32.1%. Palladium demand is almost entirely from autocatalysts,
at 85.9%, with the remainder mostly from other industrial uses. Beyond the monetary
factors likely supporting platinum, which is up 3% over the past year, compared to a
-39% decline for palladium, is a several year trend in the auto industry of substituting
platinum for palladium in autocatalytic convertors.
Major base metals trending down this year
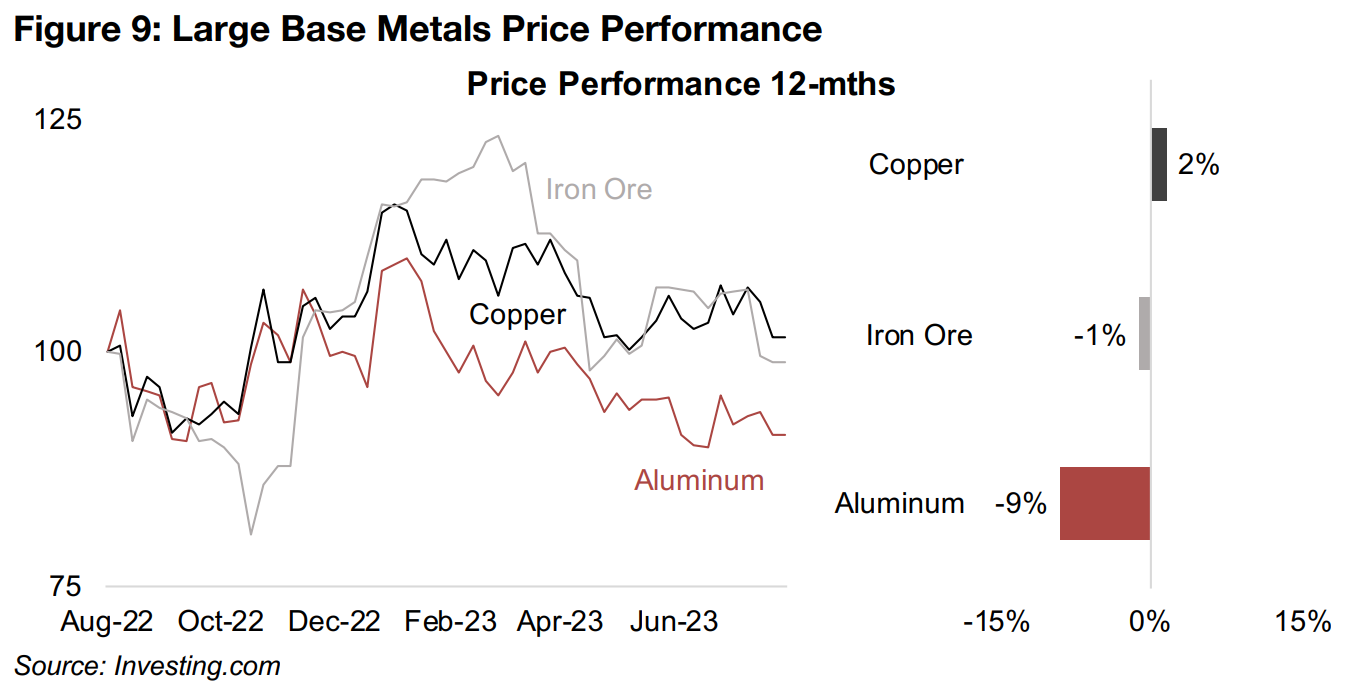
The major base metals have clearly been trending down in 2023, erasing most of the
gains from a pick-up in H2/22, leaving copper and iron near flat, up 2.0% and down
-1.0%, respectively, and aluminum down -9% (Figure 9). The three together are a
strong indicator of the temperature of the global economy and it certainly seems to
be cooling. While iron and copper slumped in March 2023, they rebounded in Q2/23,
but over the past month have given up much of these gains. Aluminum did not have
a similar Q2/23 pick up and has been sliding since January 2023.
Iron ore is viewed as especially an indicator of the economic situation in China, which
is the largest consumer and producer of the metal globally, and the demand side
outlook for the metal remains dim with recent economic data from the country
weakening. As copper and aluminum tend to be driven by broader world economic
demand, and with global recession fears remaining high, the probability of a decline
in their prices seems higher than a major rebound in our view.
Mid-tier metals sliding, some smaller metals see gains
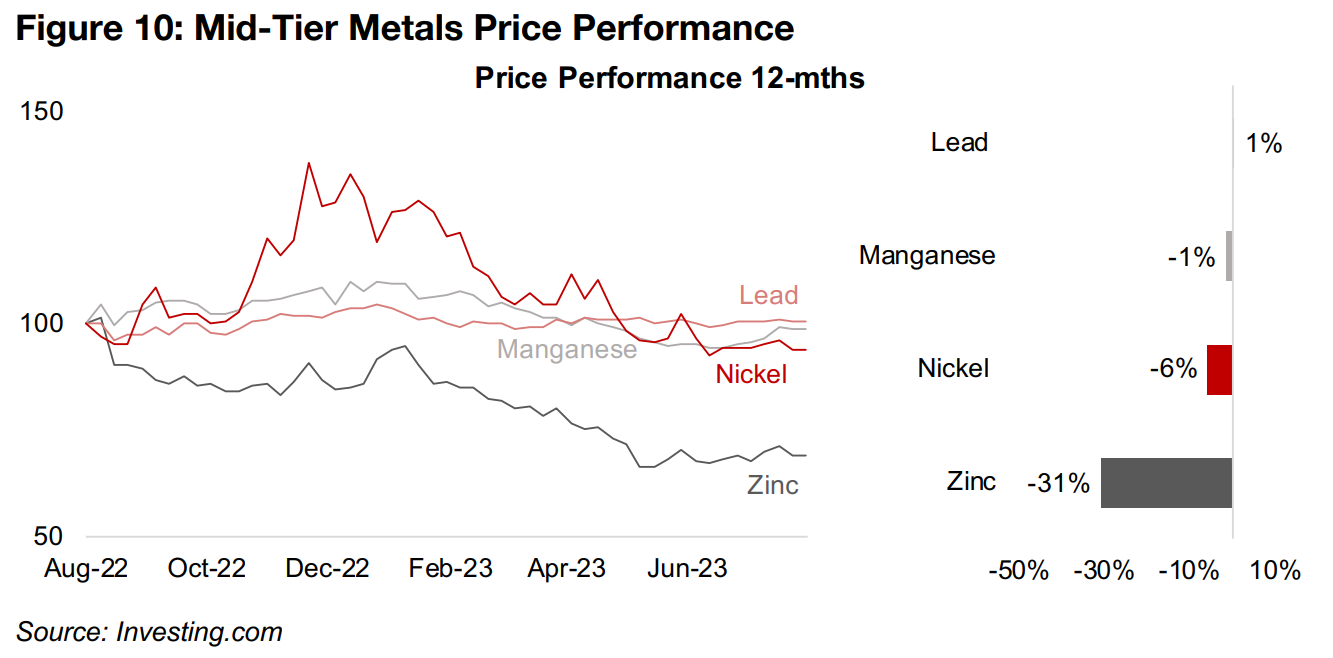
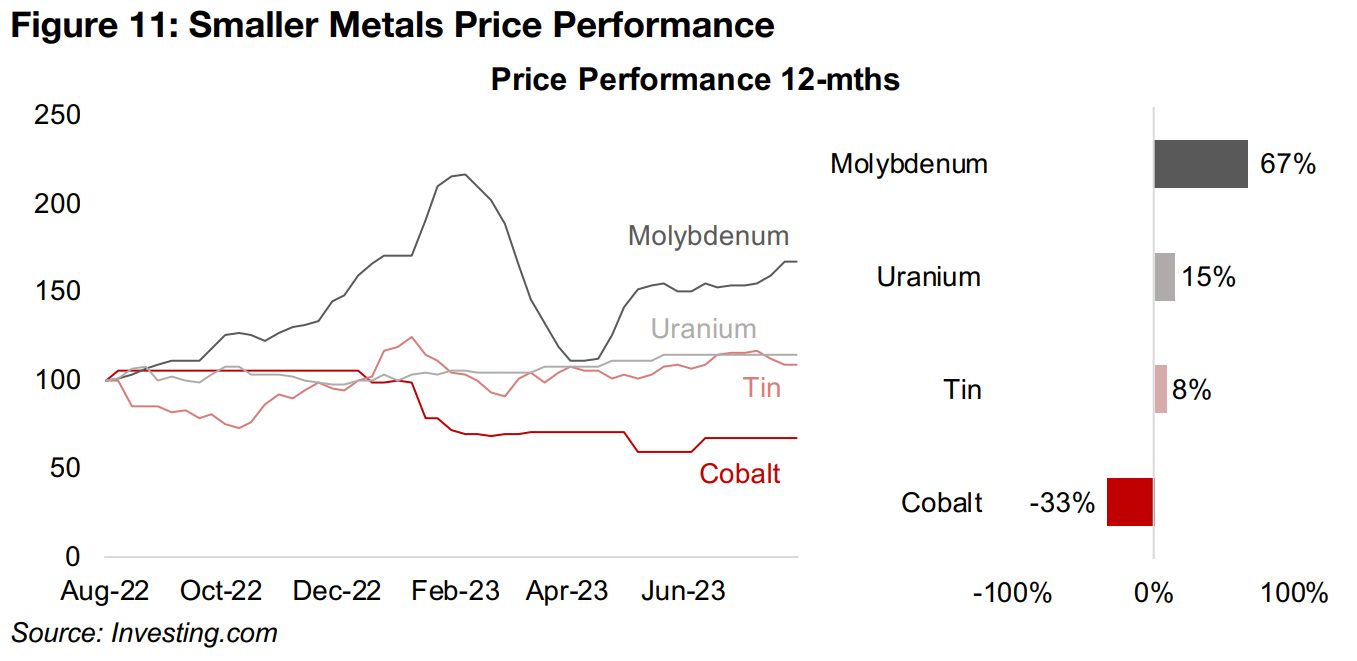
The mid-tier metals markets have followed a similar trend to the large base metals, rebounding to varying degrees in H2/22 and then declining through 2023 (Figure 10). This has left lead and manganese near flat, up 1%, and down -1%, respectively, while nickel is off -6%, which its price calming from the 2022 volatility initially caused by Russian supply fears. Zinc has been weak versus the group, down -31%, on a slowing steel market driven by a demand decline in China, with 50% of the metal's global demand for use in galvanizing steel. Some smaller metals markets have outperformed, with molybdenum up 67% on a severe supply shortage, uranium rising 15% on rising support for nuclear power as a part of green energy and tin is up 8% partly on supply disruptions in Myanmar (Figure 11). Cobalt has been the outlier of the smaller metals, down -33% as a large supply increase has hit the market.
Major gold producers and large TSXV gold mixed
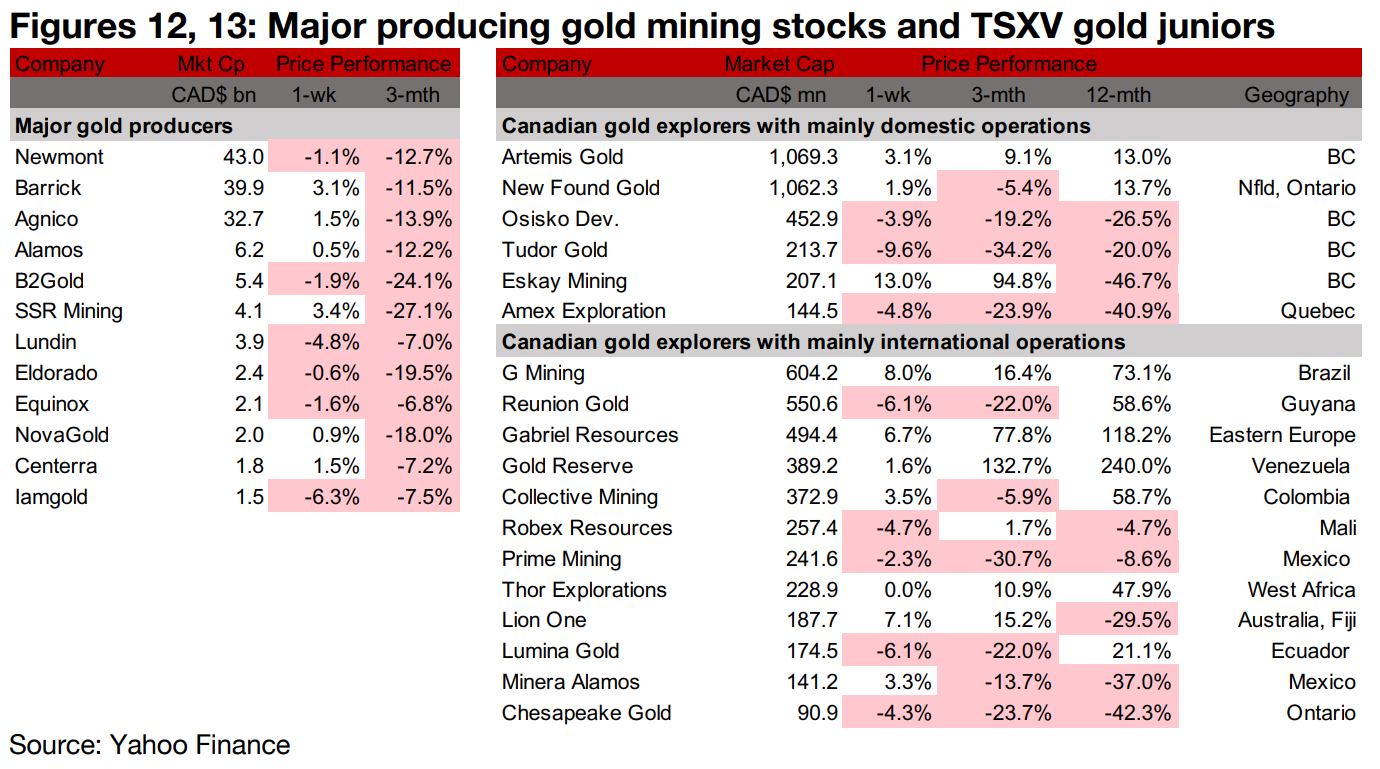
The major gold producers and large TSXV gold stocks were mixed as gold edged up but equity markets declined (Figures 12, 13). For the TSXV gold companies operating domestically, New Found Gold reported drill results from the Iceberg Zone of Queensway and Osisko Development released Q2/23 results (Figure 14). For the TSXV companies operating internationally, Lion One reported drill results from the Main Zone of Tuvatu (Figure 15).


Disclaimer: This report is for informational use only and should not be used an alternative to the financial and legal advice of a qualified professional in business planning and investment. We do not represent that forecasts in this report will lead to a specific outcome or result, and are not liable in the event of any business action taken in whole or in part as a result of the contents of this report.


