July 29, 2024
Precious Metals Back on Top
Author - Ben McGregor
Supply data still points to major silver deficit this year
This week we look at recent data on supply from the largest silver producing countries, which still point to a major deficit this year, and on major global silver mines and the largest silver producing companies, which have seen a mixed performance this year.
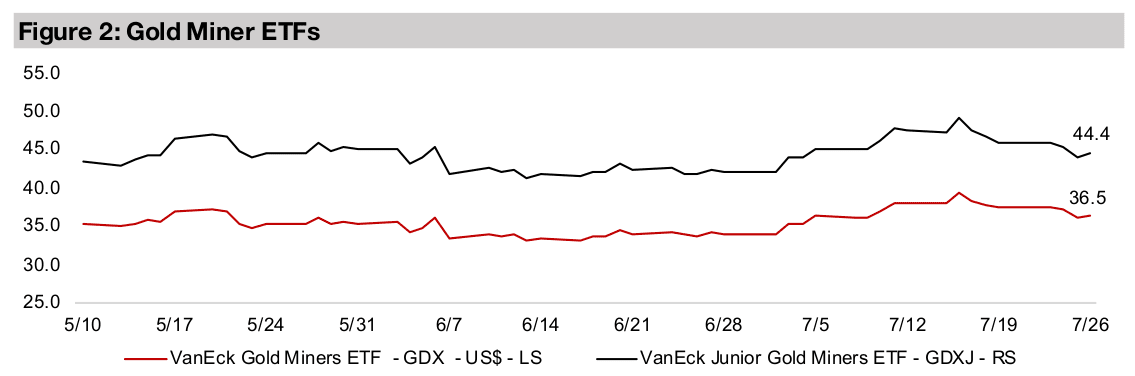
Gold stocks down as major ETFs pullback from two-year highs
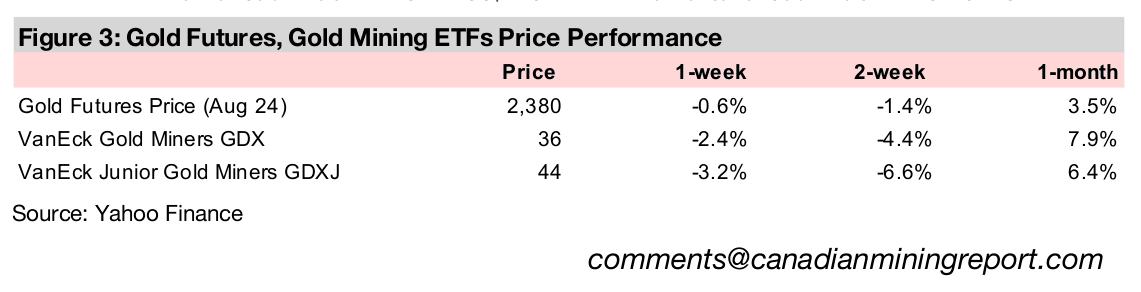
Gold stocks were down for a second consecutive week, with the GDX sliding -2.4% and the GDXJ losing -3.2%, pressured by a decline in the metal price, and likely some profit taking after both of these ETFs hit two-year highs two weeks ago.


Precious Metals Back On Top
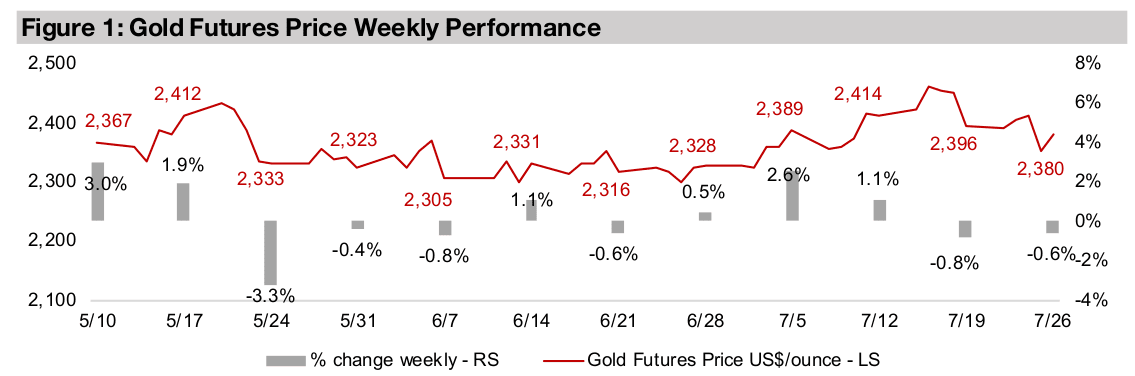
Gold declined -0.6% to US$2,380/oz, down for a second week, back within a range
between US$2,300/oz-US$2,400/oz that has held for about three months apart from
a couple of brief runs above the upper limit. Major US economic news was mixed,
with inflation continuing to decline but GDP coming in hot and did not provide a
particularly clear signal for the gold market. This led to a locking in of some profits for
the sector, after a run up of roughly US$100/oz in the metal from mid-June 2024 to
mid-July 2024 and a two-year high reached by the GDX and GDXJ two weeks ago.
The US Personal Consumption Expenditure headline and core inflation indices rose
2.5% and 2.6% yoy, respectively, inline with consensus. These are key measures
watched by the Fed for its interest rate decisions and showed inflation continuing to
ease after a rise in the headline figure from January 2024 to March 2024 had caused
concerns of resurging prices. However, Q2/24 US GDP looked more inflationary,
rising 2.8%, the strongest since Q3/23, and far above the 2.1% consensus estimate.
Large cap equities declined, with the S&P down -1.5%, driven by a continued plunge
in tech stocks, with the sector now up just 20.9% YTD, after a peak gain over 30%
as of mid-July 2024 (Figure 4). While the gold stocks have also pulled backed
significantly over the past two weeks on the drop in the metal price, the performance
of both the GDX ETF of producers and GDXJ ETF of juniors are just below the tech
sector at 19.4% each. The S&P 500 has held up relatively well over the past two
weeks, as the gradual rotation to other sectors that has been underway for much of
this year offset some of the tech weakness. This has included a move to defensive
sectors like utilities and gold stocks, the recent pullback in the latter notwithstanding.
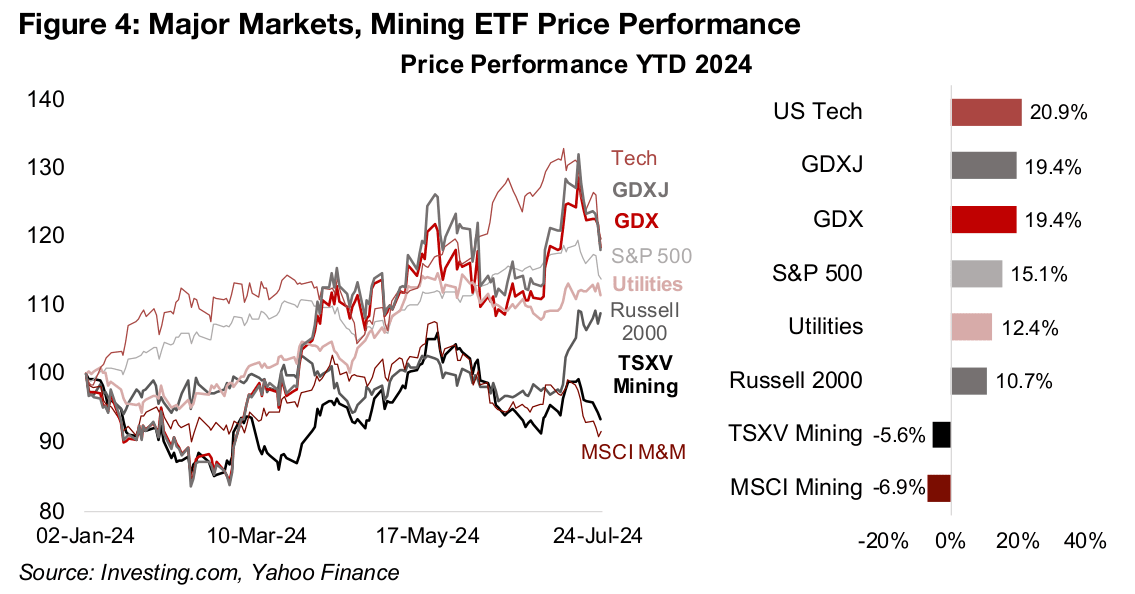
However, the market has not entirely eschewed risk, as it has stormed into small caps over the past two weeks, with the Russell 2000 gaining 11%, showing further evidence of a shift away from megacap tech. The mining sector overall has continued to struggle, with the Global Mining Producers ETF back into negative territory after almost getting above zero for the year in mid-July, on a pullback in most major metals. The S&P/TSXV Mining Index has also dropped after reaching almost flat for 2024 two weeks ago, as the prices of gold, lithium and copper, its main drivers, all declined.
Precious metals back top as speculative dust settles
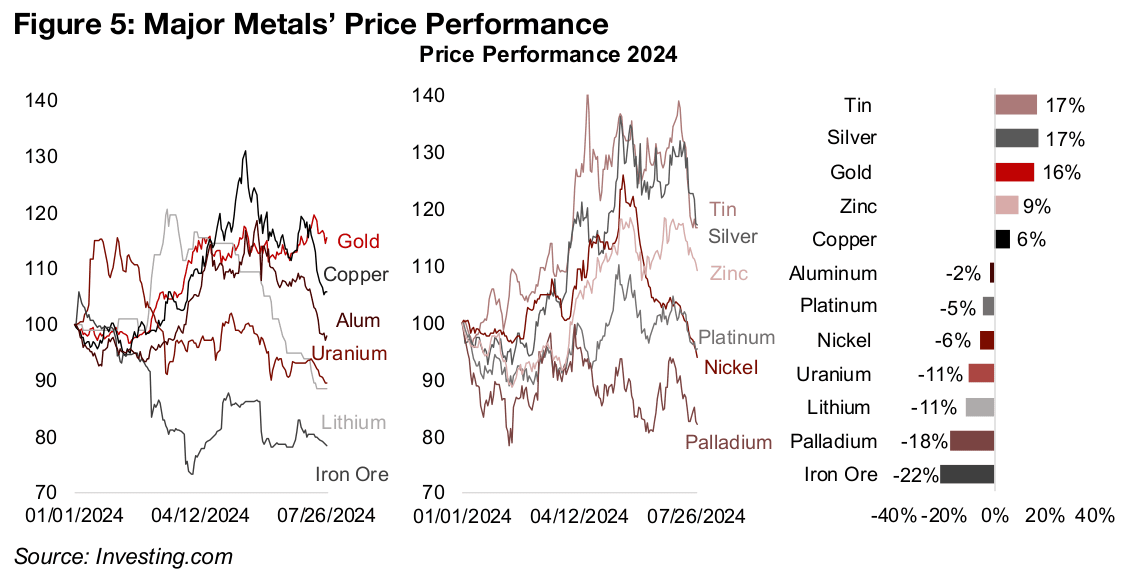
With the dust having settled from the ramp up in industrial cycle-driven metals from
March to May 2024 and then the major reversal since, two precious metals are back
on top, silver and gold, with 17% and 16% YTD gains, respectively (Figure 5). The
base metals that had been leading the market earlier in the year continue to lose
ground, with copper, tin, silver and zinc now -18%, -17%, -13 and -7% off their highs
for the year, respectively. Tin is now up 17% for the year, exactly inline with silver,
zinc but copper and zinc are up by just single digits, rising 9% and 6%.
The other precious metals, platinum and palladium, have largely given up the gains
from late June 2024 into mid-July 2024 that had been driven by the release of sector
ETFs in the US. Lithium and uranium, which had been two of the metals sector’s
biggest gainers in 2022 and 2023, respectively, are both down by -11% for the year,
although the rate of their decline has eased considerably from last year. Iron ore has
seen the worst losses of the major metals this year, down -22%, on slowing demand
from China, which accounts for the majority of global consumption of the metal.
Broad based metals slump implies weakening global demand expectations
The broad-based rise and then decline in almost all the industrial-cycle driven metals
in mid-2024 occurred at the same time as the monetary factor-driven gold gradually
rose. This suggests that the market seems to have become very bullish on the
prospects for global industrial demand from March to May 2024 and then reversed
that opinion since. It seems less likely to have been a supply side issue, with the
individual metals markets in various states of surplus and deficit, and therefore not
explaining the significant correlation in the move across many metals.
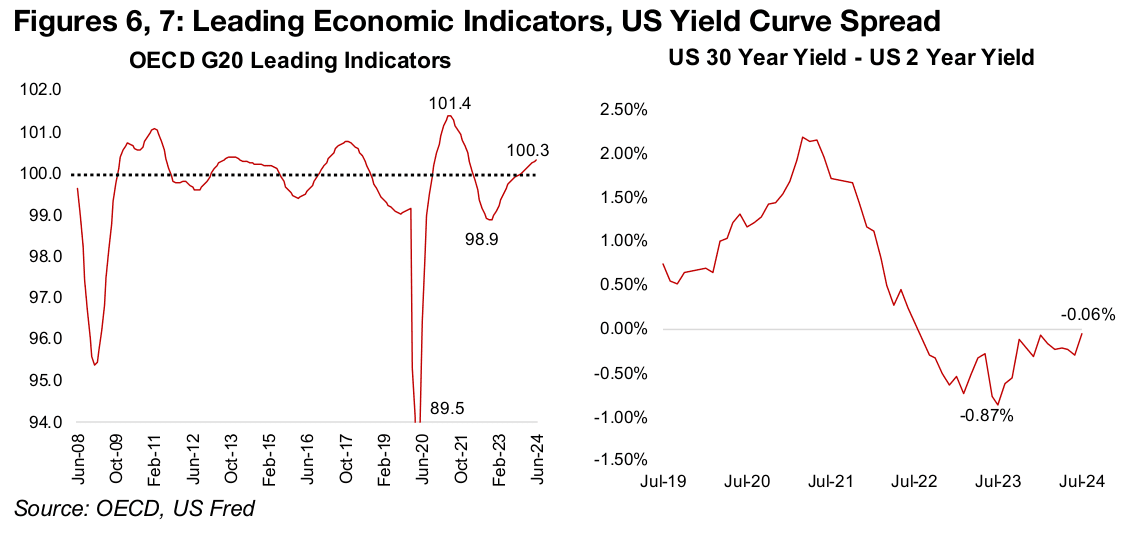
The initial upward move may have been supported by some upbeat economic data
this year, including a pick up in the OECD’s Leading Economic Indicator index (LEI)
for the G20 countries, which comprise the majority of global economic demand. LEI
readings over 100 tend to be bullish and under it bearish, so the index exiting a long
period below 100 in January 2024 could have helped propel the strong metals
sentiment (Figure 6). However, the move in the LEI above 100 since has been muted,
with the index at only 100.3, and this might have underwhelmed earlier market hopes
for a larger improvement.
Contrasting with the economic improvement implied by the rising LEI indicator are
inverted yield curves for many countries which have persisted over the past two years.
These inverted yield curves, when longer-maturity bonds have higher yields than
shorter-maturity bonds, are generally considered strongly negative economic
indicators, and tend to precede recessions. The US yield curve, based on the spread
between the 2-year and 30-year bond yields, has been negative since July 2022, and
such an extended period of inversion without triggering a recession is rare (Figure 7).
However, the two to thirty-year spread has become substantially less inverted over
the past year and was near flat as of July 2024.
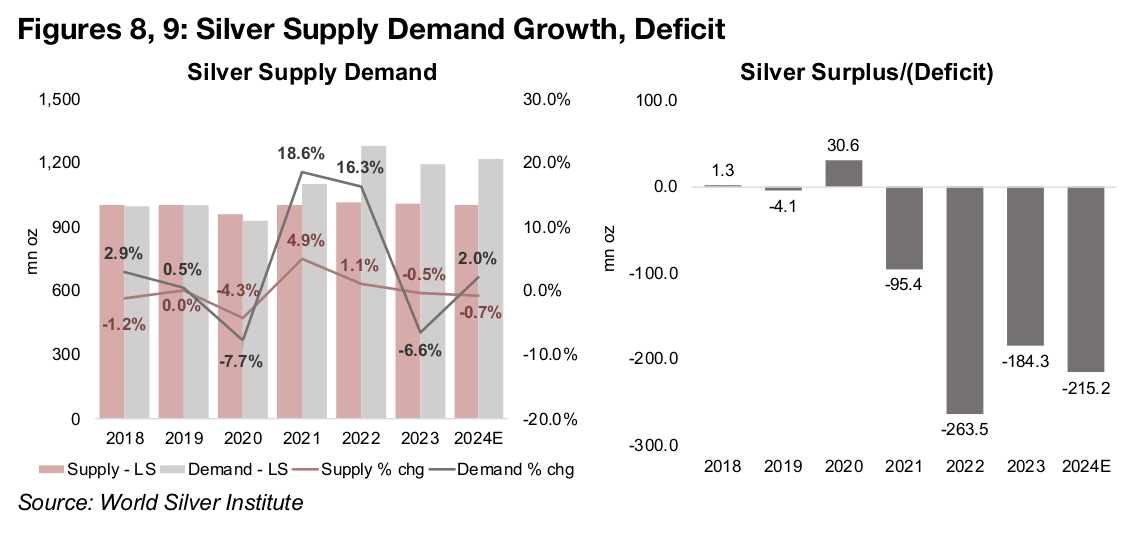
Silver outperformance driven by weak supply growth
While the silver price has been hit along with the other industrial-cycle metals over the past two weeks, it has still been the strongest performer of the major metals for the year, tied with tin. While it is a hybrid and also has support from monetary drivers, similar to gold, which could offset weakness from industrial drivers, the outsized gains have likely been caused by supply issues. A wide deficit is expected for the metal this year, with demand forecast to rise 2.0%, up from a -6.6% contraction in 2023, but supply to decline -0.7%, after it fell -0.5% last year (Figure 8). This is expected to cause a fourth consecutive year of a major deficit for the metal, of -215.2mn oz, widening moderately from an already large -184.3 mn oz deficit in 2023 (Figure 9).
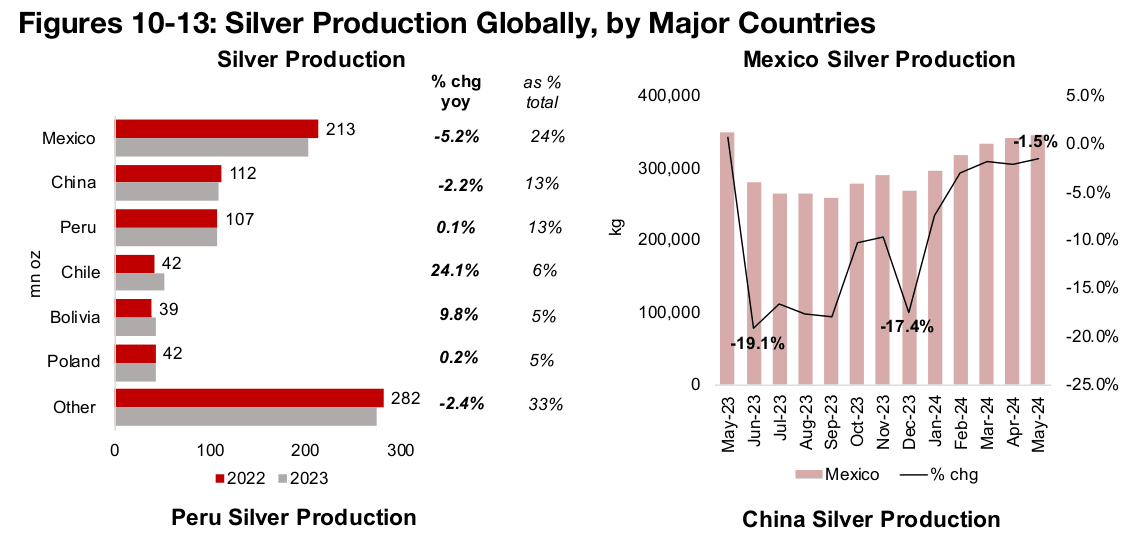
Over fifty percent of silver supply is from just three countries, global leader Mexico,
producing 213 mn oz in 2023, or 24% of the total, with 112 mn oz from China and
107 mn oz from Peru, both at 13% of the total (Figure 10). Supply growth year on
year had been particularly weak from Mexico from June 2023 to December 2023, with
a double-digit contraction, and while the decline has eased since, it is still down -1.5%
as of the most recently reported May 2024 data (Figure 11).
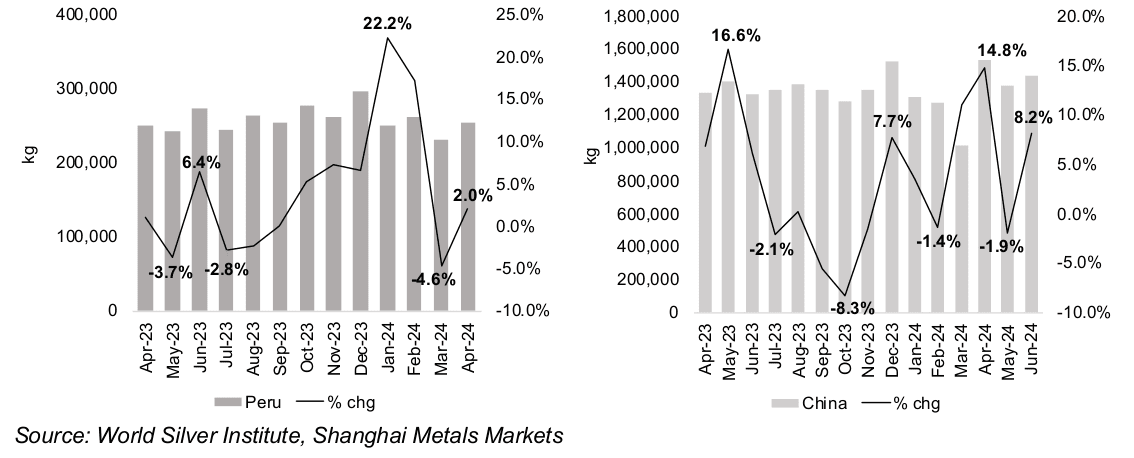
While Peru had a much stronger H2/23, and growth hit a recent peak of 22.2% in
January 2024, it has slumped over the most recently reported March and April 2024
figures, to -4.6% and 2.0% (Figure 12). While China silver production growth on a
monthly basis has been quite volatile so far in 2024, the total for the first five months
of the year is down -3.1% (Figure 13). Overall this shows continued weakness in
growth from the key silver suppliers over most of first half 2024, and does not
contradict estimates for a wide deficit for the market for this year.
Big Silver have below fifty percent revenue exposure to the metal
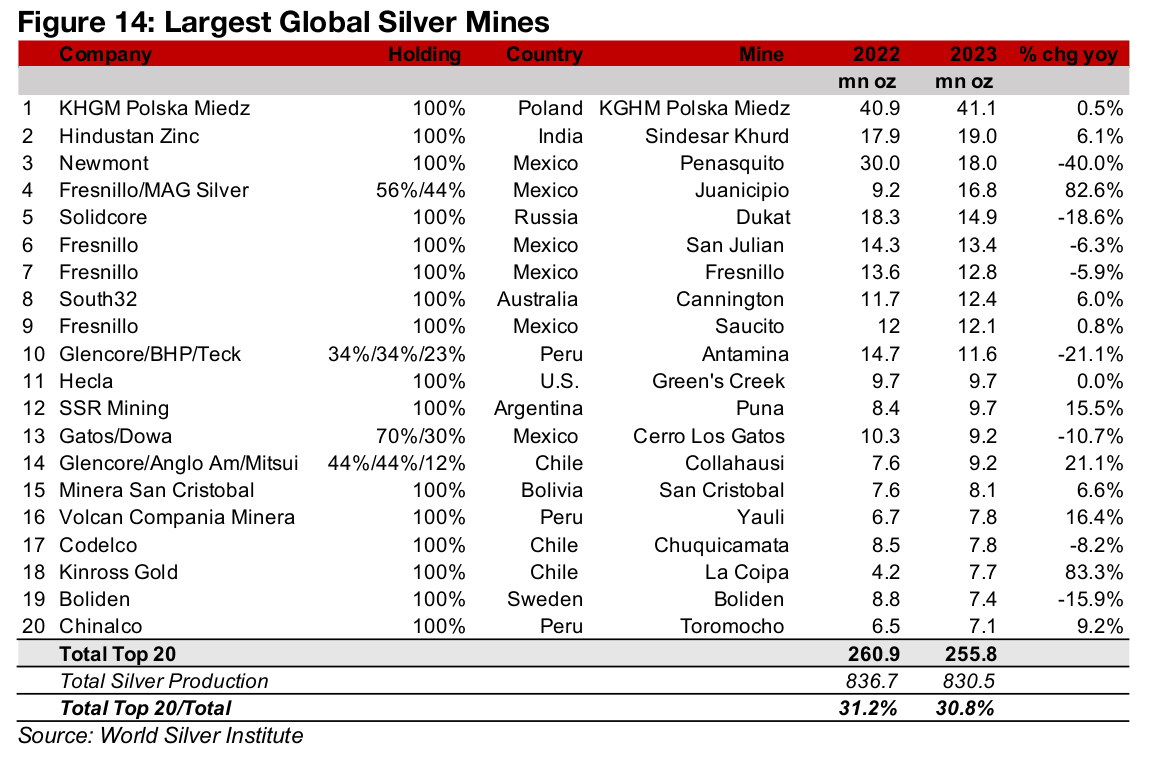
Global silver supply is not particularly strongly concentrated in terms of mines or producers, with the top twenty silver mines accounting for 30.8% of global supply. The largest individual mines are KGHM’s Polska Miedz in Poland, producing 41.1mn oz in 2023, Hindustan Zinc’s Sindesar Khurd in India at 19.0 mn oz and Newmont’s Penasquito in Mexico at 18.0mn oz (Figure 14). Mexico’s Fresnillo is another large player, operating four of the top ten largest silver mines, with Russia’s Solidcore and Australia’s South 32 also having silver mines in the top ten.
Many of the large cap listed companies that have some of the largest absolute silver
production levels globally actually have a very low proportion of the metal in their
revenue. Partly this is because silver is often a byproduct of its other operations,
especially gold and copper, but also because some of these companies have large
contributions from outside of this group of metals entirely. Glencore and BHP are
examples, with stakes in the some of the top twenty global silver mines and large
absolute level of silver production, but less than a percent of their revenue coming
from the metal, and a major contribution from iron ore.
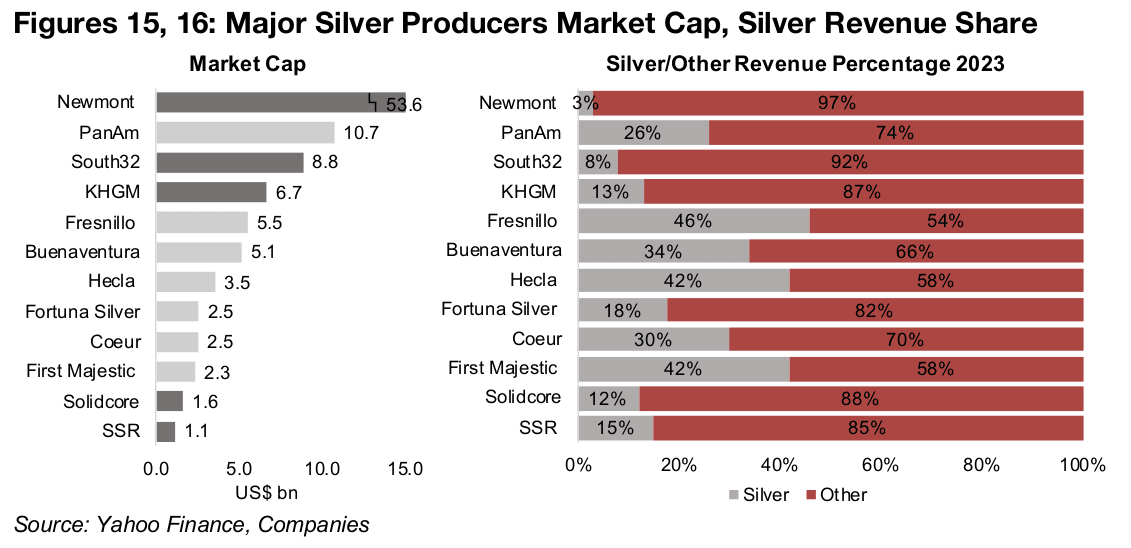
Of the global mining ‘giants’ Newmont has one of the largest contributions to revenue
from silver, but this is only 3.0% of the total in 2023 (Figures 15, 16). There are no
large silver players that could be considered ‘pure plays’ on silver, and none have
even 50% of their revenue coming from the metal. The largest cap stock with a
sizeable silver exposure is US$10.7bn PanAmerican silver, and it still accounts for
only 26% of its revenue. The other ‘Big Silver’ companies are the mid-caps Fresnillo,
Buenaventura, Hecla, Fortuna Silver, Coeur and First Majestic, which have market
caps ranging from US$2.3bn to US$5.5bn and silver contributing between 18% and
46% of their revenue.
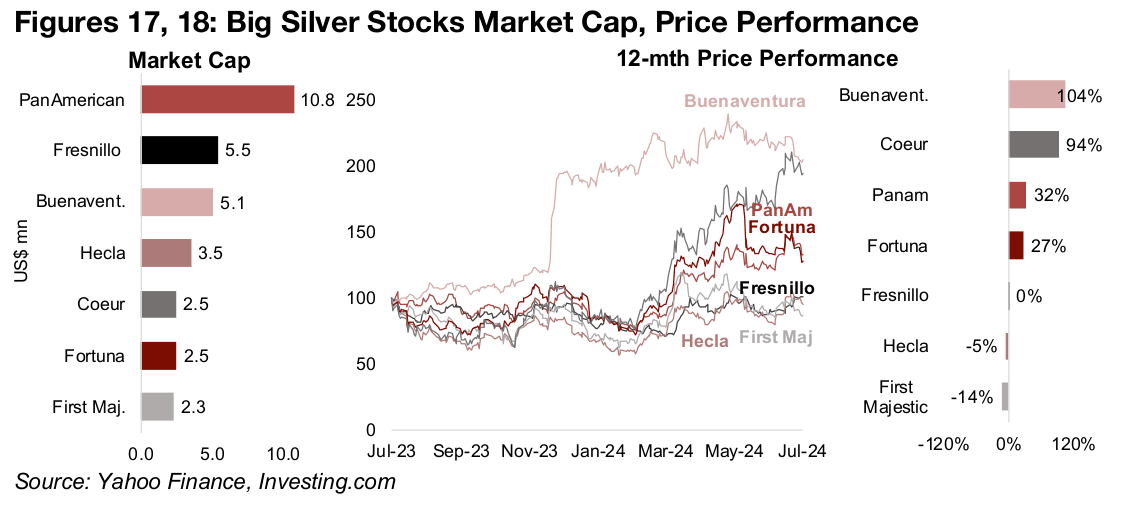
The ‘Big Silver’ stocks have not been universally buoyed by the rise in the metal price this year, with two, Buenaventura and Coeur standing out for gains around 100% over the past twelve months (Figures 17, 18). PanAmerican Silver and Fortuna have had decent increases of about 30%, while the rest of the group has been weaker, with Fresnillo flat, Hecla down -5% and First Majestic down -14%.
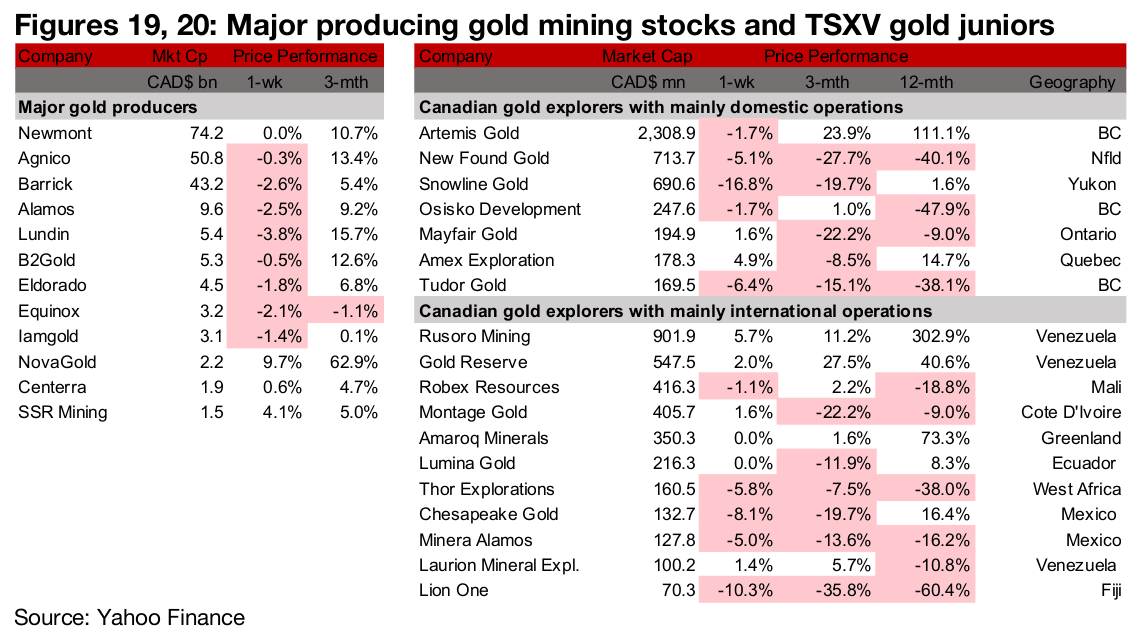
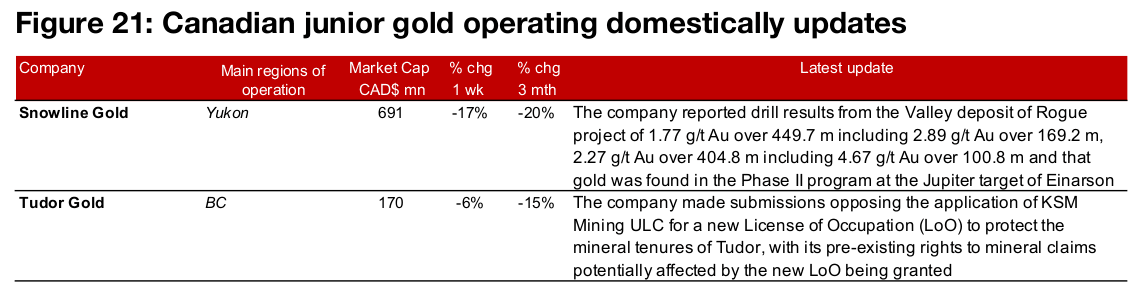
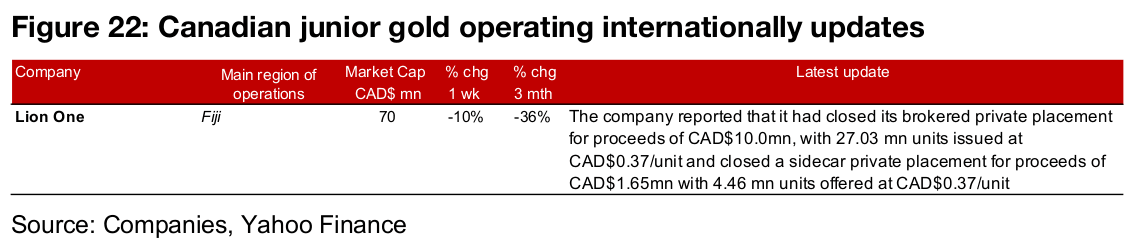
Major producers and TSXV gold mostly down
The major gold producers and TSXV gold stocks were mainly down on metal’s decline (Figures 19, 20). For the TSXV gold companies operating domestically, Snowline reported drill results from Rogue and Tudor made submissions opposing a new License of Occupation on its tenure (Figure 21). For the TSXV gold companies operating internationally, Lion One closed two private placements (Figure 22).
Disclaimer: This report is for informational use only and should not be used an alternative to the financial and legal advice of a qualified professional in business planning and investment. We do not represent that forecasts in this report will lead to a specific outcome or result, and are not liable in the event of any business action taken in whole or in part as a result of the contents of this report.