March 03, 2025
Moderate Decline In Exploration Budgets
Author - Ben McGregor
Gold down on resistance at key benchmark
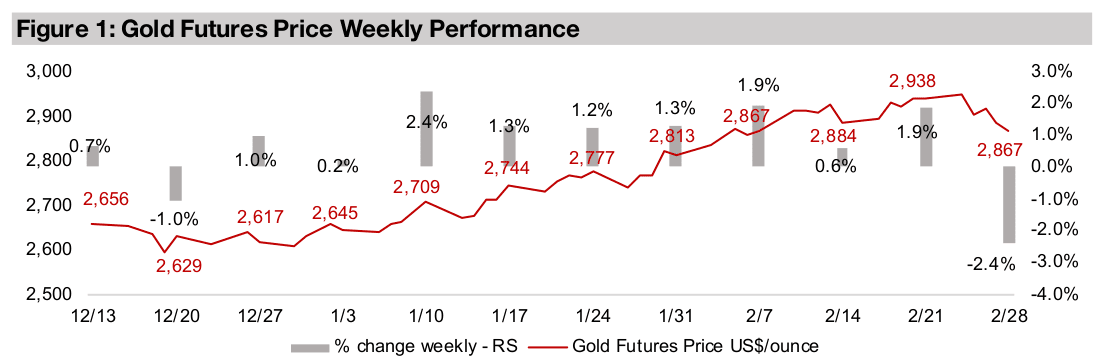
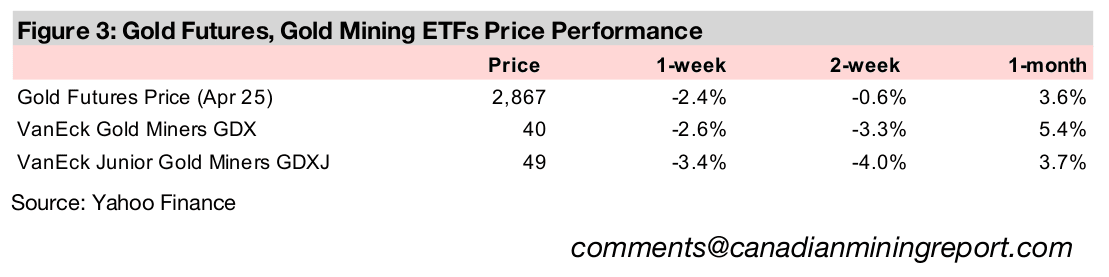
Gold declined -2.4% to US$2,867/oz, reversing from a move above US$2,900/oz for the second time in a month, with resistance apparently forming at this key level, as fundamentals drivers were mixed and not necessarily indicative of a pullback.
Gold stocks decline on metal and equities drop
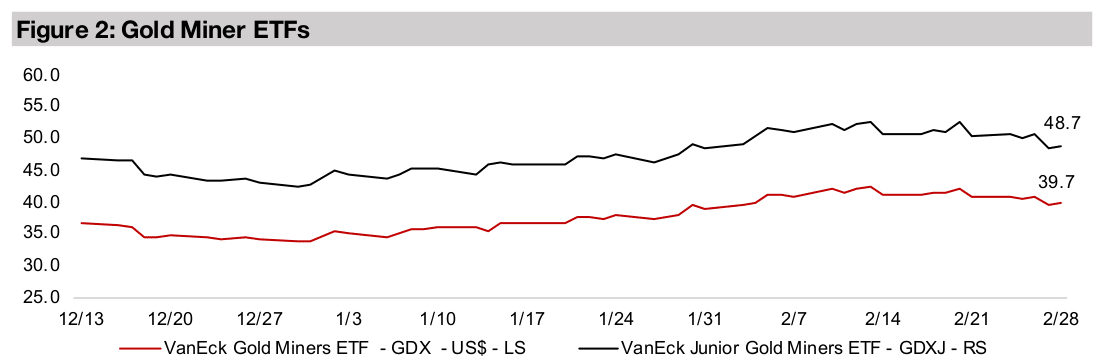
Gold stocks were dragged down by a decline in the metal and markets, with the GDX losing -2.6 and GDXJ off -3.4%, with tech underperforming and the Nasdaq dropping -3.8% versus a -1.2% drop for the S&P 500 and -1.7% fall in the Russell 2000.


Moderate Decline In Exploration Budgets
The gold price reversed from a push above US$2,900/oz for the second time in a
month, ending the week down -2.4% to US$2,867/oz, with some resistance seeming
to have formed at this key level after about a US$300/oz gain in the past three months.
Overall the fundamentals this week would have not necessarily indicated a major
decline in gold. There was some downward pressure from a rebound in the US$ after
hitting lows for the year last week, but this was offset to a degree by a continued
decline in US bond yields, with both tending to move inversely to the gold price.
While geopolitical risk, which has been a key driver for gold in recent years, did not
necessarily jump this week, it certainly did not decline either after a tense interaction
between the US and Ukraine over resolving the latter’s conflict with Russia. This
sudden cooling of US-Ukraine relations might have also been expected to boost gold.
It could be that the big gains over three months have simply already priced in a lot of
the negative news from this week. The market may also not quite be ready to accept
gold price above the critical US$3,000/oz level, although we see a high probability
this will be reached this year, and it could be sooner rather than later.
There was a decline in equity markets, with tech taking the largest hit, with the
Nasdaq down -3.8%, underperforming the -1.2% drop in the S&P 500 and -1.7%
loss in the Russell 2000. The gold stocks declined with the GDX off -2.6% and GDXJ
down -3.4%, on the drop in both the metal and equities. However, this is after a
considerable rise year to date, with the GDX up 12.4% and GDXJ up 8.5%, and as
with the gold price, some consolidation could be expected given these big moves.
Other safe haven sectors have also outperformed in 2025, with utilities up 5.1% and
also far surpassed the -3.0% decline in US Tech since the start of the year.
More signs of stagflation
Key economic news included PCE Inflation reported by the Fed, with the January
2025 headline number at 2.5% and core PCE inflation at 2.6%. While this was inline
with expectations, these figures remain considerably above the Fed’s 2.0% target,
with the core PCE a key metric for the central bank in making interest rate decisions.
While US inflation certainly has been severely reduced from its mid-2022 peak at
9.0%, there has been little progress made for the past six months and there are still
concerns of a resurgence in prices, especially given rising global tariffs.
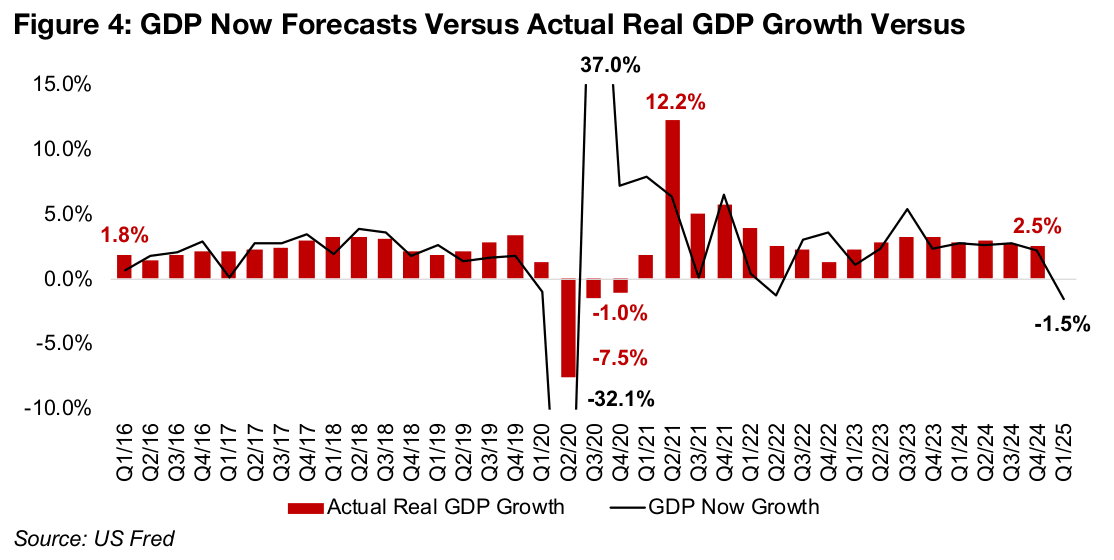
There are also concerns on US economic growth, with the Atlanta Fed’s GDP Now
indicator suggesting the US may have already entered recession in Q1/25 (Figure 4).
While GDP is a backward-looking measure reported well after the end of a given
quarter, GDP Now attempts to give an estimate of current growth. The GDP Now
numbers have historically been reasonably inline with the reported growth, but can
miss significantly to both the up and downside, as seen during the global health crisis.
Therefore the GDP Now figure could be exaggerating the actual level of any decline.
However, even if the GDP Now figures are off by a percent, the US could see a
slowdown in growth from Q1/25. Coupled with the relatively high inflation, this could
indicate that stagflation is developing, which is a period of elevated prices and low
growth. Severe stagflation was last seen in the mid-1970s and early-1980s and while
clearly a negative situation overall, it drove a very strong performance for gold, as
markets moved into it as a hedge for both inflation and general economic risk.
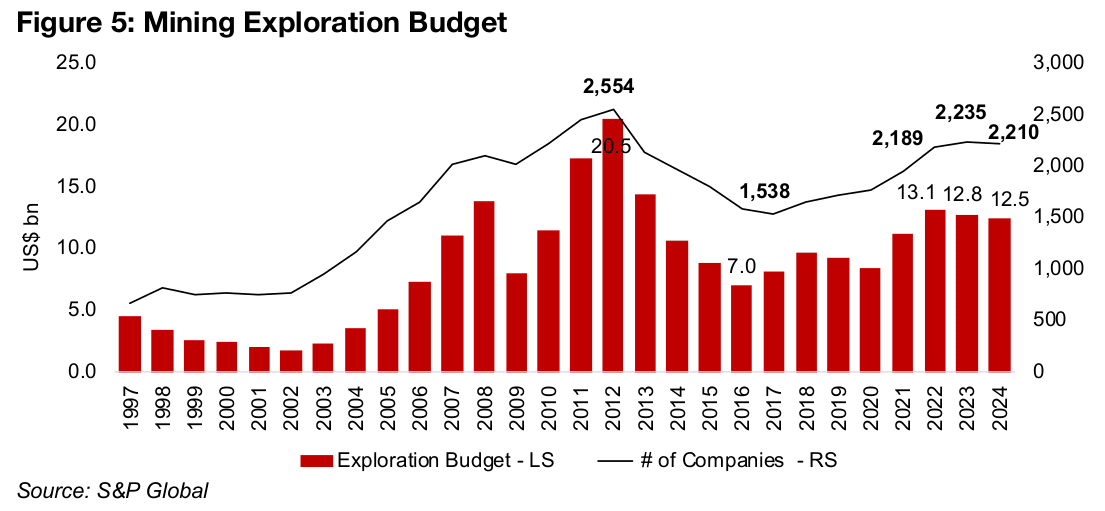
Mining exploration budgets in 2024 decline moderately
Mining exploration budgets for 2024 were recently reported by S&P Global at
US$12.5bn, with a moderate -2.2% decline from US$12.8bn in 2023, continuing
down from the peak of the past decade at US$13.1bn in 2022 (Figure 5). The number
of companies actively exploring declined to 2,210 in 2024 from 2,235 in 2023 but is
up slightly from 2,189 in 2022. Even after the decline, the budget in 2024 was well
above the US$7.0 bn trough at the depths of the mining bear market in 2016, with
the number of companies exploring bottoming at 1,538 a year later in 2017.
However, budgets remain considerably below the US$20.5bn peak reached at the
top of the last cycle in 2012, when there were 2,554 companies with ongoing activity.
Both 2011 and 2013 were also strong, at US$17.2bn and US$14.4bn, respectively,
and far above the most recent 2022 peak. This indicates that the rise in exploration
activity in the upcycle since 2020 has not been nearly as strong as the early 2010s,
especially after taking into account inflation over the past ten years.
Gold and copper see largest mining exploration budgets
Gold was the focus of nearly half the mining exploration budget in 2025, at US$5.5bn, or 44% of the total, although this has declined considerably over the past two years, from US$7.0bn in 2022 (Figure 6). However, with the gold price again soaring in recent months there seems to be potential for companies to consider boosting exploration budgets for the metal this year. Copper saw the second largest budget, at US$3.2bn, or 26% of the total, and this risen over the past two years, from US$2.7bn in 2022, as a continued copper deficit and its critical role in any green energy shift have encouraged major exploration for the metal.
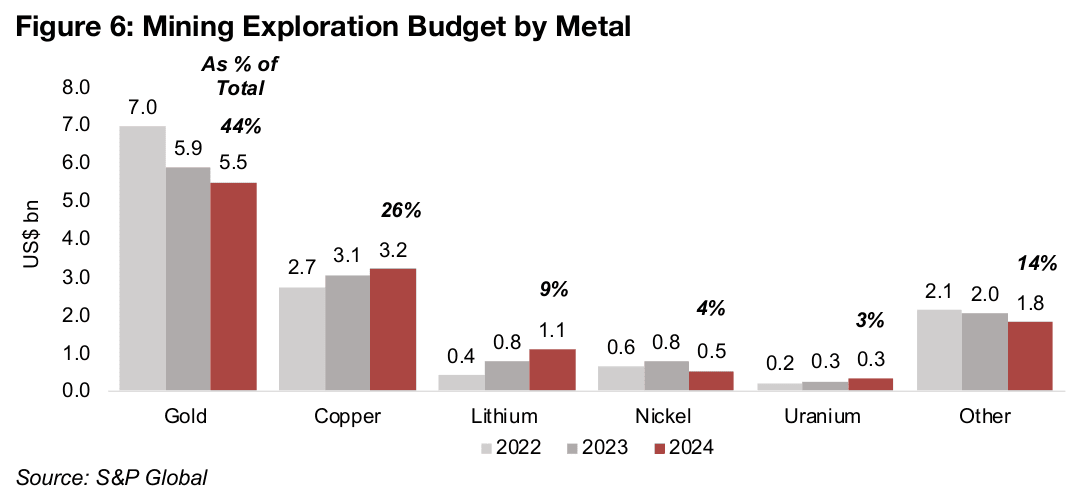
The budget for lithium was the third largest, at US$1.1bn, and while this was just 4%
of the total, it has seen by far the largest percentage gain, nearly quadrupling from
just US$0.4bn in 2022. This has been in response to a huge rise in demand for the
metal from a surge in electric vehicle sales over the past several years. The
investment has grown even as the lithium price has plunged over the past two years,
showing companies taking a more medium to long-term view on the metal.
This contrasts with nickel, where a price slump has driven one of the largest
percentage budget declines of the major metals, down -30% in 2024 US$0.5bn from
US$0.8bn in 2023. While both lithium and nickel are expected to face a considerable
surplus this year and into 2026, the mining companies may be expecting the latter to
come into balance sooner than the latter, given the difference in budgets.
Uranium exploration budgets, at US$0.3b, or 3% of the total, are near flat year on
year. This will have been affected by a plunge in the uranium price over the past year,
after what was increasingly seen as an unsustainable short-term speculative move.
However, the long-term secular story remains largely intact, with increasing global
government support for nuclear power as a part of green energy plants.
The total budget for all other metals was US$1.8bn, or 14% of the total, and has
declined since 2022. The two largest contributors to this were silver, where
exploration budgets have trended down since 2021, and zinc, with budgets down
over the past two years. Platinum group metals budgets also saw a year on year
decline in 2024, and only lanthanides and other rare earth minerals and molybdenum
saw gains, but were a relatively small contribution to the total ‘other’ category.
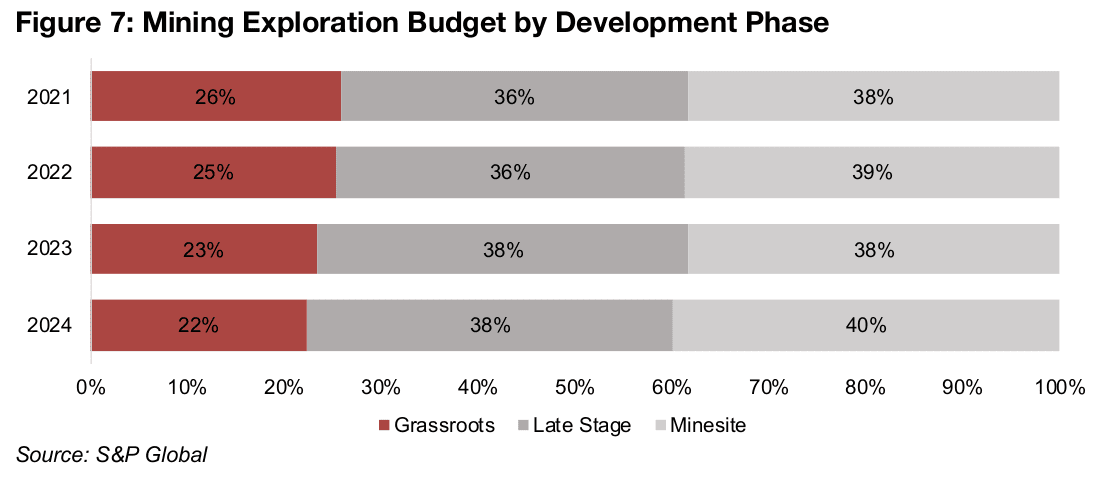
Budgets shift to later phases and larger companies
The proportion of grassroots phase budgets has declined consistently over the past
four years, to 22% in 2024 from 26% in 2021 (Figure 7). This has been offset by a rise
in late stage exploration budgets to 38% in 2024 from 36% in 2021, and minesite
budgets to 40% of the total from 38% in 2021. The relatively high weighting to the
sector in 2021 was part of a continued wave of renewed interest in smaller junior
miners, especially in the gold sector, that started in 2019, after the long bear market.
However, as the gold price stagnated from later 2021 through to early 2024 and
lithium, nickel and cobalt prices all collapsed over the past two years, the interest in
very early-stage projects relatively waned, although it has hardly been a slump overall.
Also, the market in general seemed to have become more risk averse especially since
last year, not only for mining, but across many sectors, which decreased the available
funding for earlier stage companies. While this risk aversion remains, for mining, there
is some hope for a rise in the share of grassroots budgets in 2025. This could be
driven by the rise in the gold price, but also as lithium, nickel and cobalt all seem to
be bottoming, which could increase interest in some riskier, early-stage projects.
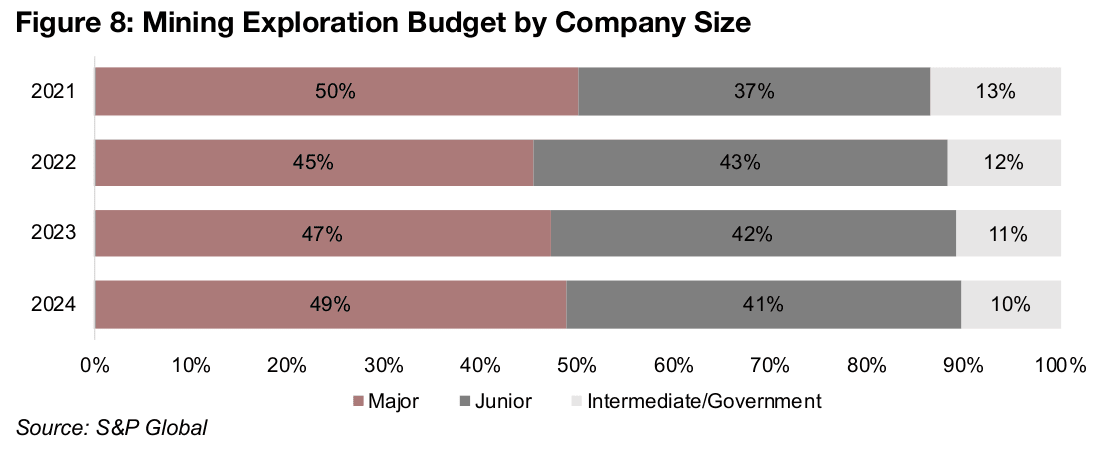
The proportion of exploration budgets for the majors has rebounded to 49%, near its 2021 level of 50%, after lows of 45% in 2022 (Figure 8). In contrast, junior budgets have declined, again reflecting the rising risk aversion, to 41% in 2024 from a peak of 43% in 2022, and after jumping from 37% in 2021. The combined proportion of intermediate and government has declined to 10% in 2024, from 13% in 2021.
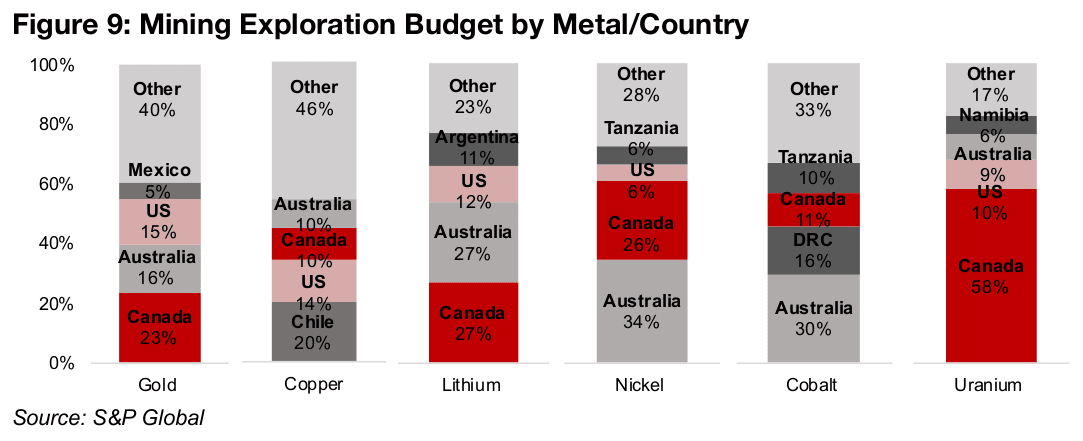
Canada, Australia, the leaders for global mining exploration budgets
Canada and Australia led exploration budgets in 2024 by far, with in both in the top four for every major metal (Figure 9). The two countries led gold, with a 23% and 16% share, lithium, at 27% and 27%, and nickel, at 26% and 34%. While Chile and the US led copper, at 20% and 14%, Canada and Australia were third and fourth, at 10% each. For cobalt, Australia was number one at 30%, and Canada third, at 11%, while Canada dominated uranium, at 58% of the total, with Australia at 9%. Other sizeable players were Mexico for gold, at 5% of the total, Argentina for copper at 11%, Tanzania for nickel, at 6%, and cobalt, at 10%, with the DRC also a large cobalt player at 16%, and Namibia large for uranium, at 6% of the total.
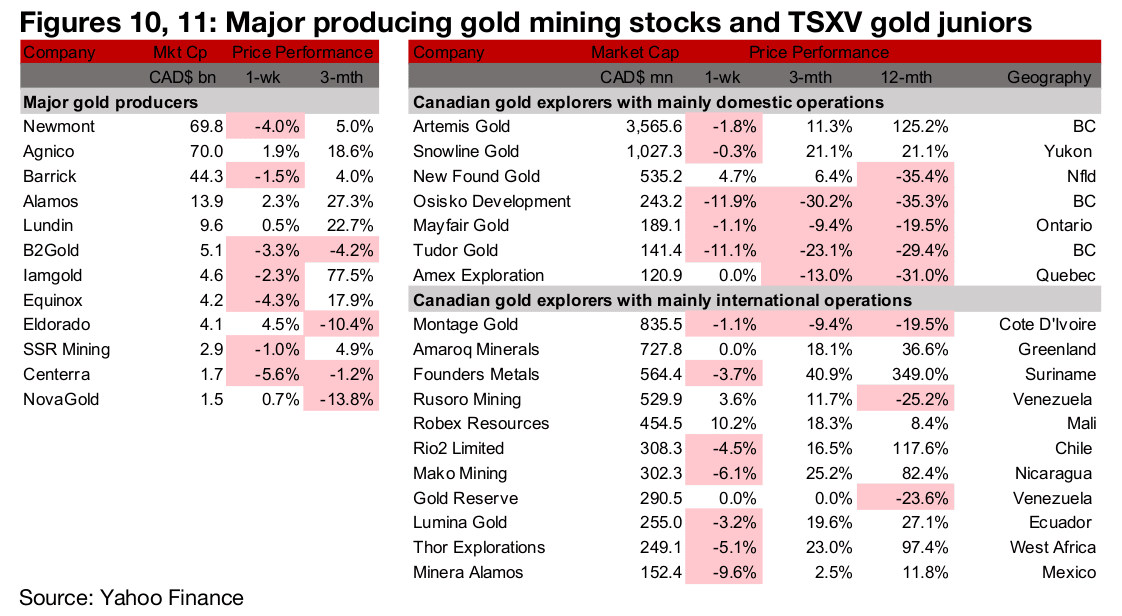
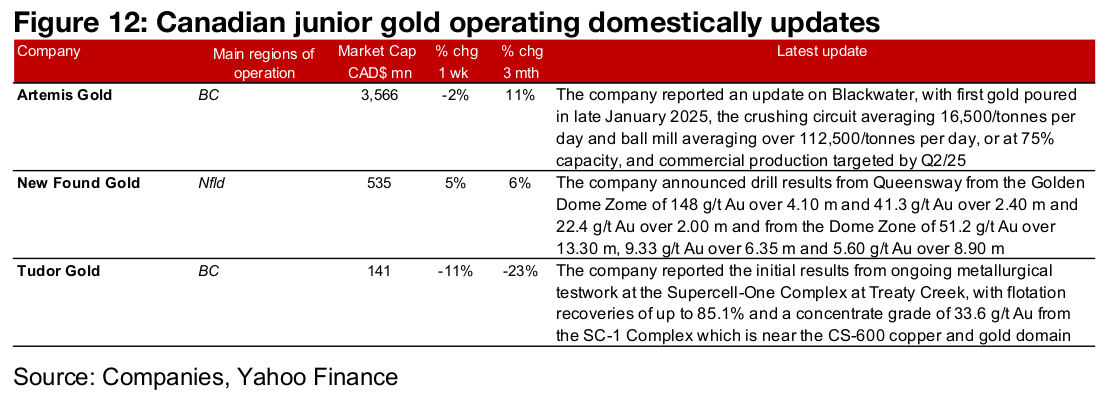
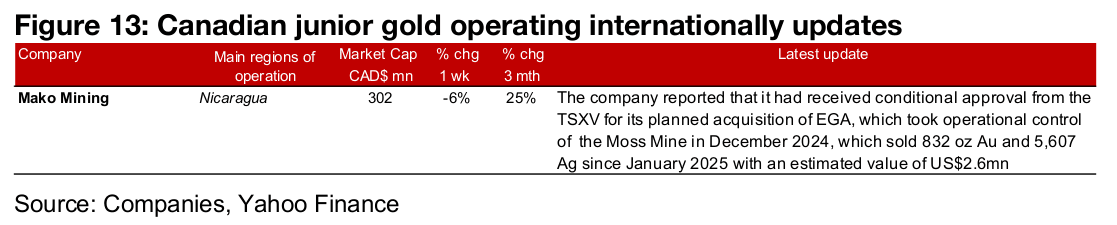
Major gold producers and TSXV gold mixed
The major gold producers and TSXV gold were mixed as both the gold price and equities declined (Figures 10, 11). For the TSXV gold companies operating domestically, Artemis reported an update on operations at Blackwater, New Found Gold announced drill results from the Golden Dome and Dome Zones of Queensway and Tudor Gold reported initial results from metallurgical testwork at the Supercell- One Complex at Treaty Creek (Figure 12). For the TSXV gold companies operating internationally, the company received conditional approval from its planned acquisition of EGA, which operates the Moss Mine (Figure 13).
Disclaimer: This report is for informational use only and should not be used an alternative to the financial and legal advice of a qualified professional in business planning and investment. We do not represent that forecasts in this report will lead to a specific outcome or result, and are not liable in the event of any business action taken in whole or in part as a result of the contents of this report.