October 28, 2024

Mining M&A Could Match Last Year
The gold price ticked up 0.2% to US$2,741/oz, taking a pause after about a
US$250/oz run over the past two months. While there were no major economic data
releases, there was the downward driver of a continued move higher in US nominal
bond yields. This would also imply higher real yields, which tend to move inversely
with gold as they increase the opportunity cost of holding yield-less gold. The US 10-
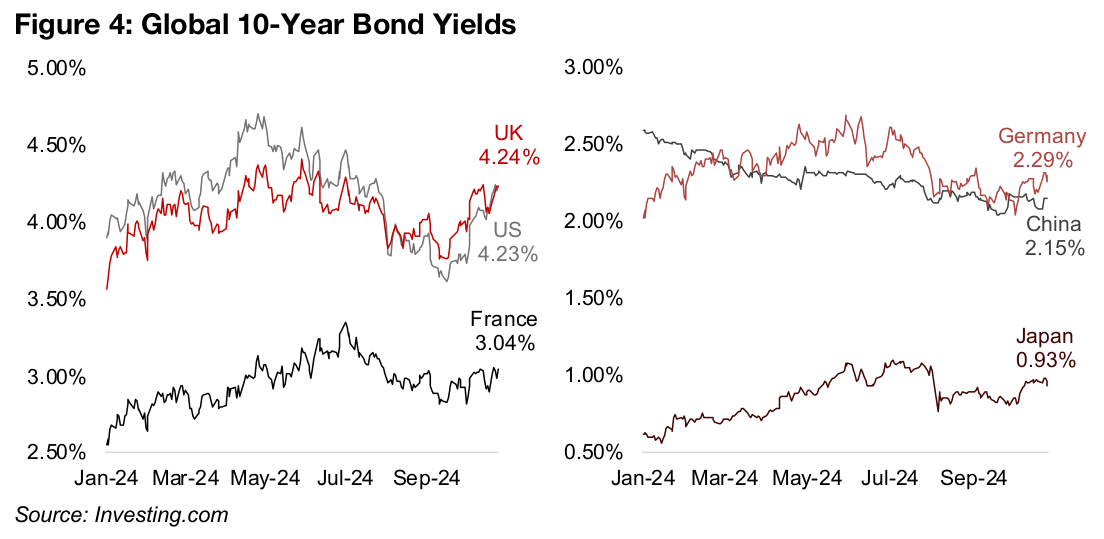
year yield has reached 4.23%, up from 3.62% on September 16, 2024, the opposite
of what might have been expected given the US Fed 0.50% rate cut on September
18, 2024 (Figure 4). There has also been a broad upswing globally in yields for most
of the other largest economies, including Japan, Germany, the UK and France.
This increase in yields has driven up the US$, which also tends to move inversely to
gold and is a downward driver for the metal price. However, gold has surged even in
the face of these two major factors going against it over the past two months. We see
the main driver being an increase in the global money supply on the back of a major
rate cutting cycle that started this year by most of the major central banks. It has also
been supported by rising geopolitical tensions, especially in the Middle East, which
may have offset the pressure from rising real yields.
While the gold stocks pulled back, junior gold outperformed, with the GDXJ down
just -1.9%, versus a -3.7% decline for the GDX ETF of large producers. This was
partly because large caps underperformed with the S&P down -0.85% and Nasdaq
up just 0.34% versus a flat performance for the Russell 2000 small cap index.
However, a large factor driving down the GDX was a -17.6% decline in the share price
of Newmont, one of the three largest global gold companies, after Q3/24 results
missed expectations, with revenue strong, but costs coming in ahead of estimates.
Global mining M&A on track to match 2023
While the gold price has surged this year, gains for other major metals like copper
and aluminum have been more moderate, and some, including iron ore and lithium,
have plunged. The market has continued to be highly cautious of the sector, as shown
by the huge drop in Newmont from its earnings miss, and valuations have remained
low versus history. This contrasts with the market’s bullishness on the tech sector
this year, although even this has started to wane in recent months.
These low valuations for mining have continued to encourage M&A in the sector
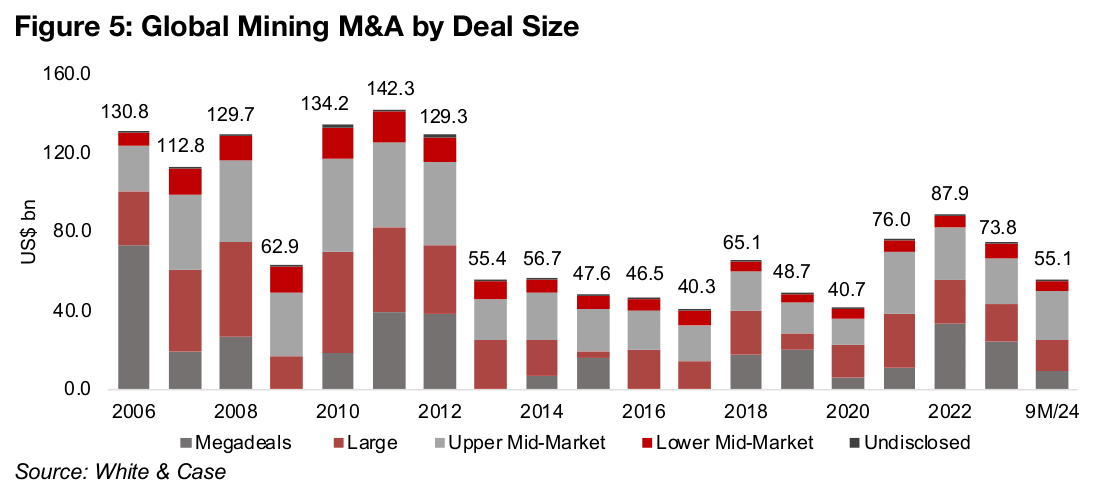
globally, with White & Case reporting US$55.1bn in acquisitions over 9M/24, putting
the sector on track to reach a similar level to the US$73.8bn of 2023 if it maintains
this run rate in Q4/24 (Figure 5). The value of megadeals has been low compared to
the last two years, at US$8.9 for 9M/24 versus US$23.9bn in 2023 and US$33.4bn in
2022. However, the total value of large and upper mid-market deals has been strong,
at US$16.1 and US$24.9bn for 9M/24, already near full year 2023 levels.
The lack of megadeals has seen both these segments become a larger proportion of
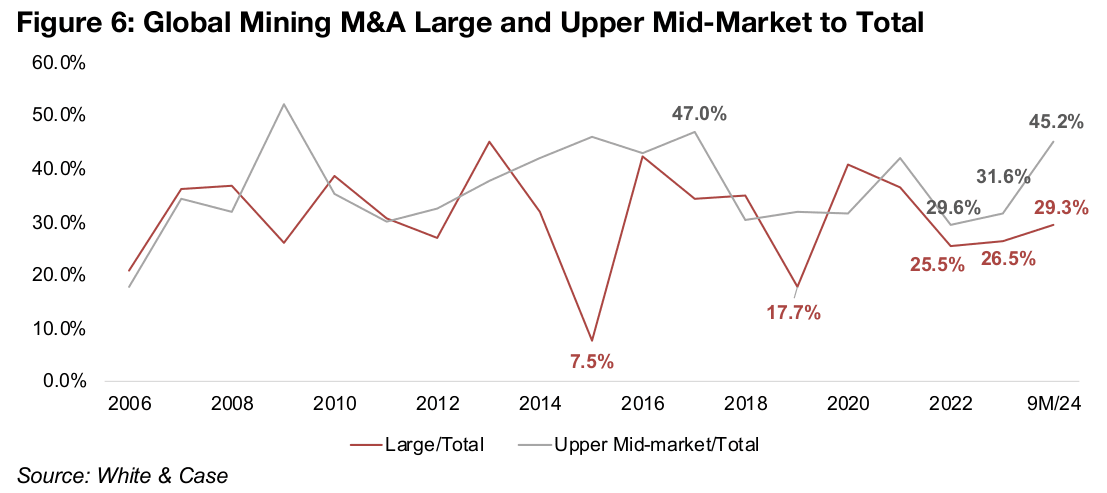
the global total in 9M/24, with upper mid-market deals jumping to 45.2% from 31.6%
in 2023 and 29.6% in 2022 (Figure 6). Large deals have also increased, to 29.3%,
from 26.5% in 2023 and 25.5% in 2022. These two sectors combined have therefore
offset the relatively few megadeals this year, with the probability of a huge deal by
fourth quarter likely low.
There appears to have been roughly three levels of deal activity since 2006, the first
averaging US$101bn per year from 2006-2012, excluding an exceptionally weak
2009 during the global financial crisis. The sector then had a long bear market, with
M&A averaging just US$50.1bn, or half the previous boom, from 2013 to 2020. From
2021 to 2023, a new average in between the mid-2000s boom and mid-2010s bust
has emerged, averaging US$79bn, and 2024 appears likely to remain in this range.
Smaller mining M&A deals at similar proportion to 2023
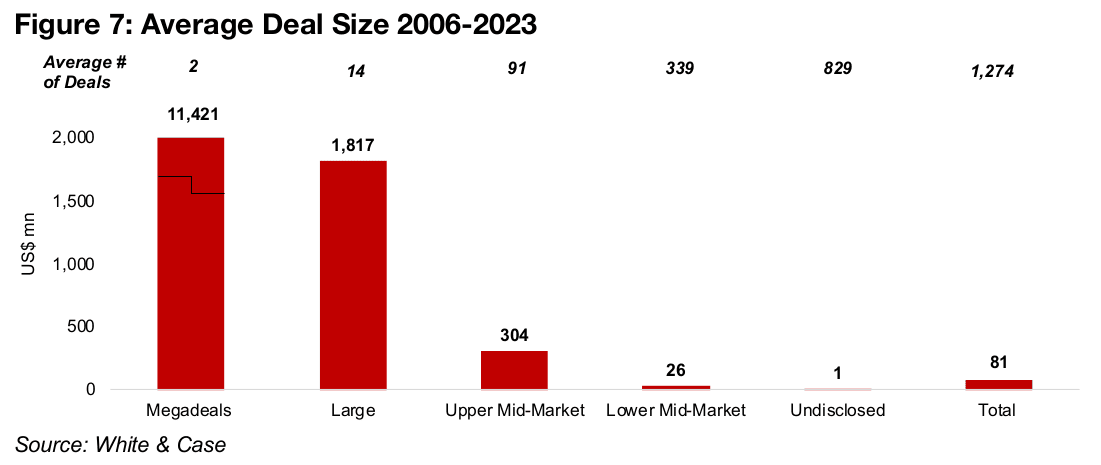
The Lower Mid-Market segment is the smallest deal level reported by White & Case and is a proxy for junior mining M&A. Taking the average deal value for the segment of US$9bn from 2006-2023 and dividing by an average 339 deals per year gives an average deal value of US$26mn, implying that most of this segment involved juniors (Figure 7). The same calculation for the Upper Mid-Market segment gives an average deal size of US$304mn, more indicative of the largest juniors or intermediate producers. As megacap deals do not occur every year, taking the average of just the years in which M&A at this high level occurred from 2006 to 2023, gives US$11,421bn per deal, with the Large deal segment average at US$1,817bn.
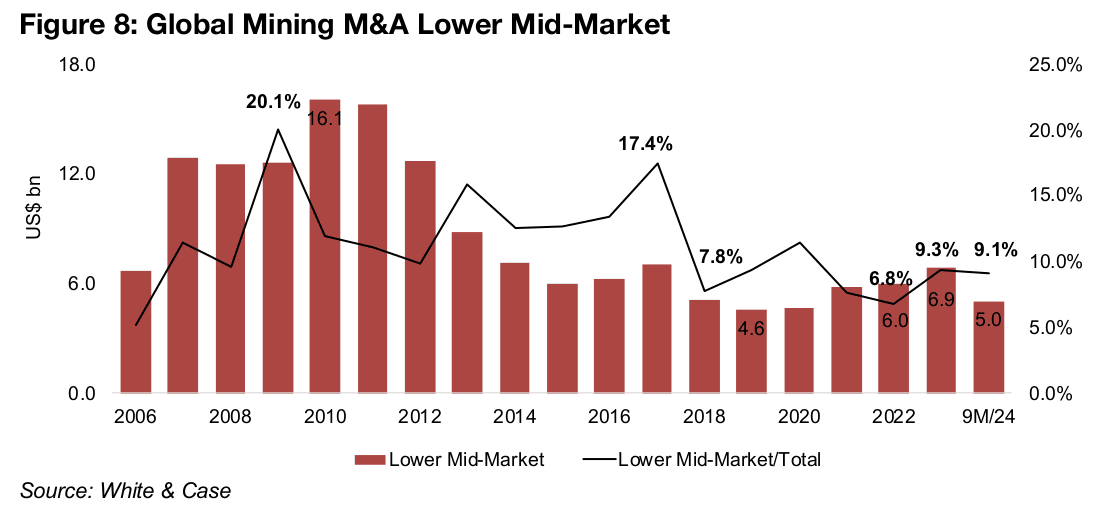
While the Lower Mid-Market segment has not seen the major increase of the large
and upper mid-market segments as a proportion of total deal value in 9M/24, at 9.1%
it is similar to the 9.3% of 2023 and well off of the 6.8% lows in 2022 (Figure 8). With
US$5.0bn in deals over 9M/24, the sector is still on track to nearly match 2023 levels,
indicating M&A activity for the juniors still remains relatively strong.
The growth pattern of Lower Mid-Market deals has been different from the broader
market. There was a peak from 2007 to 2012, averaging US$13.8bn per year, and
while 2006 was weak, there was not a decline in 2009 as for total mining M&A. There
was also not an abrupt slump in deals in 2013 as seen for the overall market and a
more gradual decline to a low in 2019. The recovery has also been much more gradual,
rising 24.4% in 2021, compared to an 86.8% jump that year for the market overall.
We could therefore conclude that while the juniors have participated in the mining
M&A sector rebound, there has been a greater rise in activity for the larger companies.
Canada’s global mining M&A could be above last year
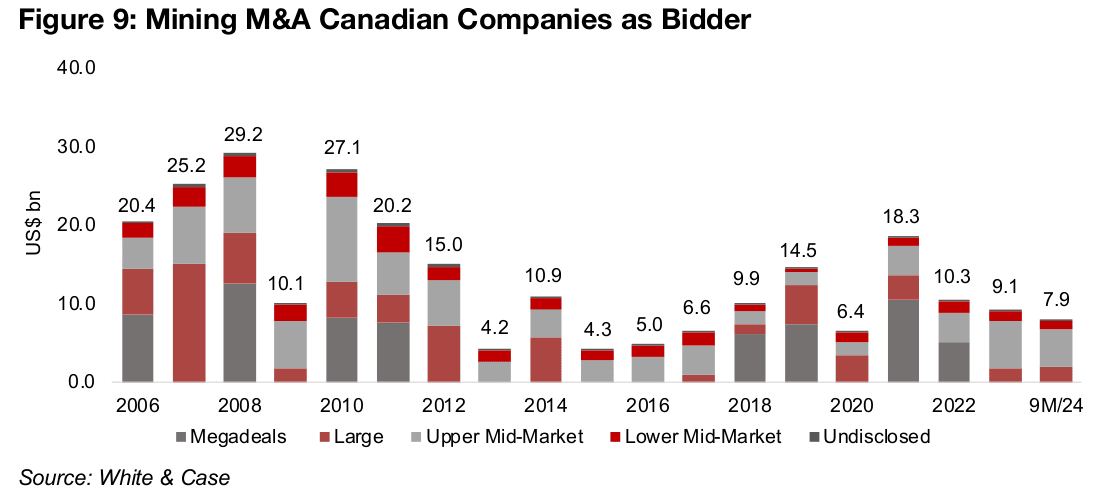
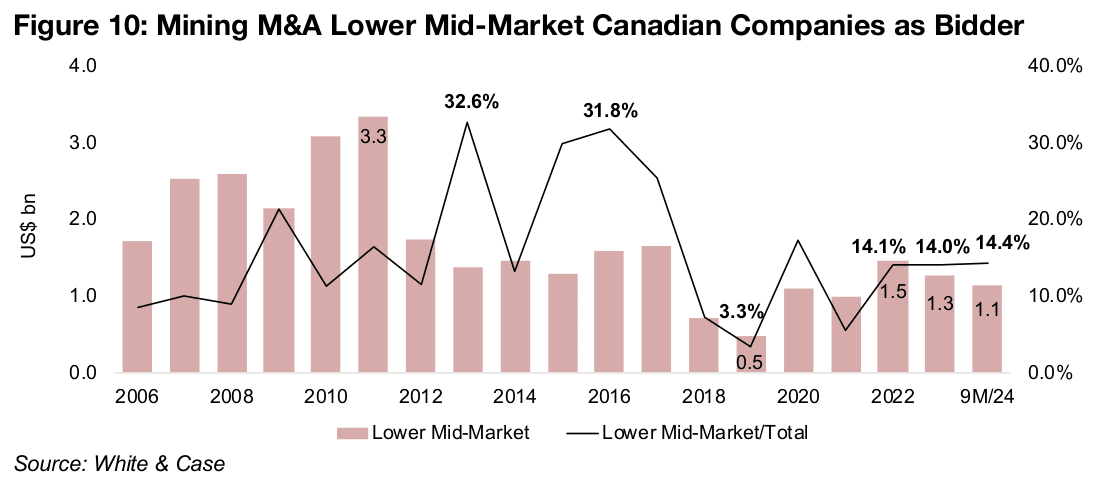
Canada has remained one of the top players in global mining M&A, along with Australia and China. The country’s global mining M&A was US$7.9bn in 9M/24 putting in on track to surpass the US$9.1bn of 2023, although it is still well below the 2021 peak of US$18.3bn (Figure 9). Canada’s junior mining M&A was US$1.1bn over 9M/24 and also looks set to outpace the US$1.3bn of 2023 (Figure 10). Junior mining deal value as proportion of the total Canadian M&A has also risen in 9M/24, to 14.4%, up from 14.0% in 2023 and 14.1 in 2022, although this is about half the previous peaks of 32.6% in 2013 and 31.8% in 2016.
Mining M&A in Canada may decline in 2024
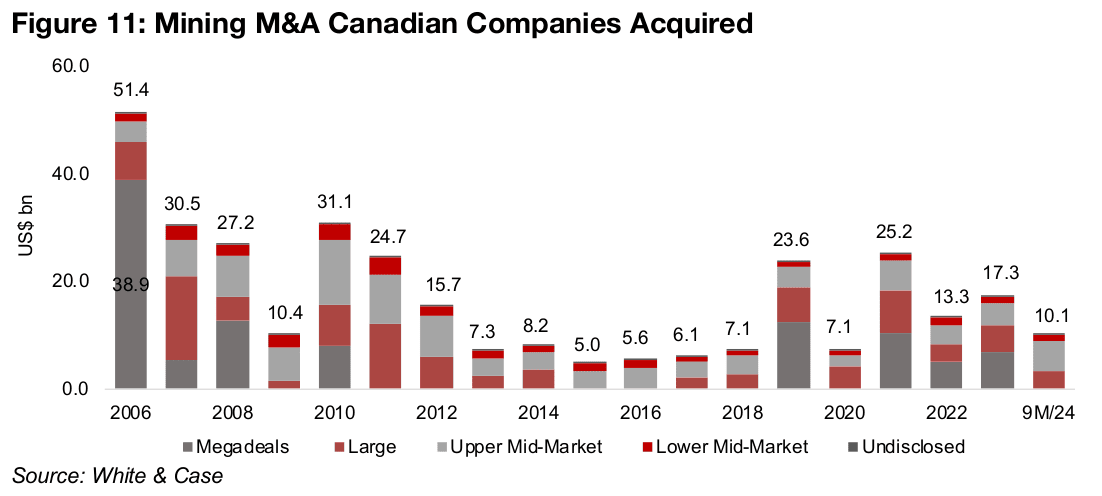
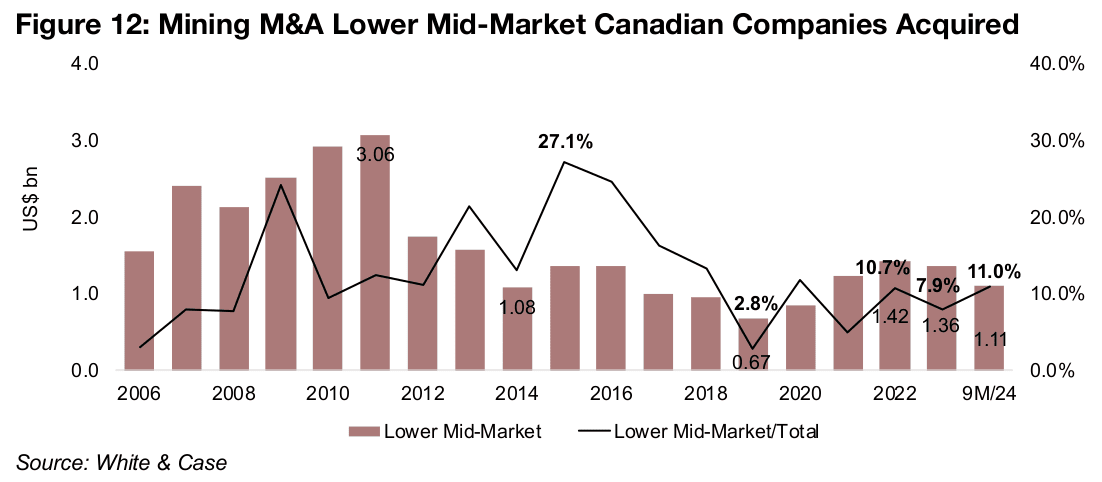
While Canada’s outward global mining M&A look set to rise, deal activity this year within the country could decline. The total mining M&A deal value of global acquirers purchasing Canadian target companies was US$10.1bn over 9M/24, and at the current rate run is not likely to reach the US$17.3bn of 2023 (Figure 11). However, junior mining deal value at US$1.11bn for 9M/24 is on track to surpass the US$1.36bn for full year 2023 (Figure 12). The proportion of junior deals to the total in Canada has also picked up, to 11.1% in 9M/24 versus 7.9% in 2023, but is well off the 27.1% highs of 2015.
Most of producers and TSXV gold decline
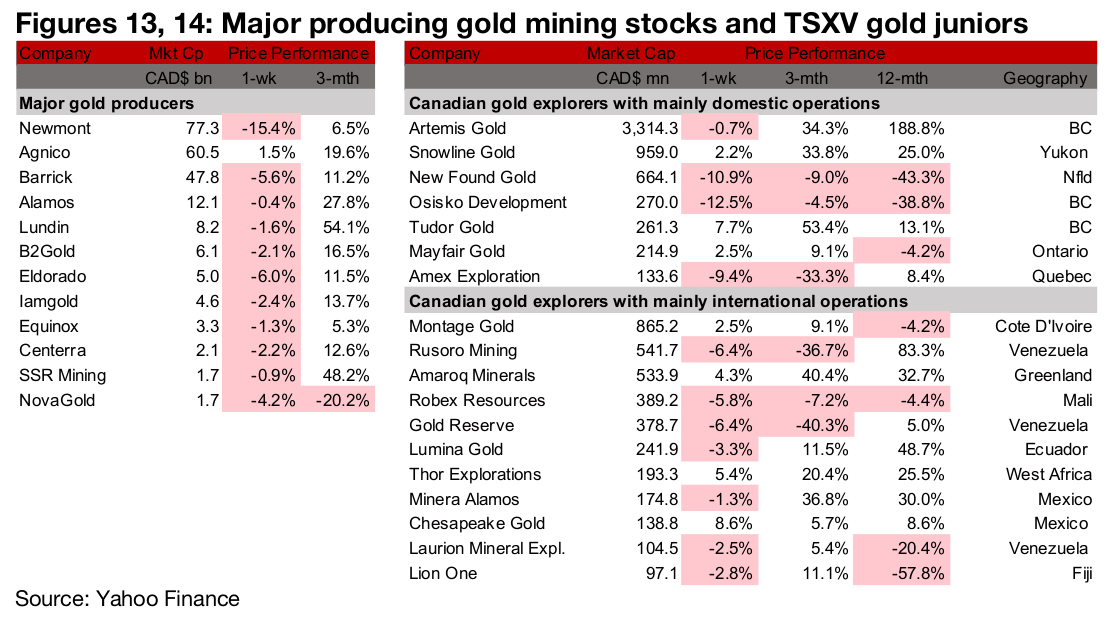
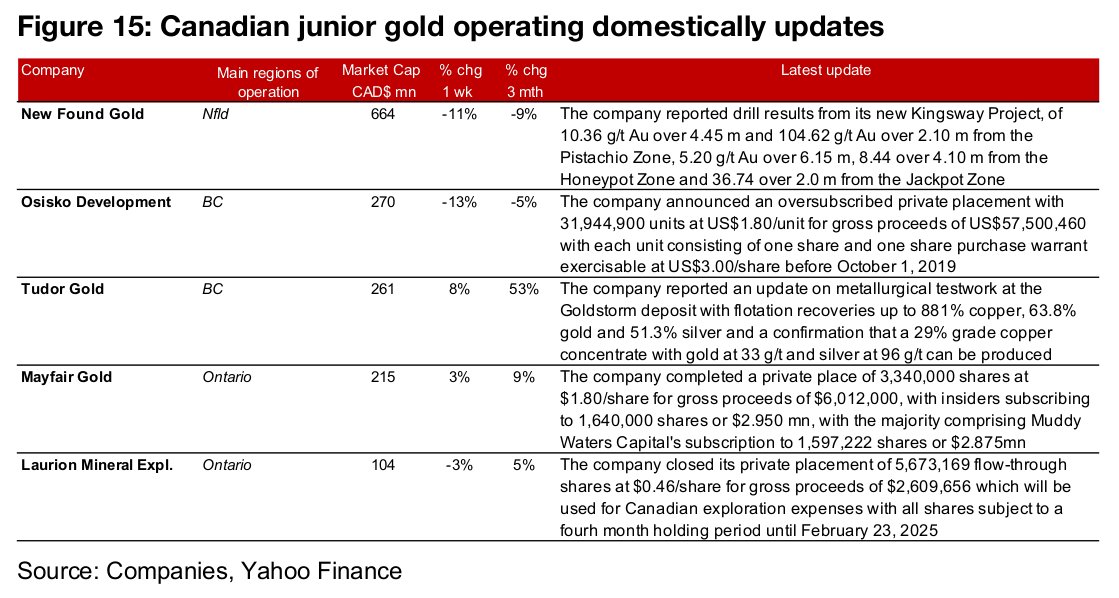
Most of the large producers and TSXV gold were down for the week on the pause in the metal price and weak equity markets (Figures 13, 14). For the TSXV gold companies operating domestically, New Found Gold reported drill results from the Kingsway project, Osisko Development announced that its private placement was oversubscribed, Tudor Gold provided an update on metallurgical testing at the Goldstorm deposit and Mayfair Gold and Laurion Mineral Exploration completed private placements (Figure 15). For the TSXV gold companies operating internationally, Montage Gold announced a US$825mn financing package for Kone and Chesapeake reported metallurgical testing for Metates (Figure 16).

Disclaimer: This report is for informational use only and should not be used an alternative to the financial and legal advice of a qualified professional in business planning and investment. We do not represent that forecasts in this report will lead to a specific outcome or result, and are not liable in the event of any business action taken in whole or in part as a result of the contents of this report.


