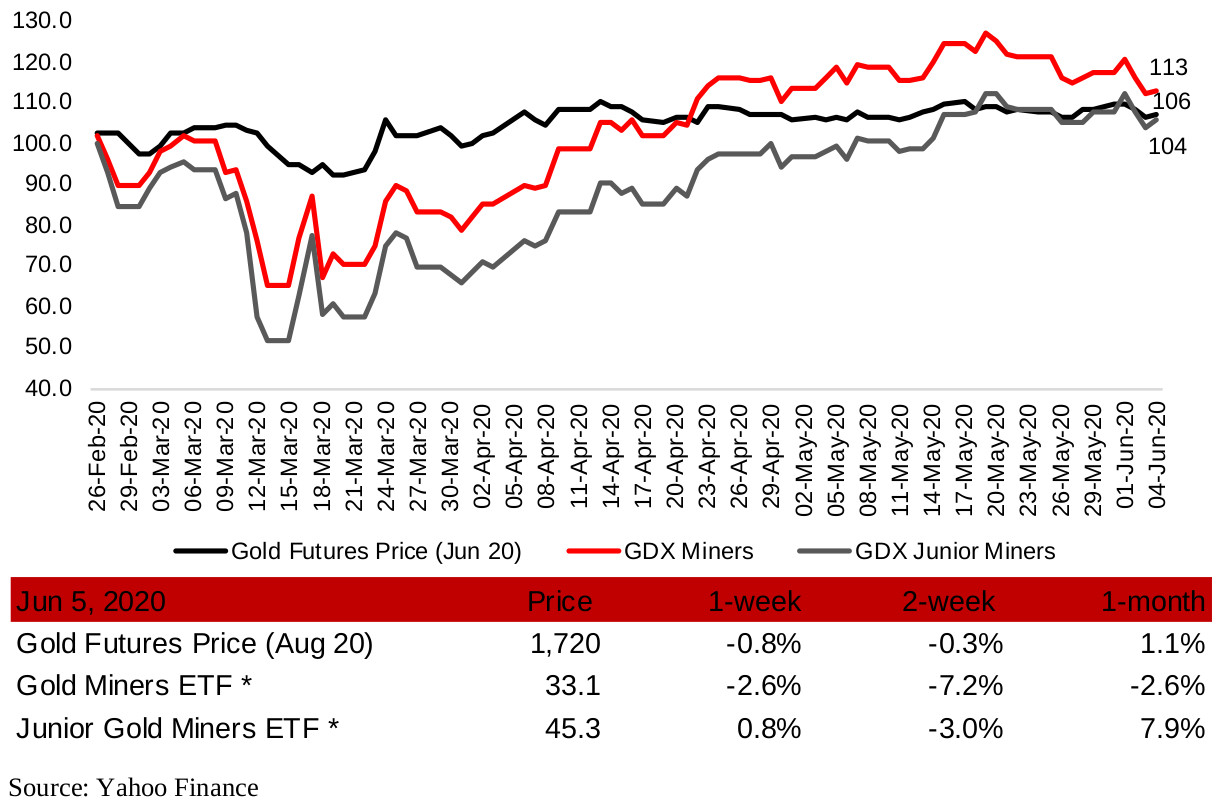
June 5, 2020
Miners dip with strong gold price already baked in
Author - Ben McGregor
Gold bouncing between US$1,680-US$1,760
Gold was down -0.8% this week, but was relatively volatile interweek, in keeping with a price bouncing between US$1,680-US$1,760/ounce for the past two months, with risks neither subsiding or increasing enough to lead to a breakout either way.
Producing miners down on range bound gold and profit taking
The large producing miners mainly saw share price declines this week, with the range bound gold price averaging above US$1,700 already baked into prices and investors taking some profit after a strong recovery in the sector since the crisis lows.
Junior gold mining stocks down, but firms still moving ahead
The Canadian junior gold mining stocks were also down this week, but the firms continue to move ahead, with US$1,700 gold more than enough to drive exploration and capital raising, an example being O3 Mining, which we highlight this week.


Figure 1: Gold futures price and gold mining ETFs
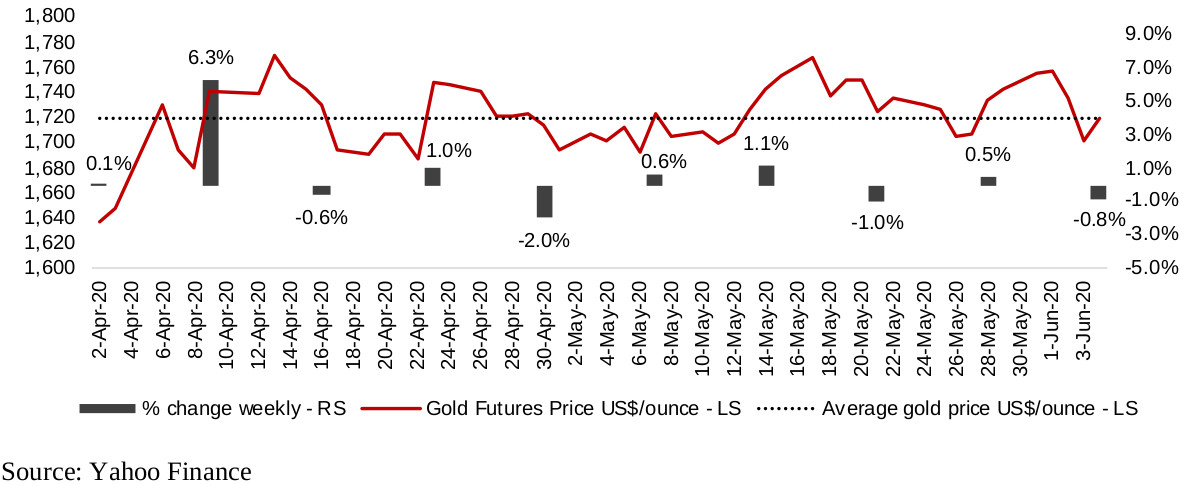
Gold price continues to bounce between US$1,680-US$1,760/ounce
While the gold price was near flat this week, down -0.8%, it moved over a wide range, from a low of US$1,702/ounce to a high of US$1,757/ounce. It has continued to bounce within a range between US$1,680-US$1,760/ounce for nearly two months, with no significant breakouts (Figure 2). While gold has moved on the volatile short-term news flow of economic and political risk, overall, the situation is relatively balanced. Risks are high and likely to remain so for some time, which is enough to maintain the gold above US$1,700, but there is little sign of a radical deterioration in the (already very low) expectations for economic and political conditions which could warrant gold shooting up towards US$2,000. Regardless, gold averaging US$1,700 is more than sufficient to make the junior gold mining stocks interesting, and many junior gold miners have already exited their shutdowns and are continuing to successfully raise capital and continue exploration and development.
Figure 2: Gold futures price over past two months
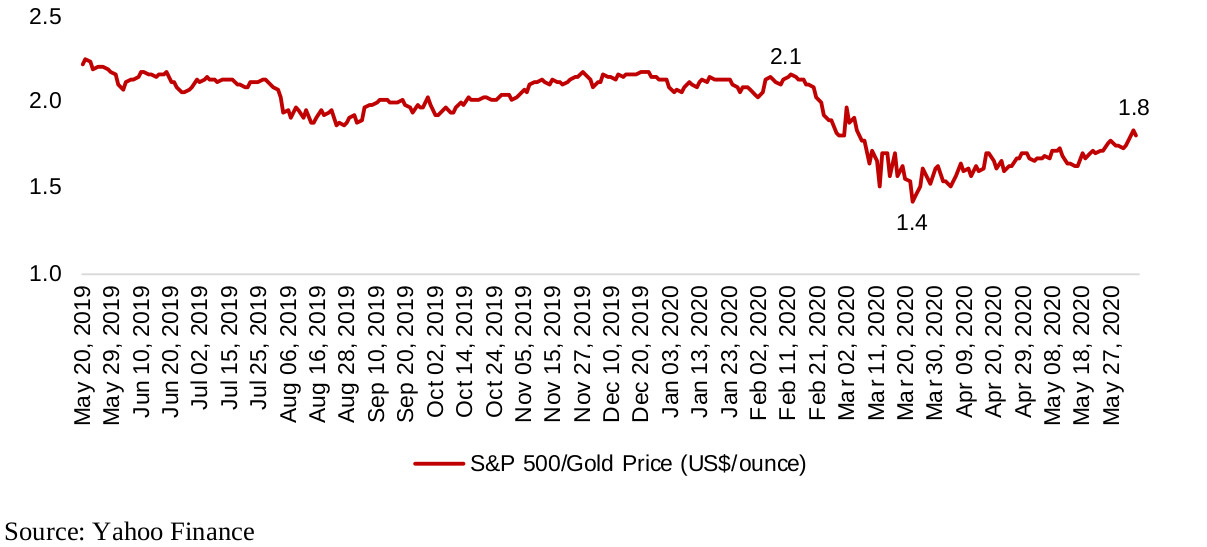
To give further context beyond the short-term movement, we look at two ratios, the gold to silver price ratio, and the S&P 500 to gold ratio (Figures 3 and 4). The gold to silver price ratio historically ranges from highs nearing 100 to lows around 20, so the spike in the ratio to 126 during the March 2020 crisis was well out of historical ranges, and even after a pullback to the current 96, is at the very top. Given the last ten years of extreme monetary expansion, we view this as more of a case of the possible relative undervaluation of silver versus gold, than of an absolute overvaluation of gold, and a rise in silver to close this gap could be seen. The second ratio, the S&P 500 to gold price, has ranged from highs of 5.0x to lows of 0.25x, and averaged around 1.54x. The ratio dipped below this average briefly during the crisis to 1.4x, but has since risen again to 1.8x. Assuming an eventual reversion to the mean, either the gold price will continue to move up, or the S&P 500 will decline.
Figure 3: Gold to silver price ratio
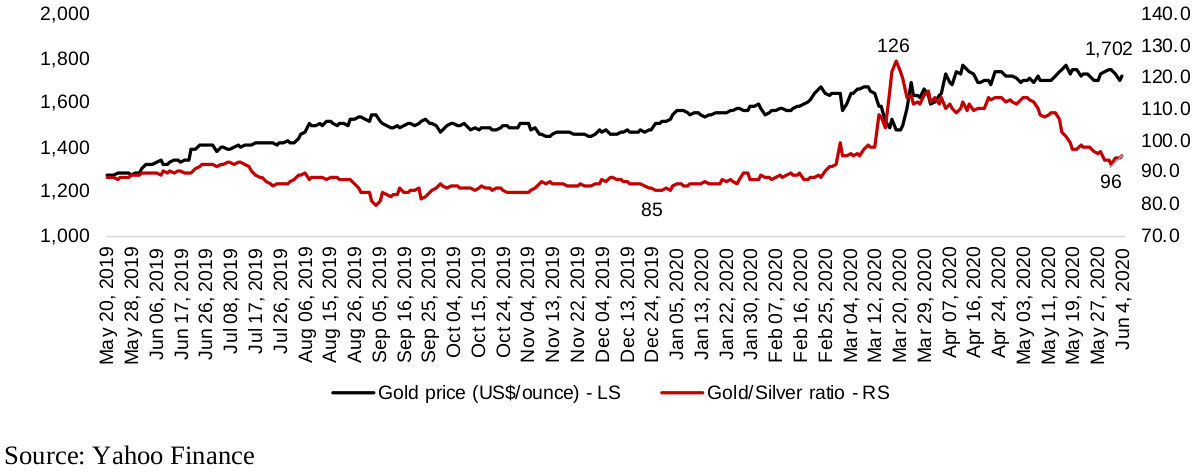
Figure 4: S&P 500 to gold price ratio
Figures 5, 6: Canadian producing gold mining stocks
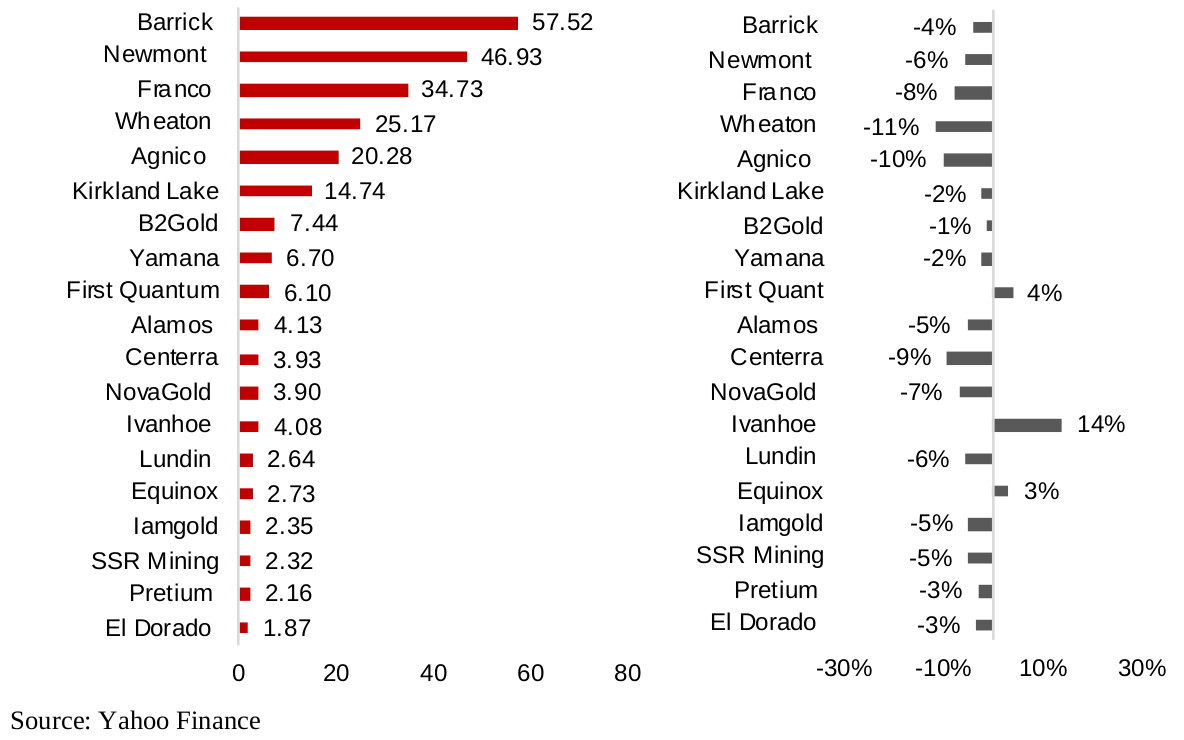
Most producing miners see a down week
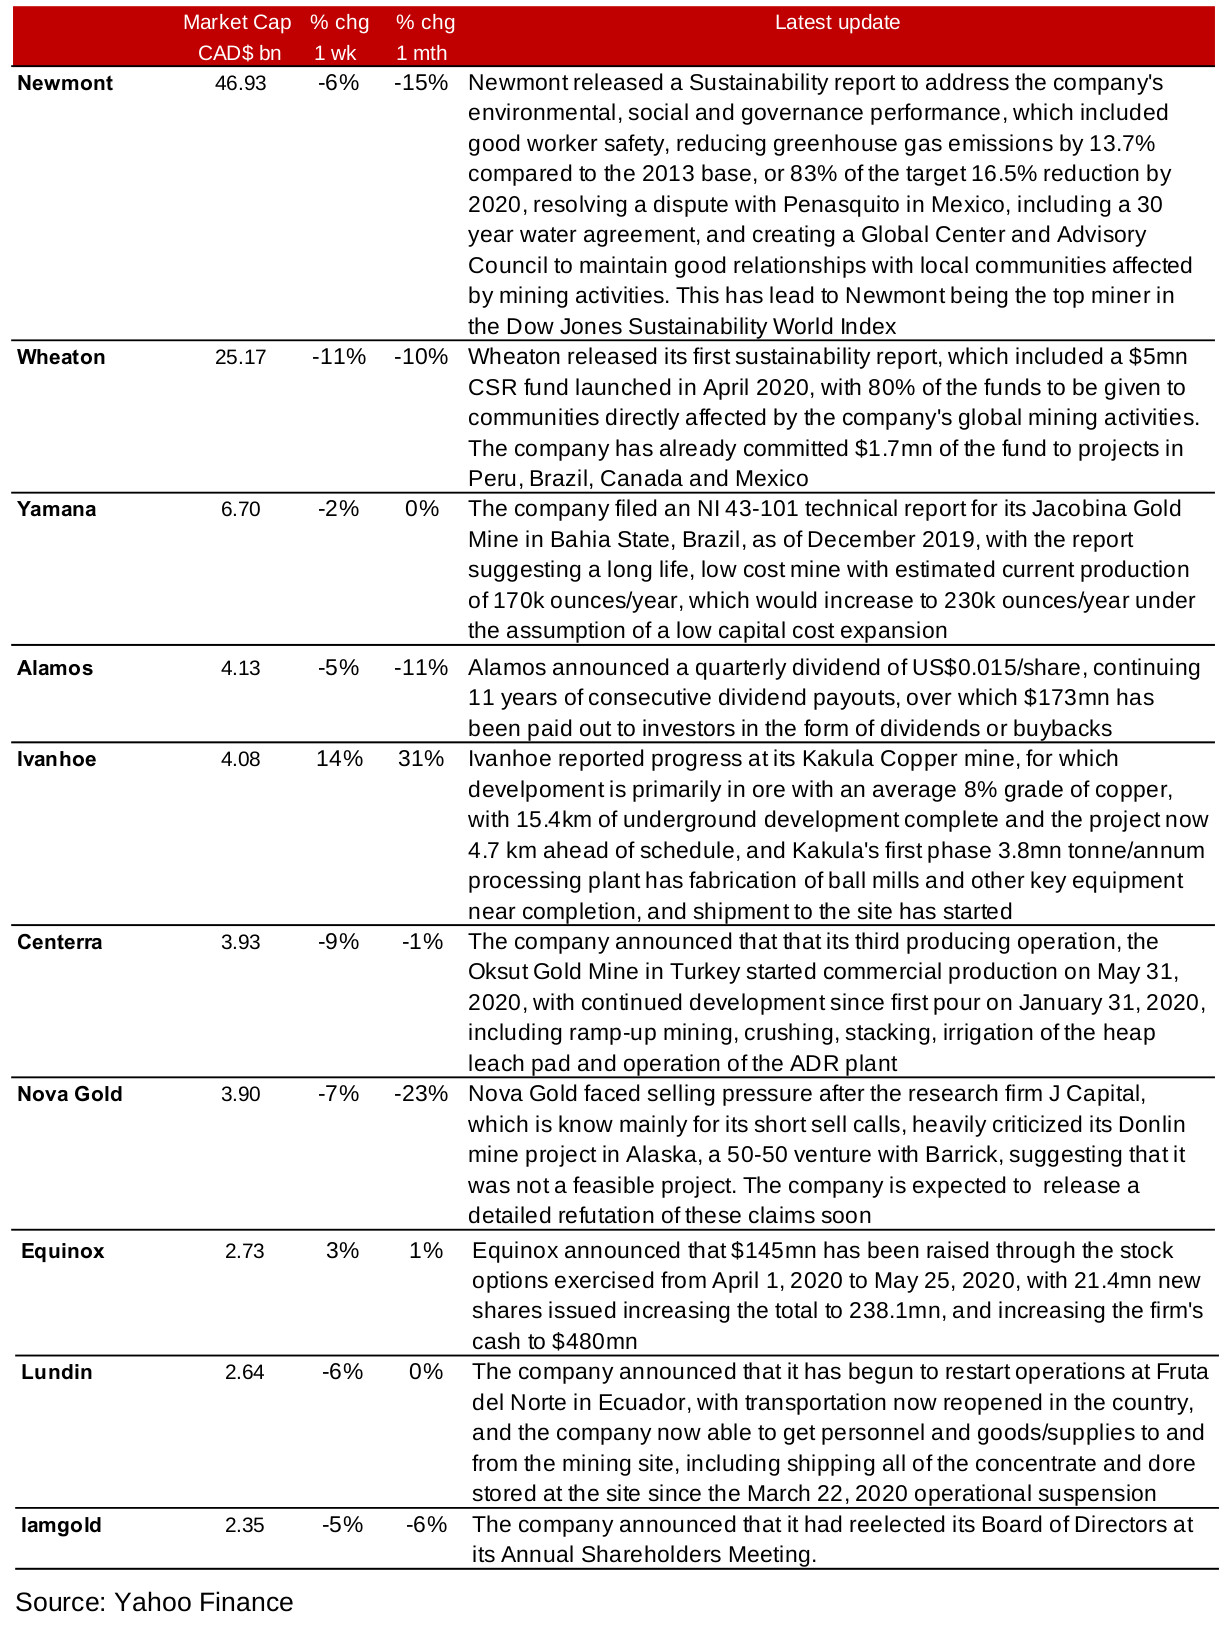
Most of the major producing mines saw declines in their share prices for the second week in a row, as strong gold prices around US$1,700 have already been baked in, but there has been no clear breakout above these levels for nearly two months, and investors continue to take profits after a strong bounce off March 2020 sector lows (Figures 5, 6). The news flow from the miners this week was relatively light in terms of material effects on stocks; Newmont and Wheaton released sustainability reports, Yamana released a technical report for its Jacobina mine, and Alamos reported a quarterly dividend (Figure 7). Two stand outs for material news were Ivanhoe, up 14% after reporting progress at its Kakula mine, and to the downside NovaGold, which faced criticism of the viability of its Yukon project by a short recommendation research company, although it plans to release a response to the report, and its -7% share price decline was not the worst of the sector. Centerra announced the start of its third producing mine, Oskut in Turkey, Equinox reported capital raised through the recent exercise of stock options, Lundin announced it was restarting operations at its Fruta del Norte project in Ecuador, and Iamgold reported the results of its annual general shareholder's meeting.
Figure 7: Producing gold miners updates
Figures 8, 9: Canadian junior gold miners with operations in Canada
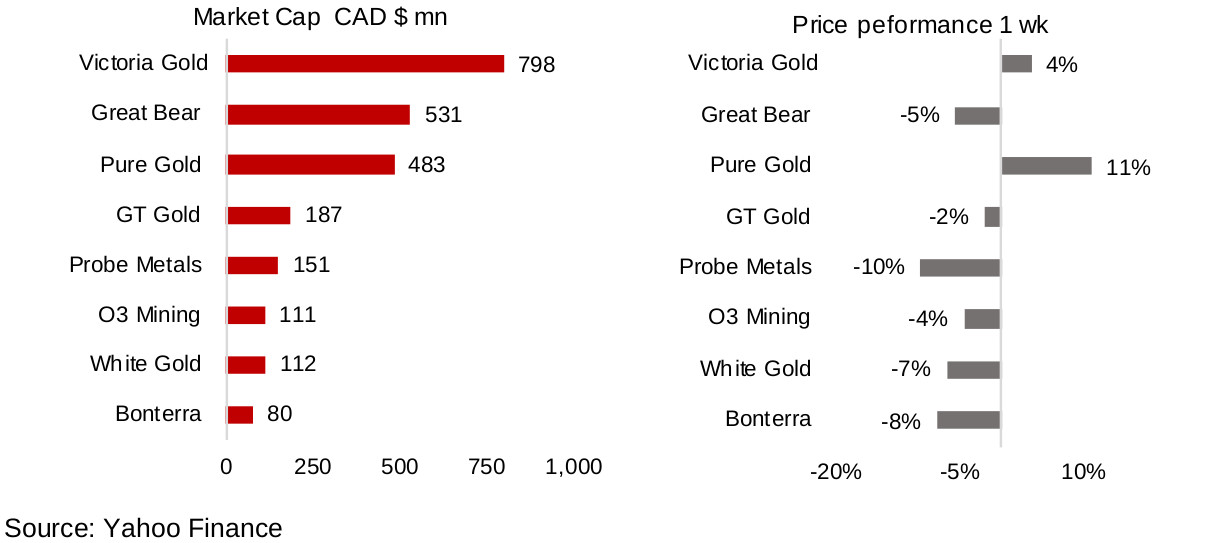
Most Canadian operating juniors decline
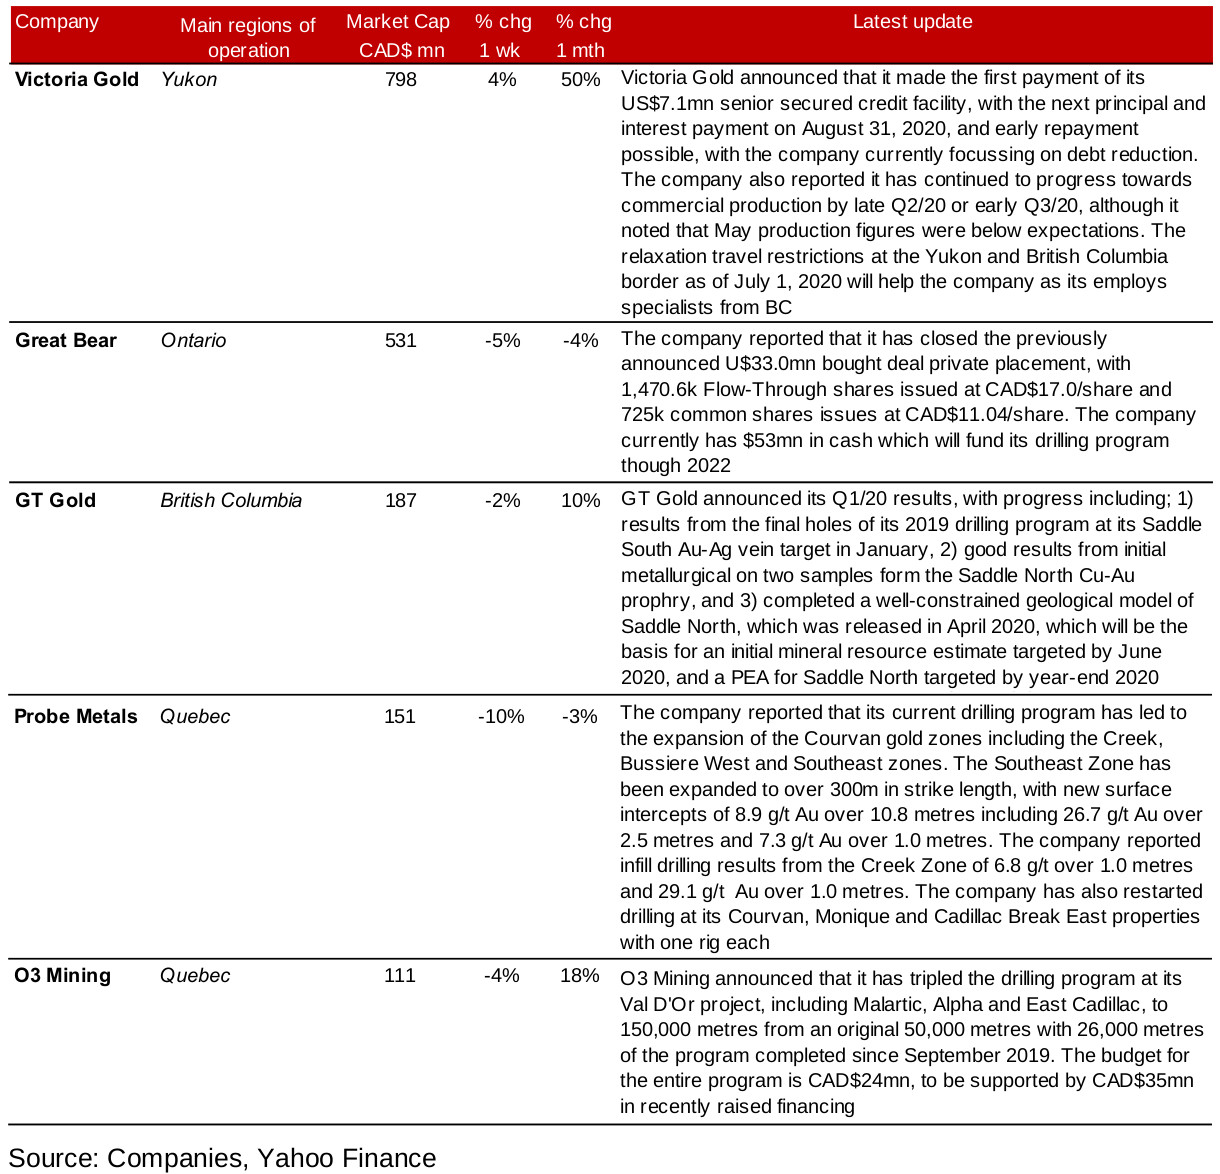
The Canadian operating junior gold mining stocks were mainly down this week, facing similar drivers to the senior gold miners, including profit taking after a substantial run up in the sector off the crisis lows (Figures 8, 9). Company press releases included news that would not be a major surprise to the market, including Victoria Gold's debt repayment, and the expected opening of the Yukon/B.C. border by July 1, 2020 allowing for easier movement of personal, Great Bear's closing of a previously reported private placement, and GT Gold's Q1/20 results, a review of operations already announced to the market (Figure 10). Probe Metals was down 10% even after the release of material news of drilling results, and O3 Mining slid 4% even though it announced a tripling of its current drilling program.
Foreign operating Canadian junior miners mixed
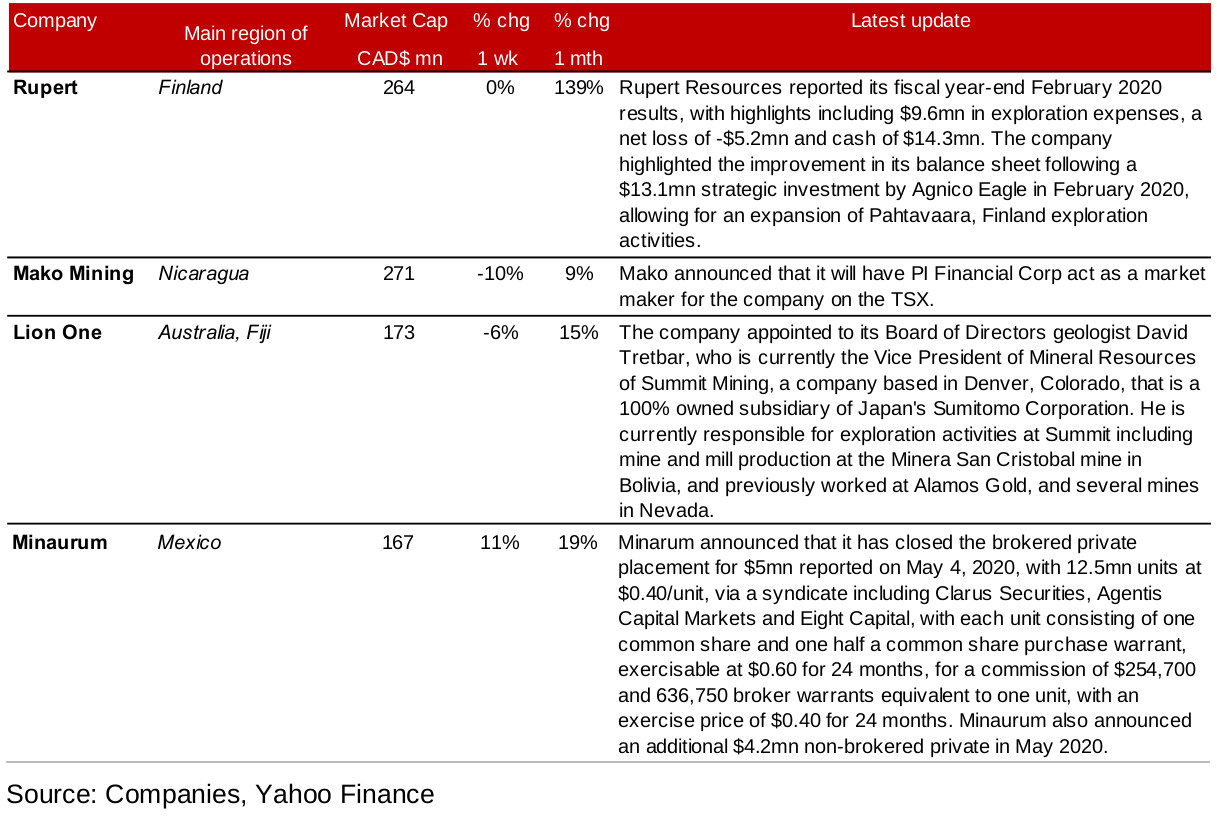
The larger cap foreign operating Canadian junior mining stocks saw a mixed performance this week (Figures 11, 12). There was limited new material information released by the companies, with Rupert Resources reporting its fiscal year end 2020 results, Mako Mining announcing the appointment of a market maker, Lion One appointing a new member to its board of directors, and Minaurum announcing the closing of a private placement that was already reported to the market in early May 2020 (Figure 13).
Figure 10: Canadian junior gold miners operating in Canada updates
Figures 11, 12: Canadian junior gold miners operating mainly internationally
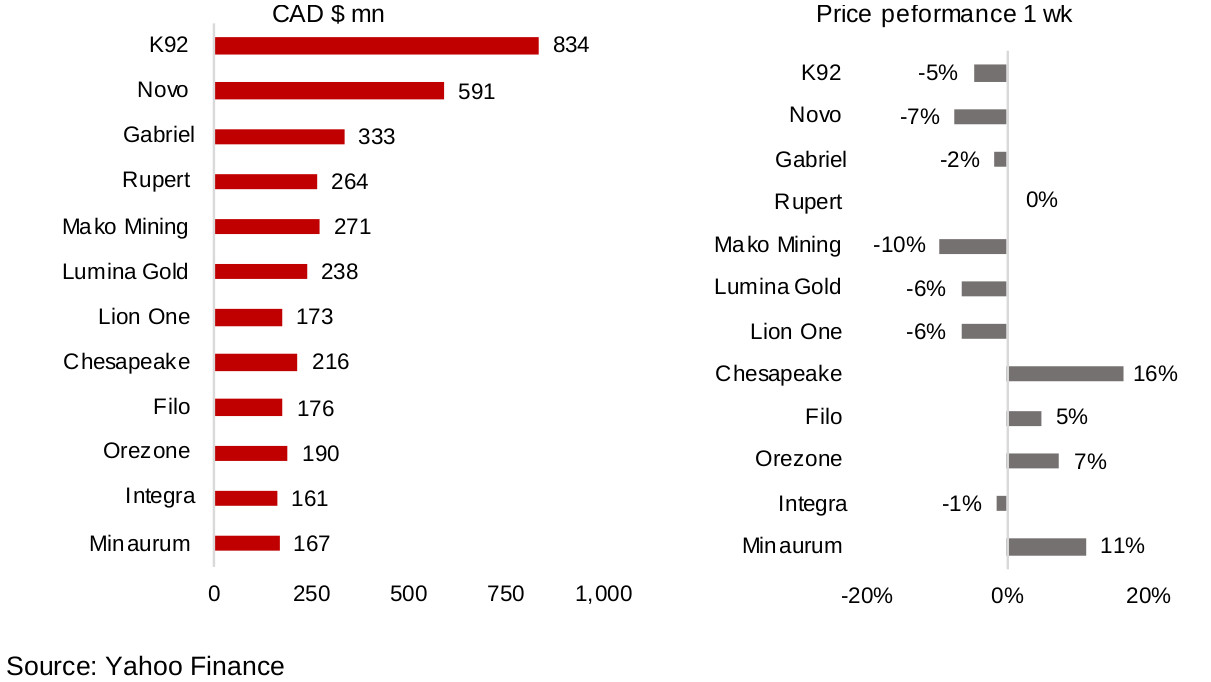
Figure 13: Canadian junior gold miners operating mainly internationally updates
In Focus: O3 Mining
Figure 14: O3 Mining
Osisko spin-off with multiple gold exploration projects in Quebec
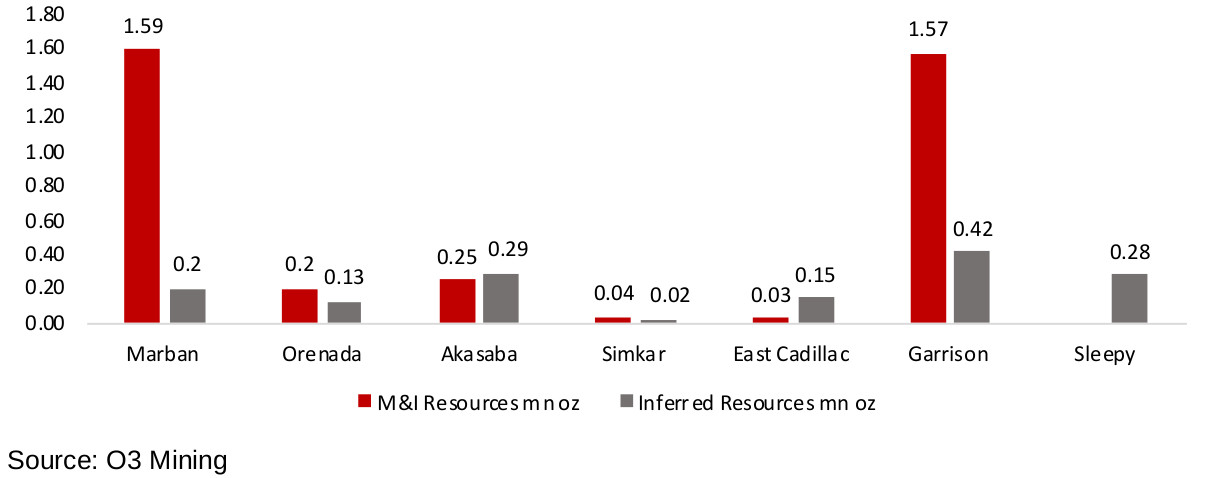
O3 Mining is a spin off from the Osisko Group, which has historically had success in Quebec, having developed, operated and sold a gold mine in the province's Malartic region from 2004-2014. O3 Mining also operates in Quebec, in the Val D'Or region, with seven projects. Marban is the company's flagship project, with a PEA expected by Q4/20, with the Orenada, Akasaba, Simkar, East Cadillac, Garrison and Sleepy projects in earlier stages of exploration (Figure 15). The company has recently announced a tripling of its current drilling program to 150,000 metres from 50,000 metres, with a total 26,000 metres already completed. The drilling program is expected to cost $24mn, which will be more than covered a total CAD$55.8mn in available funding after recently completing financing activities totaling $35mn.
Figure 15: O3 Mining estimated resources by project
Marban, Alpha and East Cadillac the focus of drilling program
O3 Mining has been focused on three projects; Marban, the flagship project, for which a PEA is expected by Q4/20, the Alpha project, which includes Orenada and Akasaba, and East Cadillac. The Marban project has Measured resources of 365k oz Au, Indicated resources of 1.2mn oz Au and Inferred resources of 195k oz Au. For Alpha, Orenada has 194k oz Au in Indicated resources and 126k oz Au in Inferred resources and Akasaba has underground Indicated resources of 122k oz Au and Inferred resources of 272k oz Au and open pit Indicated resources of 132k oz Au and Inferred resources of 16k oz Au. For East Cadillac, the Nordeau West zone has Measured and Indicated resources of 30k oz Au, and Inferred resources of 146k oz Au.
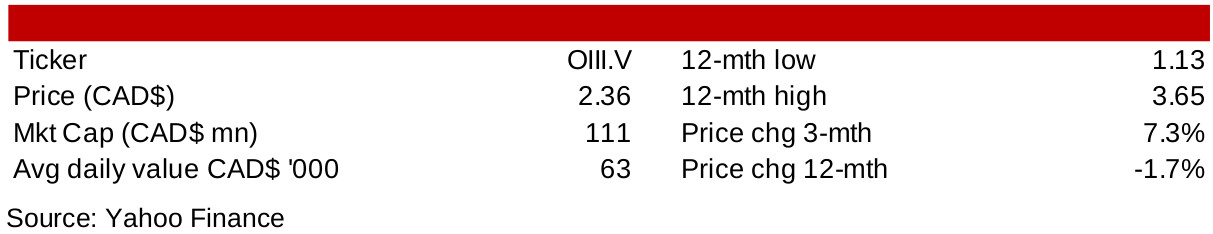
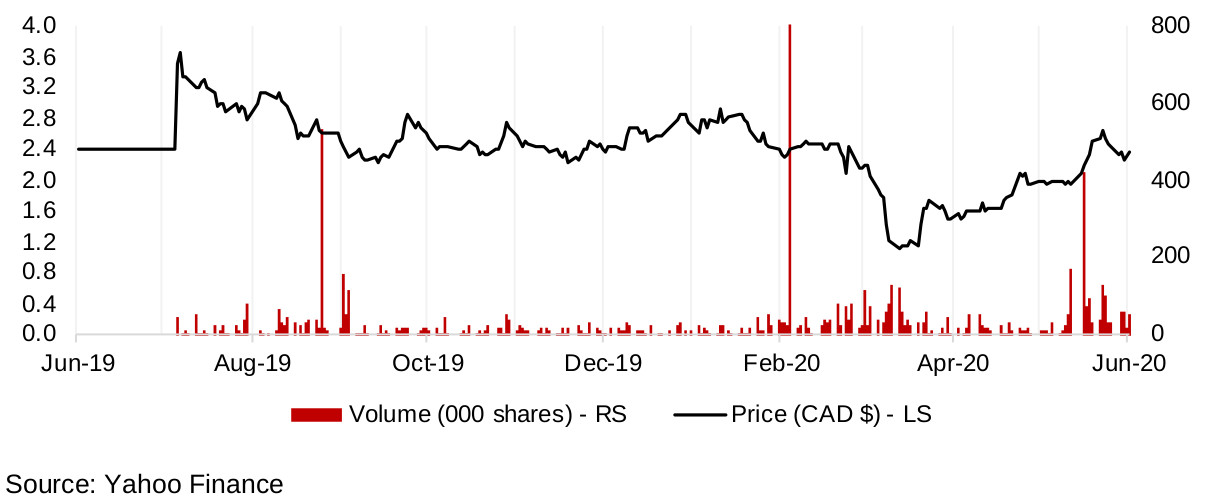
O3 Mining share price back near pre-crash average
O3 Mining has recovered off its March lows, but has dipped over the past two weeks, inline with a general pullback in the gold mining sector, to CAD$2.36, still below the average of around CAD$2.5/share in the six months prior to the crisis. Thus while the market is encouraged enough by the company's strong cash and drilling program to continue to hold the stock near the pre-crisis level, it is still waiting for material results from the current campaign to warrant a move significantly higher.
Figure 16: O3 Mining share price, volume
Disclaimer: This report is for informational use only and should not be used an alternative to the financial and legal advice of a qualified professional in business planning and investment. We do not represent that forecasts in this report will lead to a specific outcome or result, and are not liable in the event of any business action taken in whole or in part as a result of the contents of this report.