August 28, 2023
Mid-Cap TSX Gold Developers Driving Forward
Author - Ben McGregor
Gold price up even with hawkish Fed comments
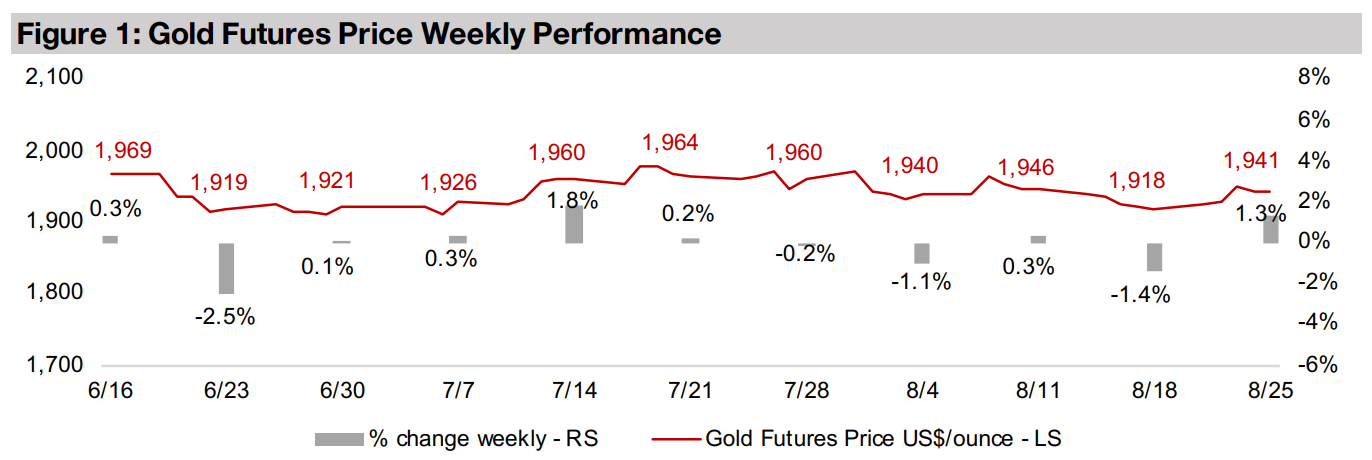
The gold price rose 1.3% to US$1,941/oz even with hawkish comments from the US Fed Chairman which saw the US$ rise, as US bond yields edged down and there was a slight return to risk on with the S&P gaining after a month-long downtrend.
Mid-cap TSX gold developers see strong operational progress
This week we look at the mid-cap TSX gold developers which overall have continued to make substantial progress on moving their respective projects towards production, supported by a sustained relatively strong gold price over the past few years.


Mid-Cap TSX Gold Developers Driving Forward
Gold rose 1.3% to US$1,941/oz even with a rising US$ as US bond yields declined
and there was a minor shift back into risk assets after a few weeks of nervous markets,
with the S&P 500 up 0.58%. The key economic news was a speech from the US Fed
Chairman which was hardly dovish, therefore driving the only relatively muted gain in
the market. The speech made clear that further interest rate hikes were still a
possibility, and that the economy was still running too hot given current levels of core
inflation near 5.0%, considerably above the Fed’s 2.0% target. Also, the Fed
indicated that even if rates were not hiked further, that they would likely remain at
current levels for an extended period.
The slightly bullish sentiment in the large cap S&P 500 Index did not carry over into
the small cap space, with the Russell 2000 Index down -0.35% for the week. However,
this did not drag down the junior gold stocks, with the GDXJ up 4.2% for the week,
on the rise in the gold price, which also boosted the GDX, up 3.5%. This showed that
the sector continues to be able to shake off downward equity market pressure as the
long as the gold price gain is substantial enough, as seen repeatedly this year.
Mid-Cap TSX gold developers drive ahead with sustained high gold price
This week we look at the TSX mid-cap gold developers, which have continued to make considerable progress on their respective projects in the last few years, sustained by the high gold price. This contrasts with the gold bear market of 2013 to 2018 when the low gold price made several of these projects, with their relatively high initial capex and only moderate graded, less attractive to more cautious capital markets. However, given that we expect that the gold price will at least remain at current levels for the next few years, and have a reasonable probability of increasing substantially, the economics of these projects should remain robust.
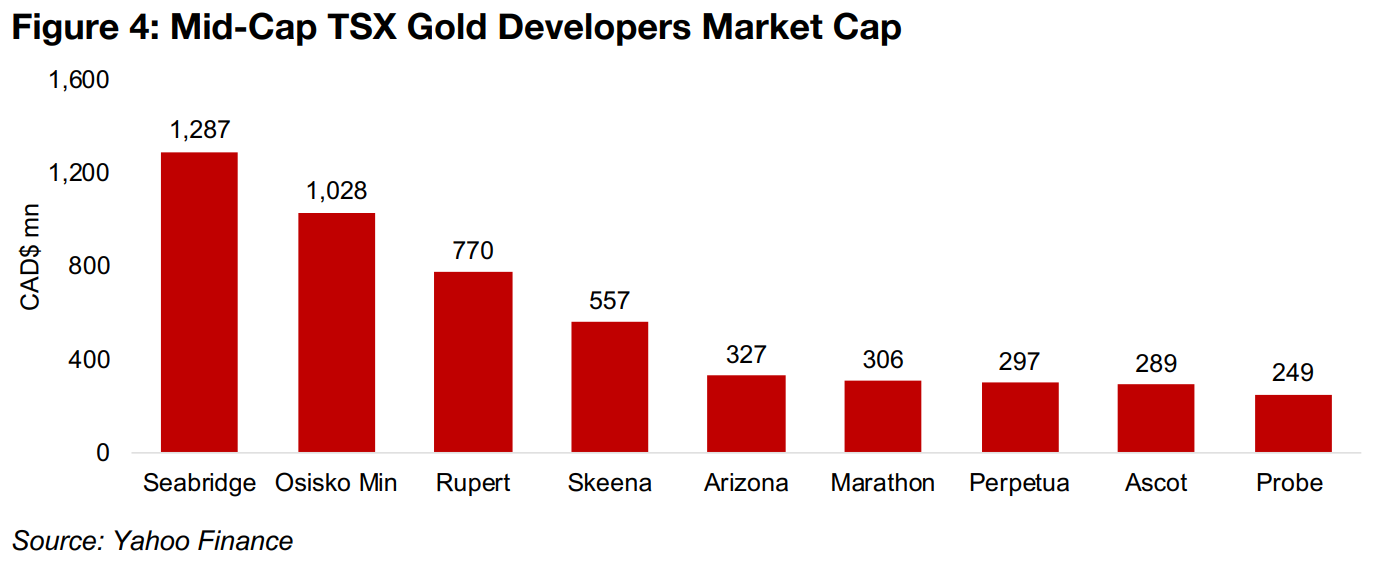
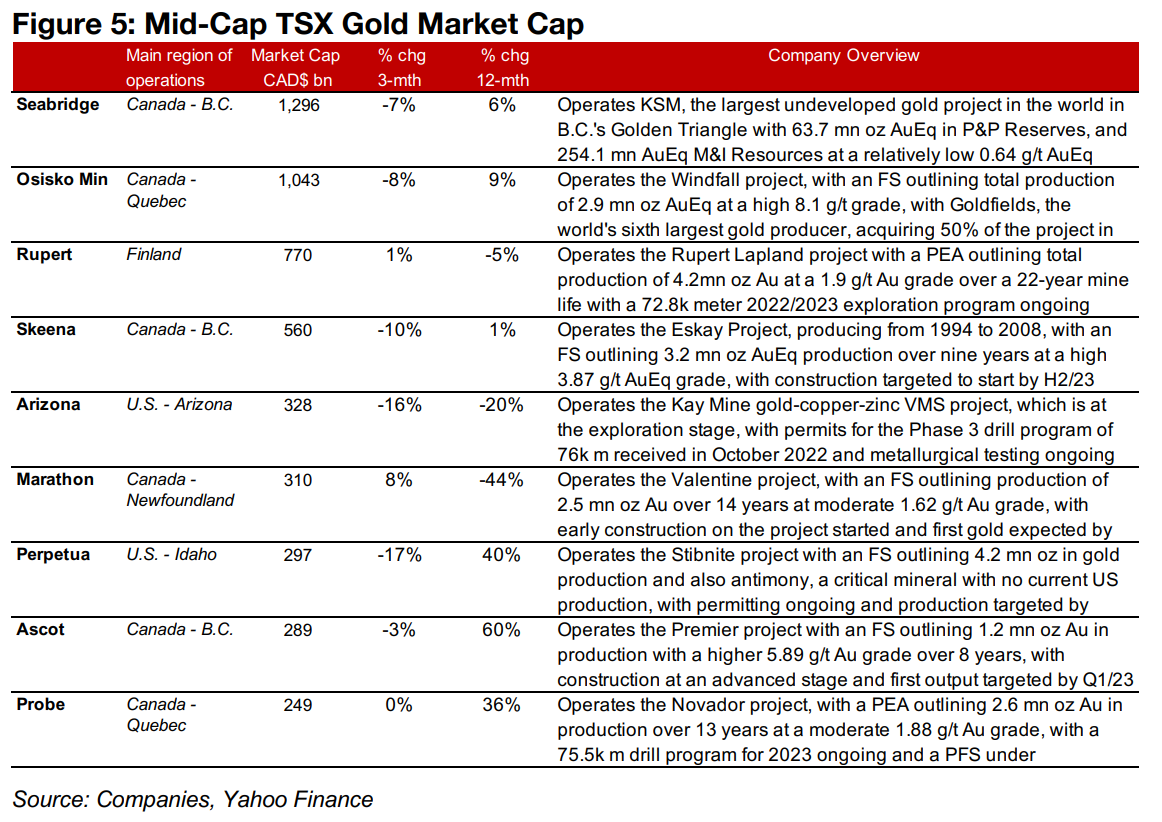
There are nine mid-cap TSX gold developers, defined as companies with over CAD$250 in market cap, including Seabridge Gold (CAD$1,296mn), Osisko Mining (CAD$1,043mn), Rupert Resources (CAD$770mn), Skeena Resources (CAD$560mn), Arizona Metals (CAD$328mn), Marathon Gold (CAD$310mn), Perpetua Resources (CAD$297mn), Ascot Resources (CAD$289mn) and Probe Gold (CAD$249mn) (Figures 4, 5).
Seabridge dwarfs the rest of the TSX mid cap developers
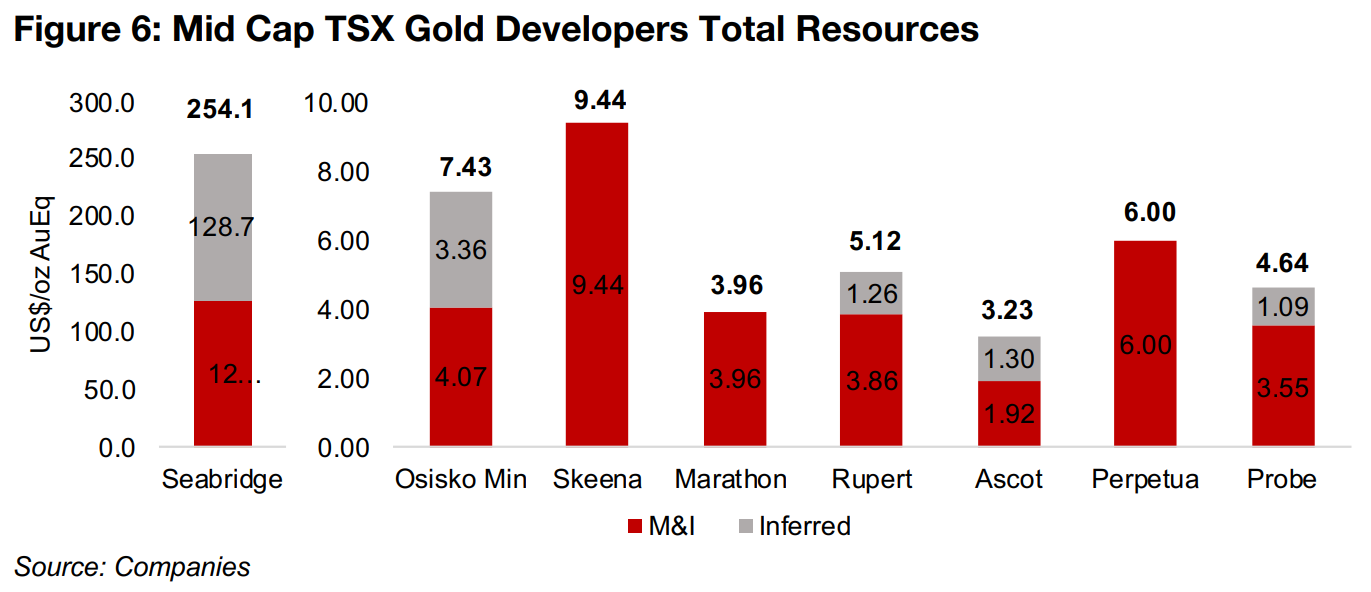
Seabridge Gold, developing KSM, completely dwarfs the rest of the group with its
KSM project, the largest undeveloped gold project in the world, with 64.7mn oz AuEq
in total forecast production, including gold, copper and silver. It also has other
projects for a total 254.1mn oz AuEq in M&I Resources, about twenty-five times as
high as the next largest company Skeena, and literally goes 'off the chart', requiring
a different scale from the resources for the rest of the companies (Figure 6).
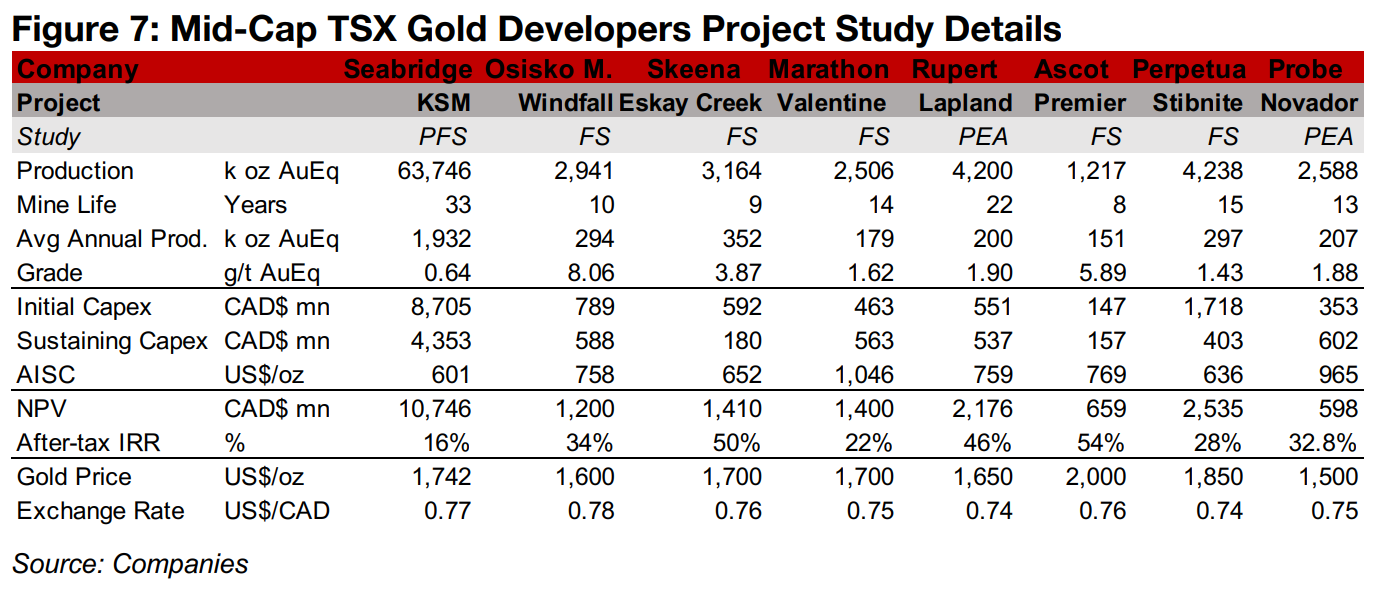
However, even with Seabridge’s massive resource, its market cap is only about 30%
higher than the next largest stock, Osisko Mining. One major issue is that the grade
of KSM is low, at just 0.64 g/t AuEq, well below half the next highest grade of
Marathon Gold’s Valentine at 1.62 g/t Au (Figure 7). Another issue is that the company
needs to finance a massive CAD$8,705mn in initial capex for the project, and even
with a reasonably strong financing environment for the gold industry current, this is
still a major risk given the quite low grade.
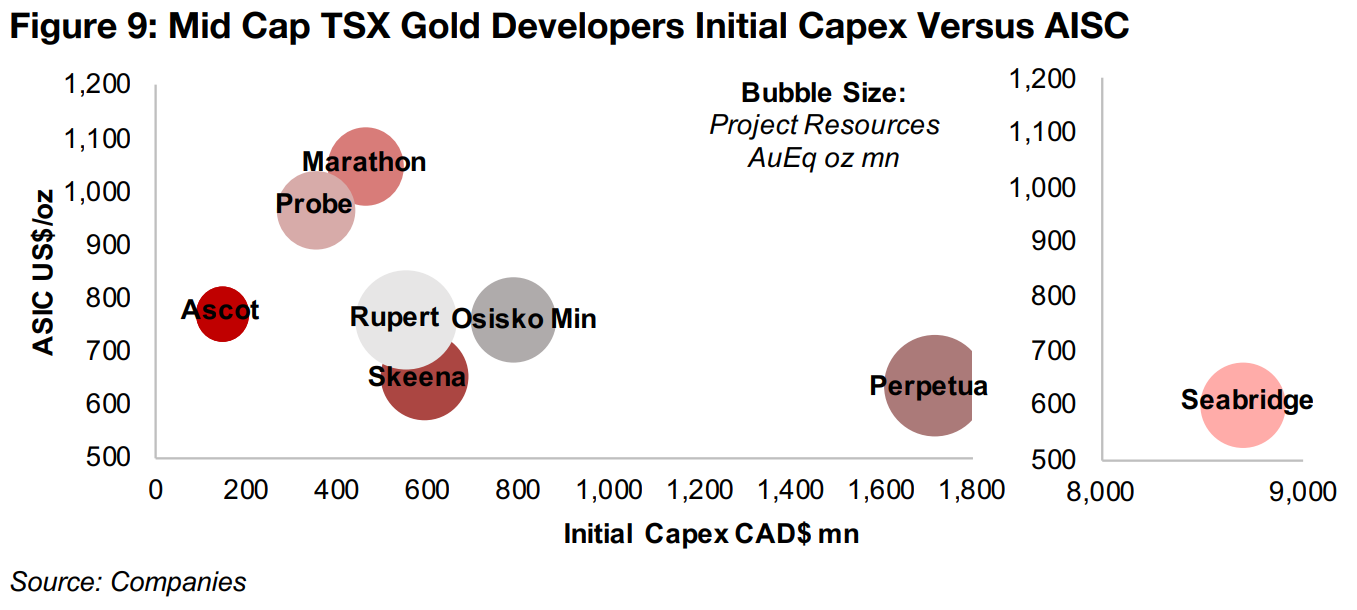
Seabridge needs to have 'substantially started' the KSM project by July 2026 to maintain its current environmental assessment approvals, so financing announcements will be major drivers for the stock over the next two years (Figure 8). Seabridge currently estimates output going on for nearly a century if the 33 years of production from the 2022 KSM Pre-Feasibility Study is followed by the 39 years of production estimated in an additional 2022 PEA covering areas not included in the PFS. While the project’s huge initial capex again sends it off the chart in Figure 9, its all-in-sustaining-cost (AISC) per oz is the lowest of the group, at just US$601/oz.
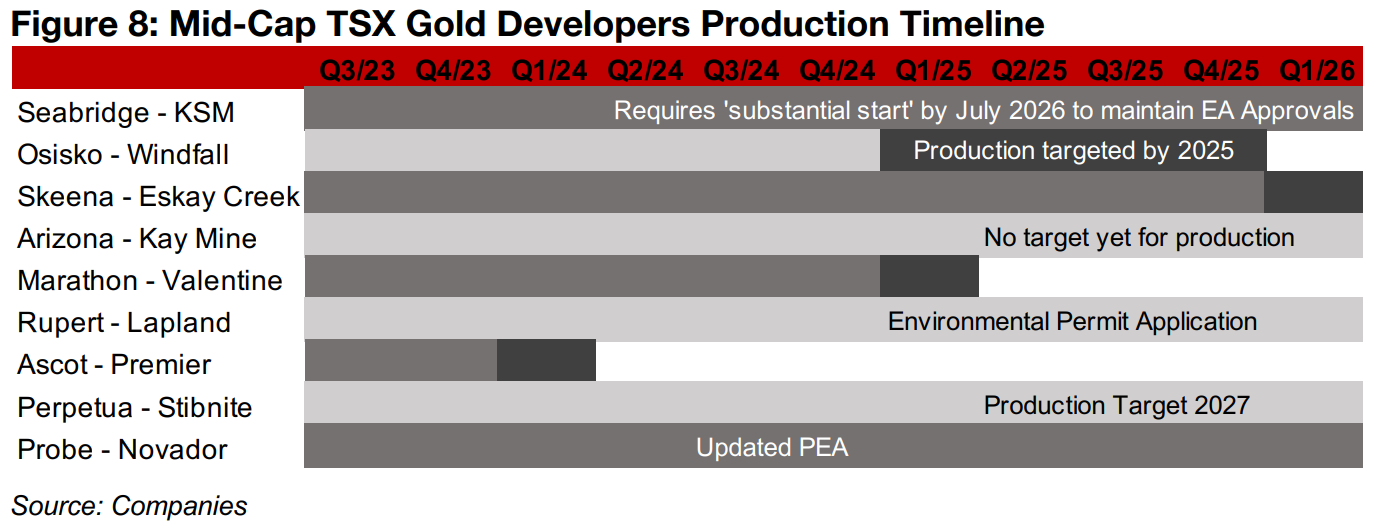
Production targeted for Osisko Mining by 2025, for Skeena by 2026
The next two largest companies by market cap, Osisko Mining, and Skeena
Resources, are targeting production for their flagship projects Windfall and Eskay
Creek by 2025 and Q1/26, respectively. The projects have similar levels of resources
with Windfall at 3.1 mn oz AuEq and Eskay Creek with 2.9mn oz AuEq, and while
both have very high grades, the former is outstanding at 8.06 g/t AuEq, over double
the 3.87 g/t AuEq of the latter.
Windfall's high grade would have been a major factor in a 50% acquisition of the
project announced in May 2023 by South Africa’s Gold Fields, the sixth largest global
gold producer. The move will greatly reduce the risks in raising the quite high
CAD$789 mn in initial capex for the project, half of which will be funded by Gold
Fields. Eskay Creek has a lower initial capex of CAD$592 and lower AISC of
US$652/oz, compared to an AISC of CAD$758/oz for Windfall.
Arizona at earlier stage, Marathon and Ascot closest to production
Arizona Metals does not feature in most of our charts here as it is the only one of the large TSX developers that has not reached the resource estimate or project study stages for its Kay Mine project. The project is gold-copper-zinc, with its Phase 3 76k m drill program proceeding after permits were received in October 2022, while metallurgical testing is ongoing. The two companies closest to production are Marathon, with output expected from the Valentine project by Q1/25, and Ascot, with first gold from the Premier Mine targeted by Q1/24. The FS for Valentine indicates 2.5 mn oz Au in production at moderate 1.62 g/t Au grade over a 14-year mine life and it has the highest unit cost of the group with an AISC of US$1,046/oz. While Premier is the smallest project of the group with an FS outlining just 1.2mn oz Au production, its grade is high at 5.89 g/t Au and its AISC at US$769/oz is near the group average.
Rupert and Probe at PEA Stage, high initial capex for Perpetua's project
Both Rupert and Probe are only at the PEA Stage for their projects, Rupert Lapland and Novador, and have not reported target dates for production yet. The total production forecast for Rupert Lapland is a high 4.2 mn oz Au at a moderate grade and AISC of 1.90 g/t with a US$759/oz. Novador’s production is targeted at 2.6mn oz Au at almost the same grade of 1.88 g/t Au, but with a significantly higher AISC of US$965/oz. Perpetua has announced a 2027 production target for Stibnite, although it already has a Feasibility Study, with high expected production of 4.2 mn oz Au over 13 years, at a moderate 1.88 g/t Au. Initial capex is quite high for the project, at 0.68x its NPV, second only to Seabrige at 0.81x. However, offsetting this to a degree is that that in addition to gold, antimony will be produced, a critical mineral for which there is no current US production, and therefore political support for the project could be reasonably high and smooth its path to financing.
Few major deviations from EV/Resource versus grade valuation line
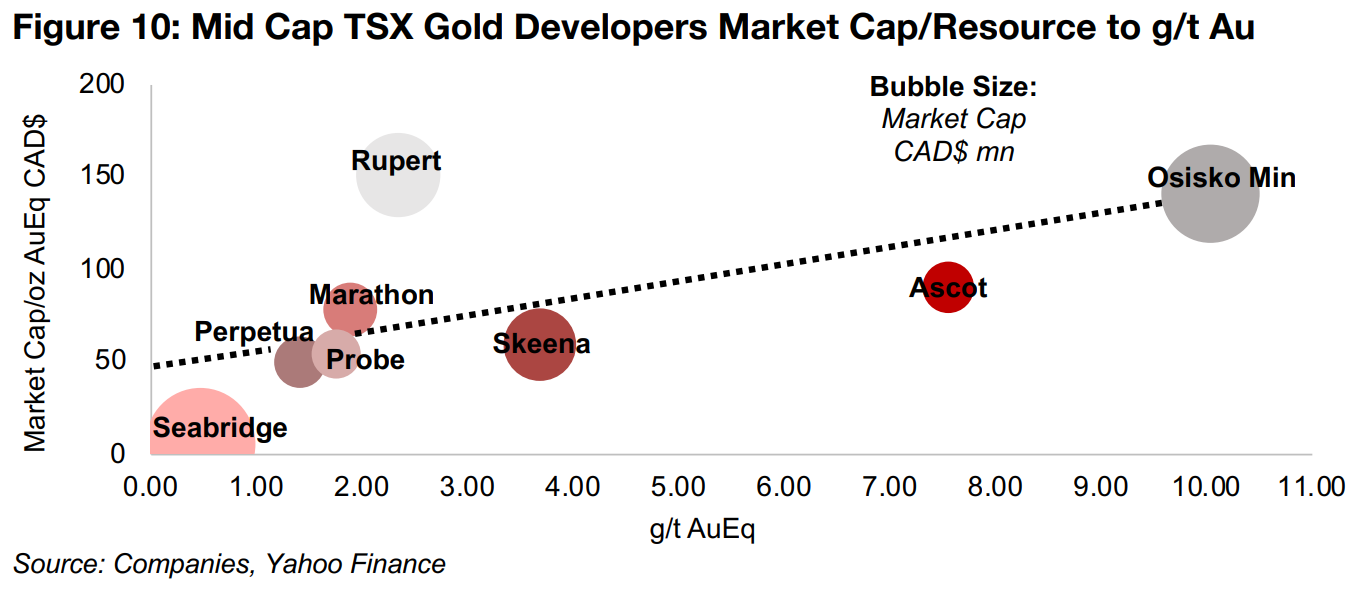
Figure 10 shows a basic relative valuation framework for the group, comparing the
Market Cap/Resource, or what the market is paying for each ounce of a company’s
resources, versus its grade per tonne. It would be expected that as the grade
increases the market would pay more per ounce of gold, all other things equal. The
line in the chart gives us an indication of how the market is valuing the companies
using these metrics, and those far below or above the line could be considered under
or overvalued. However, deviation from the line could also come from other factors
including cost differences, district risks or management or many other issues and so
gives a broad view rather than acting as a precise measure.
Most of the companies are reasonably close to the line, including Perpetua, Probe,
Marathon, Skeena, Ascot and Osisko Mining. However, Seabridge is well below the
line, with the market paying much less for it on Market Cap/Resource basis. This is
because a large proportion of its resources could be recovered three decades or
more into the future, making their value discounted back to the present quite low. If
we were only to include the 63.7 mn oz Au for the current KSM PFS, it would rise
much closer to the line. Rupert trades well above the line with the market paying a
considerable premium in terms of Market Cap/Resource although its grade is not high
versus the group. While its Rupert’s IRR is reasonably high at 46% on a US$1,650/oz
gold price, Skeena has a similar 50% IRR for Eskay Creek, using US$1,700/oz gold.
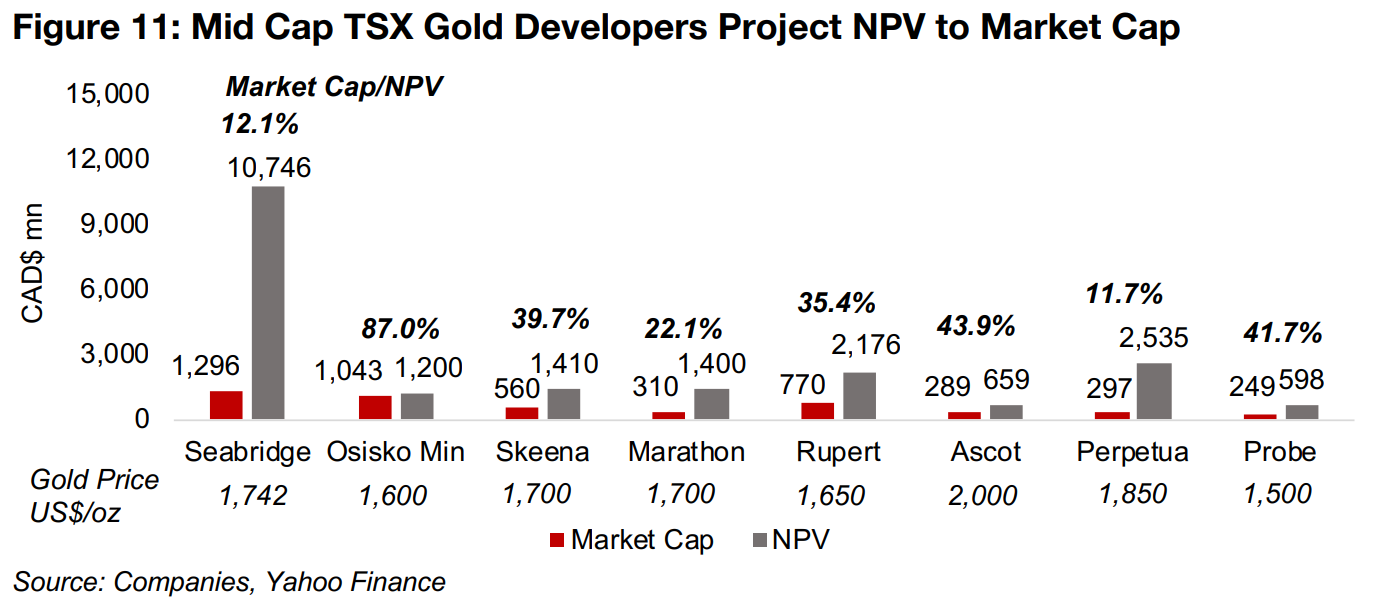
A Market Cap/NPV valuation shows the percentage of the expected total value of the
companies’ main projects for which the market is already paying (Figure 11).
Seabridge again stands out on this measure, with the market cap only 12.1% of the
total expected value, given the very long life of the project, and therefore low present
value of much of its later cash flows, and the risk involved in funding the huge initial
capex. The market has also priced in just 11.7% of the NPV of Perpetua’s Stibnite,
which also has a high initial capex given its size.
Osisko Mining’s Windfall has the opposite situation, with the market paying almost
the entire project NPV, at 87.0%. The rest of the projects range from a market cap to
NPV of 22.1% to 43.7%, a reasonable range for pre-production projects, accounting
for a decent proportion of the expected value while still factoring in considerable risks
in getting to and sustaining the estimated production. One of the biggest issues with
the Market Cap to NPV valuation is that different companies use different gold price
assumptions in their NPVs, so these ratios are not entirely comparable.
Mixed price performance for mid-cap TSX gold developers
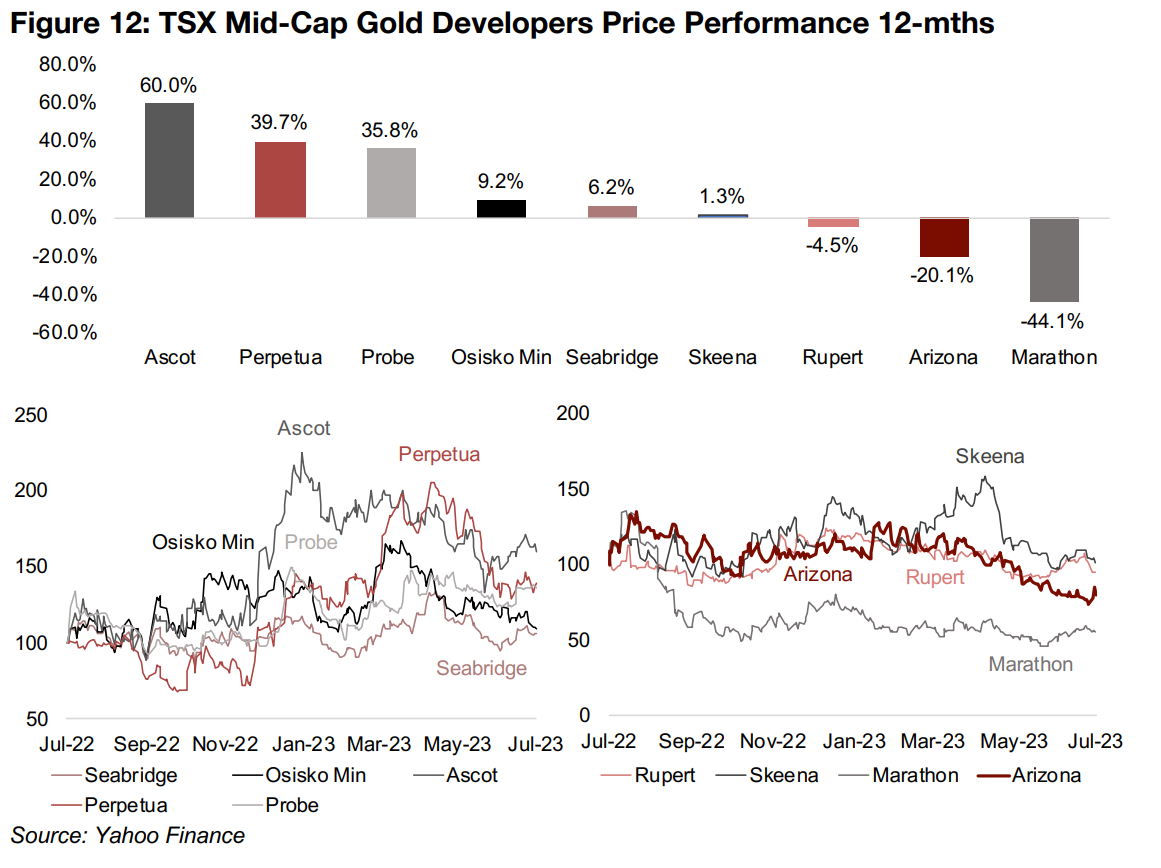
The stock performance for the group over the past year has been mixed, as the gold price has remained relatively steady and company specific factors will have been the key drivers. Ascot has been the major outperformer, up 60.0%, as it is now only a few quarters away from production, Perpetua has gained 39.7%, and Probe Gold is up 35.8% given a considerable increase in its resources over the past year (Figure 12). Four companies have seen muted moves, with Osisko Mining up 9.2%, Seabridge rising 6.2%, Skeena near flat gaining 1.3% and Rupert down -4.5%. Arizona has declined -20.1%, as the market has generally shifted away from riskier early-stage projects, and Marathon has declined the most, by -44.1%.
Strong upside to consensus targets for TSX mid-cap gold developers
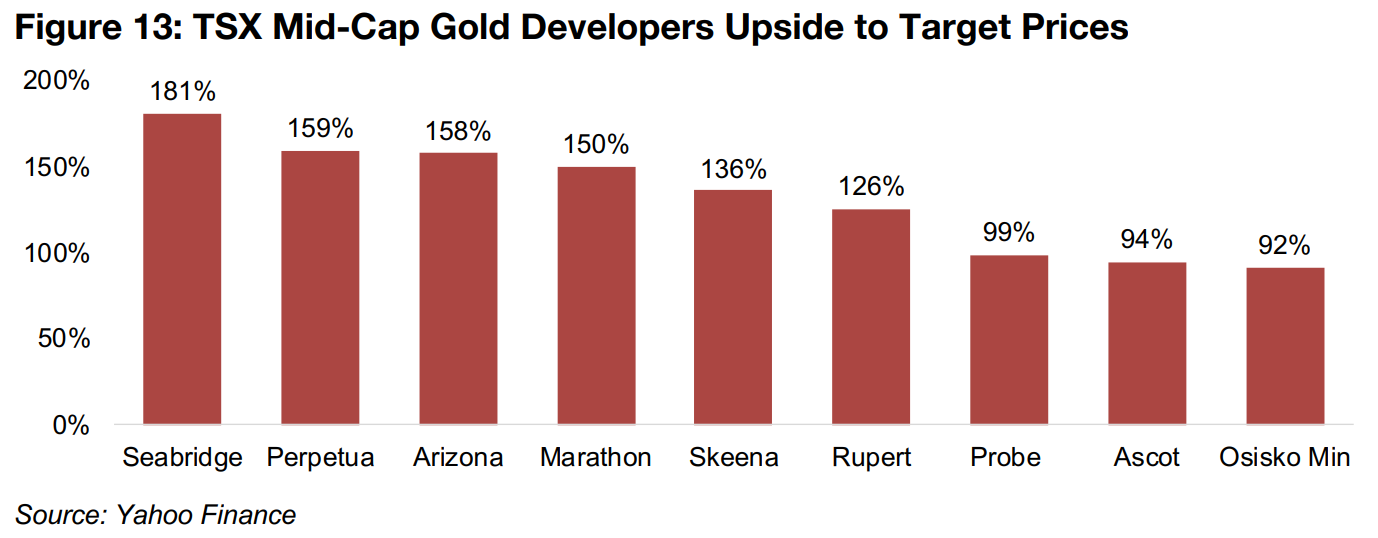
The market is targeting strong upside for entire group, from 90% up to near 200%. The highest upside is targeted for Seabridge with most of the value of KSM still to be priced in by the market (Figure 13). Strong upside is also expected for Perpetua, with its current discount likely driven by the risks of funding a high initial capex, which is also an issue for Seabridge. Arizona’s strong upside is likely because it trades at a discount because of its earlier stage of exploration and lack of a resource estimate. The market has priced in a relatively low proportion of the value of the projects for Marathon, Skeena and Rupert, which likely accounts for the high upside to their targets. Probe and Ascot will have come closer to their targets after strong gains over the past year, and much of the value of Osisko’s Windfall project has been priced in.
Major gold producers nearly all up and TSXV large gold mixed
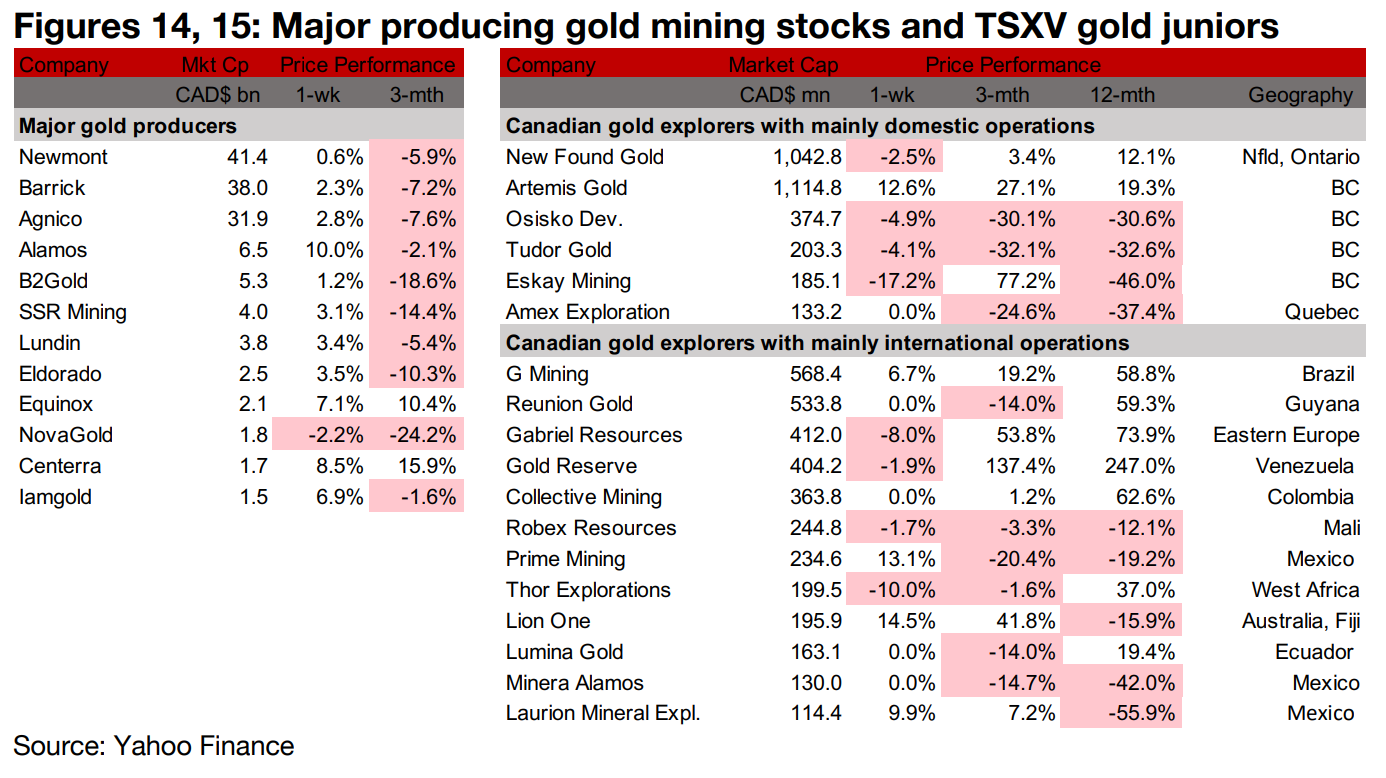
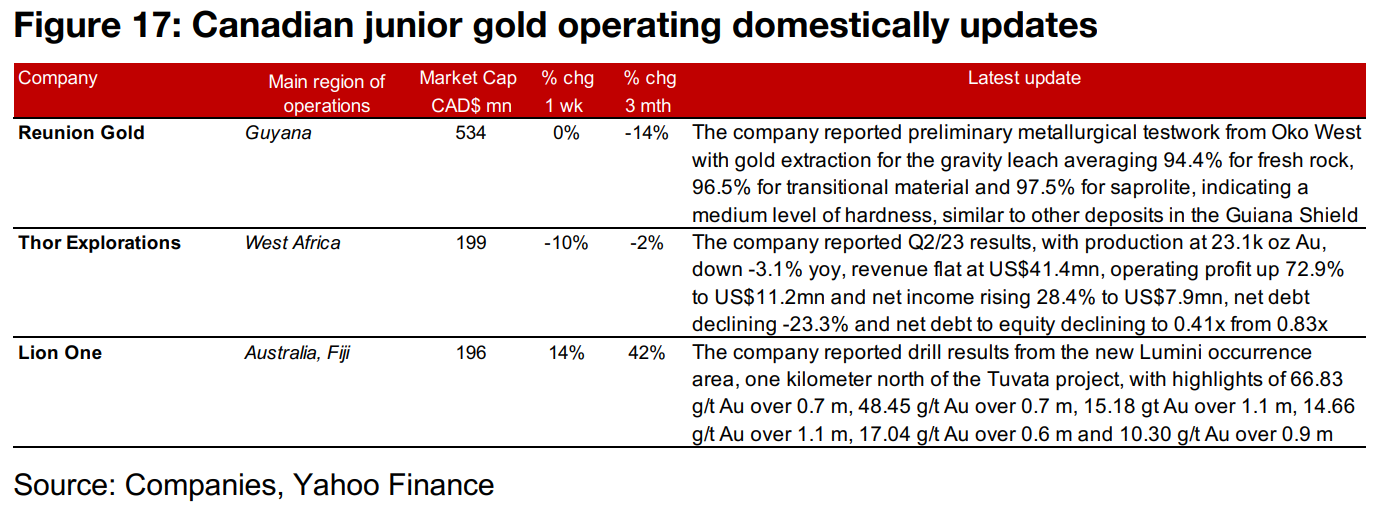
The major gold producers were all up but one, and TSXV large gold were mixed (Figures 14, 15). For the TSXV gold companies operating domestically, New Found Gold completed its 3-D Seismic Survey and reported drill results from the Iceberg Zone of Queensway (Figure 16). For the TSXV companies operating internationally, Reunion Gold reported preliminary metallurgical testwork from Oko West, Thor Explorations announced Q2/23 results and Lion One released drill results from the new Lumini occurrence area one kilometer north of its Tuvatu project (Figure 17).

Disclaimer: This report is for informational use only and should not be used an alternative to the financial and legal advice of a qualified professional in business planning and investment. We do not represent that forecasts in this report will lead to a specific outcome or result, and are not liable in the event of any business action taken in whole or in part as a result of the contents of this report.


