June 03, 2024
Lithium and Palladium Lagging
Author - Ben McGregor
Lithium, palladium underperform major metals from April 2024
This week we look the drivers of lithium and palladium, which have underperformed the major metals since April 2024, and compare the latter with its cousin platinum, which has had a relatively strong performance over the past two months.
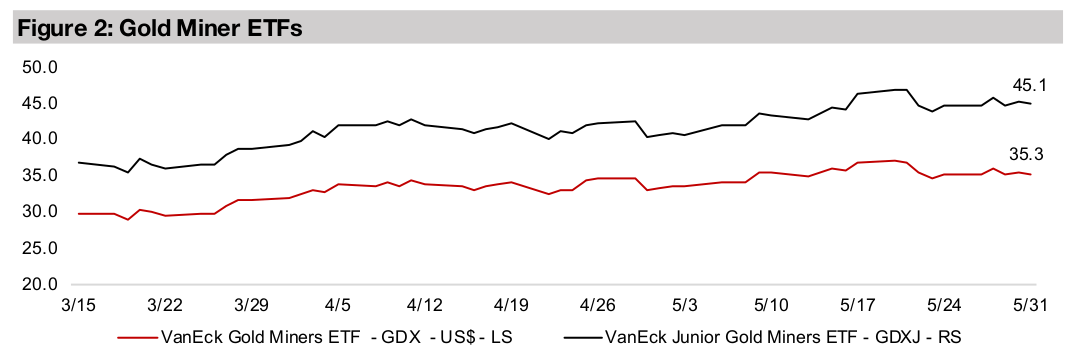
Producing gold stocks flat but juniors rise
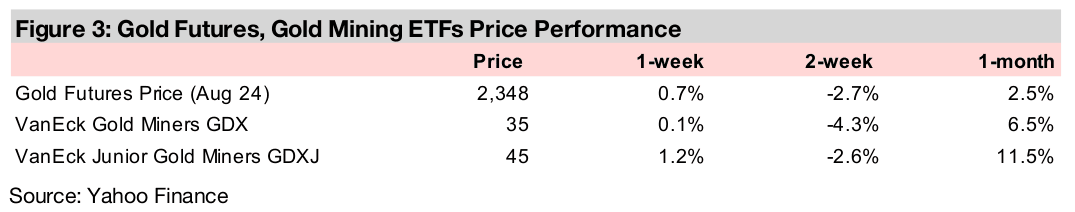
The producing gold stocks were near flat, with the GDX up 0.1% as the stagnation in large cap equities offset the rise in the gold price, although the GDXJ rose 1.2%, propelled by the gain in small cap equities, while large TSXV gold was mixed.


Lithium and Palladium Lagging
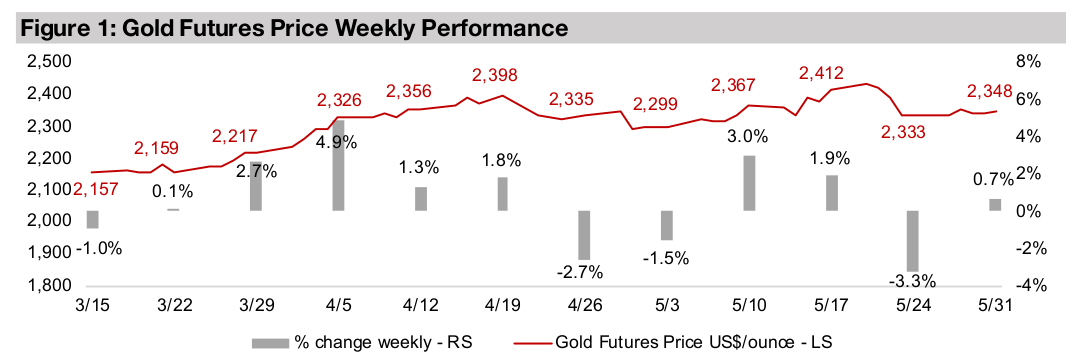
The gold price rose 0.7% to US$2,348/oz, as macro surprises were limited this week,
with the US Personal Consumption Expenditure (PCE) price index coming in as
expected. The headline and core PCE price index rose 0.3% and 0.2% month on
month, respectively, in line with analysts’ estimates. A month-long rise in equity
markets cooled, with the S&P down -0.1% and Nasdaq off -0.3%, although there
was still moderate gains in the Russell 2000 small cap index, up 0.44%. The gain in
gold but sluggish large caps saw the GDX ETF of gold producers near flat with a 0.1%
rise, but the increase in small caps boosted the GDX ETF of gold juniors by 1.2%.
While a decline in big tech stocks weighed on the Nasdaq, with the sector FANG ETF
down, this was offset somewhat by Nvidia, which has still had a very strong
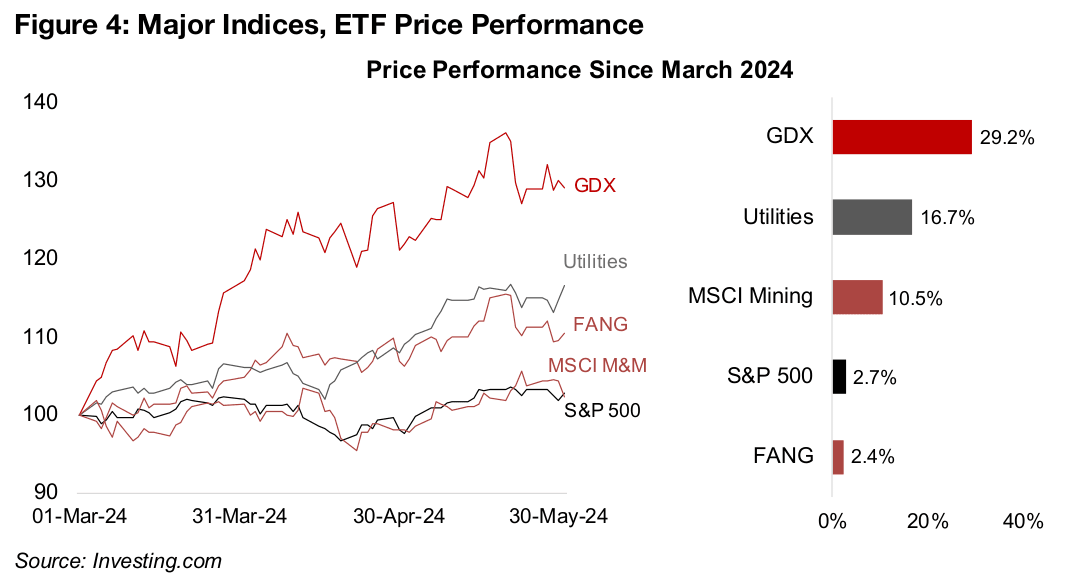
performance this year. While US tech is still ahead of defensive sectors like gold and
utilities YTD, most of the gains were made in the first two months of the year, and the
sector has struggled since. In the past three months, these safer sectors have
substantially outperformed, with the GDX up 29.2% and utilities rising 16.7%, versus
a 2.7% and 2.4% gain in the S&P 500 and FANG ETF, respectively (Figure 4).
This indicates a sustained shift towards a more defensive stance since March 2024,
with the market hedging their bets even in the risk-on rally of the past month. There
has also finally been a substantial move back into a long underloved mining sector,
with the MSCI Metals and Mining ETF up 10.5%. The rotation we had expected since
late 2023 away from US tech euphoria and into other markets and sectors that had
been looking increasingly undervalued seems to finally be underway.
Metals surge continues to lose some steam
The big rise in many of the major industrial cycle-driven metals (as opposed to gold,
which is driven more by monetary factors) since April 2024 continued to cool. Copper,
the global industrial bellwether, has declined -8.4% over the past two weeks, having
been up as high as 31.0% YTD (Figure 5). It is now up just 14.3% for the year, similar
to aluminum, the other major global industrial indicator, up 14.1%, after it also pulled
back this week, along with zinc, tin, platinum and palladium. Part of this move since
April 2024 will have been fundamentally driven, on both rising global demand and
stubborn inflation that could drive up commodities prices more broadly.
However, some analysts had also suspected that part of the move was becoming
increasingly speculative, with reports of hedge funds that were not previously big
players in the space taking large positions. While at least some of the speculative
move seems to be unwinding over the past two weeks, it remains to be seen how
long this reversal could run. With interest rates in most major economies at multi-
decade highs, we still see a significant risk to global growth, which could hit the
industrially-metals from the demand side.
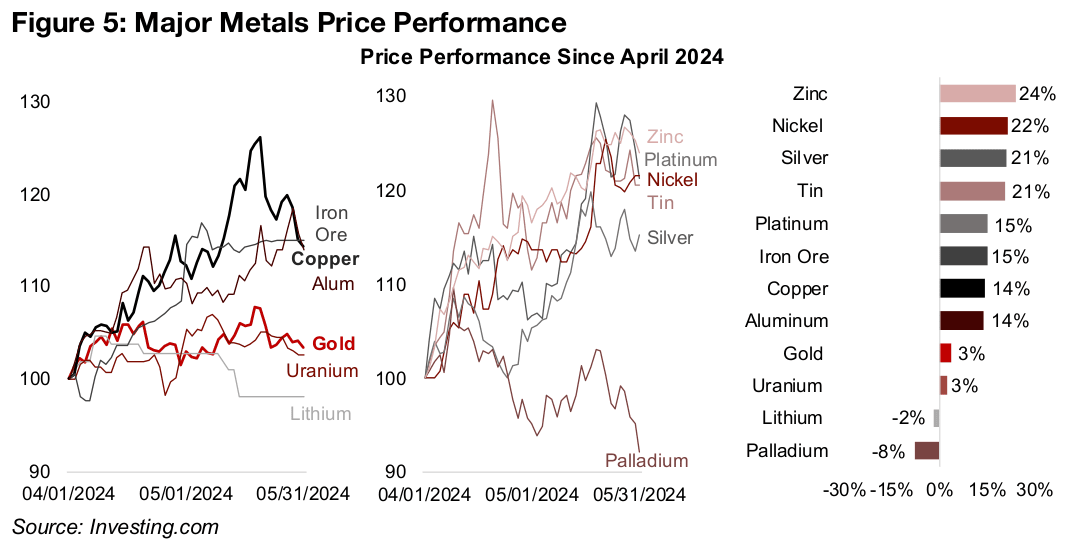
The two laggards of the group have been lithium and palladium, down -2% and -8%, respectively, since the start of April 2024, the only two of the major metals to have declined over the period. For lithium, both weakening demand for electric vehicles and an increase in production capacity have weighed on the price, after having already driven a significant crash from November 2022 to December 2023. Palladium has slumped as concerns over potential supply constraints have eased and growth from its main source of demand, the auto industry, has weakened, even as its precious metals cousin platinum has seen a strong 15.3% gain since April 2024.
Lithium faces demand and supply side pressure
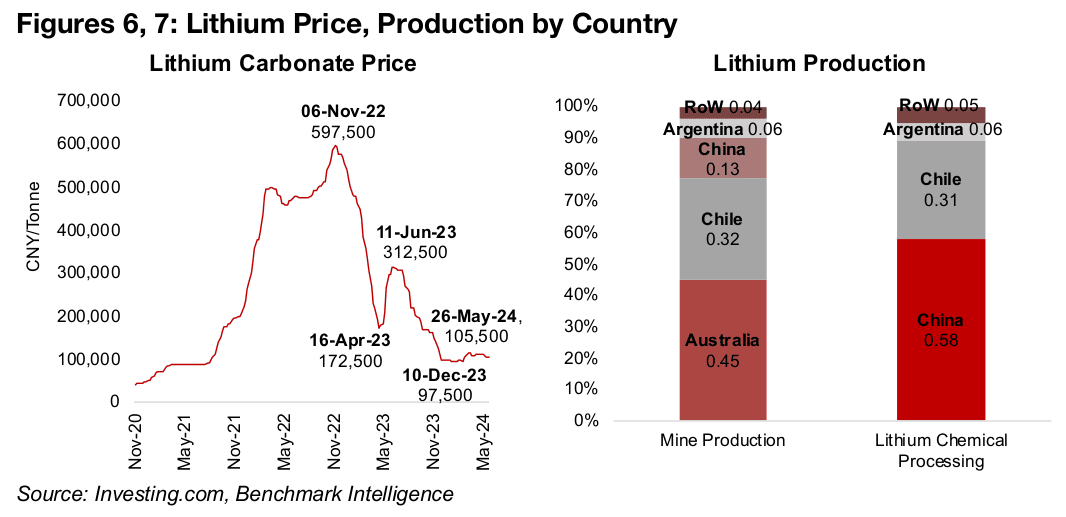
The lithium price continues to face fundamental pressure from both the demand and supply sides and likely a lingering bearish sentiment after an -83.7% collapse from a CNY597,500/tonne peak in November 2022 to a low of CNY97,500/tonne in December 2023, with only an 8.2% pickup to CNY105,500/tonne as of end-May 2024 (Figure 6). The raw mine supply of lithium is mainly from Australia and Chile, at 45.0% and 32.0% of the total, respectively, with China only third, at 13.0% (Figure 7). However, China, dominates production of lithium chemicals at 58.0% of the total, with Chile second largest, supplying only about half of this level, at 31.0%, making shifts in Chinese capacity a major factor in determining the prices.
Lithium capacity in China was completely overwhelmed by the unexpected rise in
demand for the metal on the jump in electric vehicle sales in 2021 and 2022, driving
the surge in price. The global health crisis exacerbated the issue, constraining the
pace of any capacity expansion. However, as the crisis eased, China was able to
expand supply substantially as both workers returned to plants and significant new
supply started to come online by early-2023.
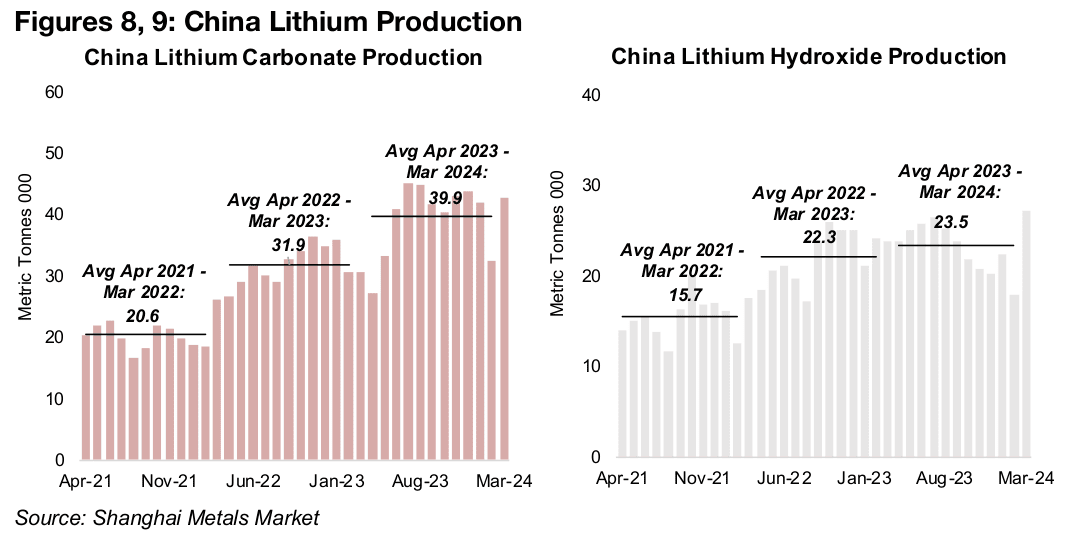
This drove a major increase in average monthly lithium carbonate output in the year
to March 2023 to 31.9k metric tonnes, up 54.9% yoy, and again in the year to March
2024, up 25.1% to 39.9k metric tonnes (Figure 8). While there was a similar strong
rise in lithium hydroxide output by 42.0% to an average 22.3k tonnes in the year to
March 2023, it rose only slightly, by 5.4% to 23.5k tonnes, in the year to March 2024
(Figure 9).
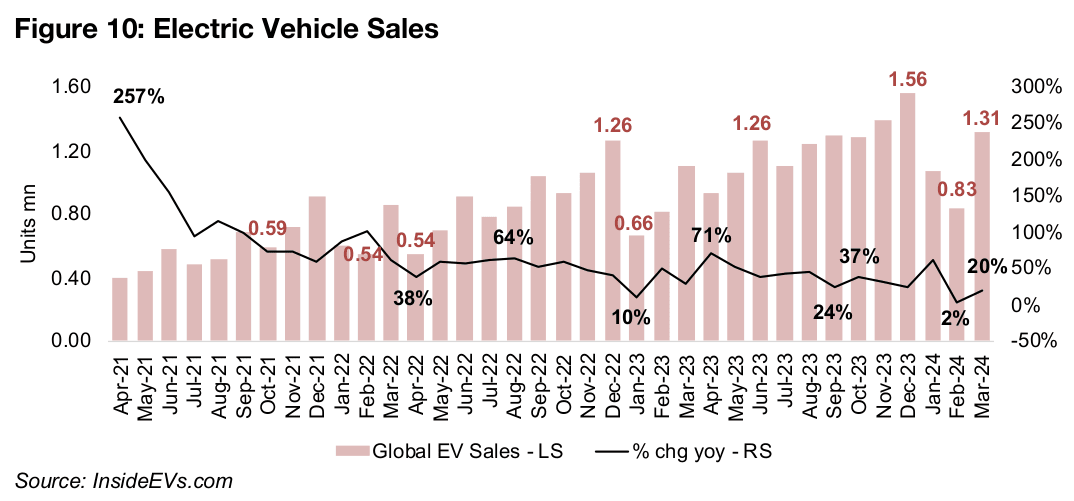
There has also been a slowdown on the demand side for lithium, with the rate of electric vehicle sales continuing to trend down. In the first half of 2021, the yoy growth rate of electric vehicle sales reached over 200% in several months and averaged 164%, significantly boosting lithium demand and the metal’s price (Figure 10). However, the growth rate slowed by half in the H2/21 to an average of just 80.3%, declining further to 56.4% in 2022. Growth dipped again in 2023 to 35.7%, starting the year at lows of 9.9% in January 2023, and for Q1/23 was just 24.9%, with the growth rate dropping to near flat in February 2024, at just 2.3%. This declining growth rate has relieved demand pressure on the lithium chemical industry, especially given the new supply that has come online in China over the past year, and therefore seen the lithium price stagnate at relatively low levels.
Palladium price reverts towards parity with platinum
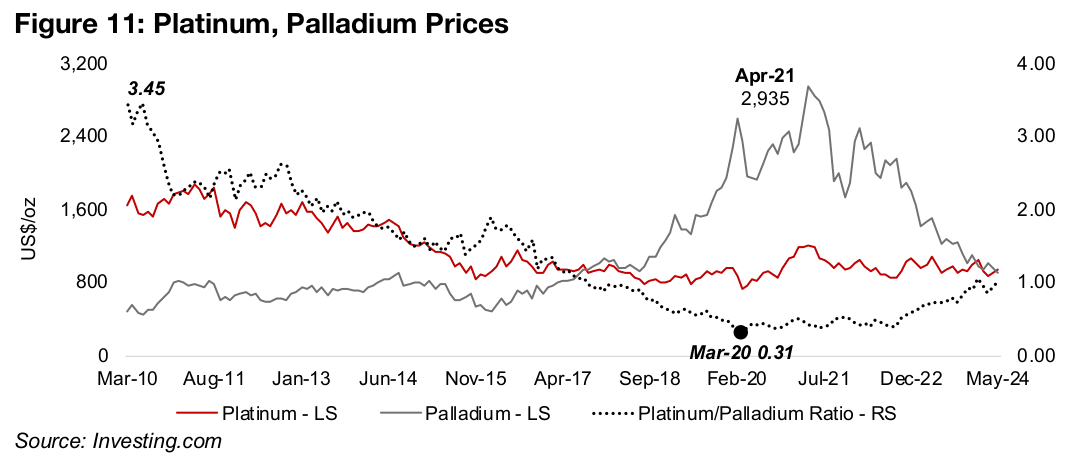
Like lithium, the decline in palladium is also part of an extended major downtrend, although it peaked over a year earlier, at an average US$2,935/oz for the month of April 2021 (Figure 11). The price had surged from 2019 through to mid-2021 as demand had strengthened and there were expectations of tightening supply. This saw the platinum to palladium ratio slump to a decade low of 0.31x in March 2020, having been as high as 3.45x in 2010.
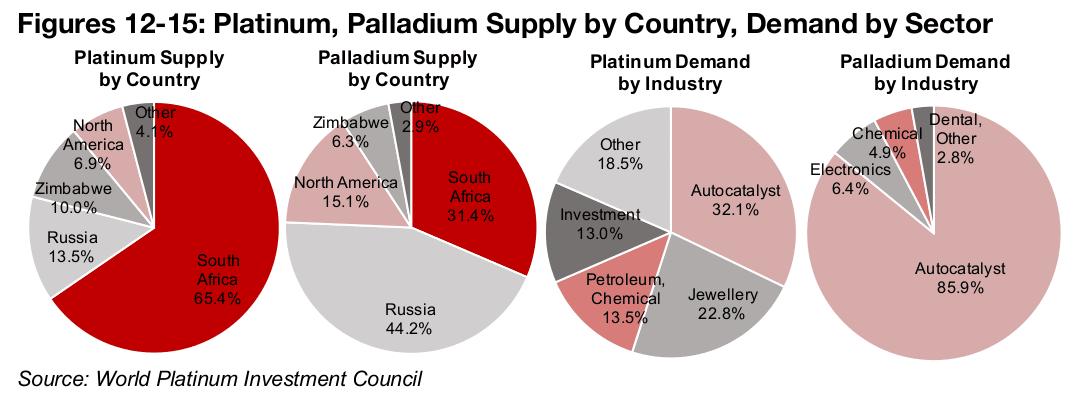
On the supply side, in contrast to platinum, which is mainly sourced from South Africa,
at 65.4% of the total, Russia is the largest palladium supplier, at 44.2% (Figures 12,
13). After the Russia’s invasion of Ukraine there had been major concerns that this
supply could be interrupted, driving up the price. At the same time, there was a
significant rise in demand for palladium from the auto industry, with autocatalysts
comprising the majority of its demand, at 85.9% (Figure 14). This contrasts with
platinum, where demand is more diversified across a few major sectors (Figure 15).
From mid-2021 both of these drivers started to reverse, and eventually caused a
significant decline in the palladium price. First, the major feared disruption of
palladium supply from Russia did not actually occur. Second, the auto industry
started to substitute platinum for palladium in autocatalysts, which hit the metal from
the demand side. There are currently also expectations for a slowdown in the global
auto industry this year, to which palladium is more exposed than platinum. This has
sent the ratio between the two metals to near parity for the first time since late 2017.
Major sources vary on 2024 platinum balance outlook
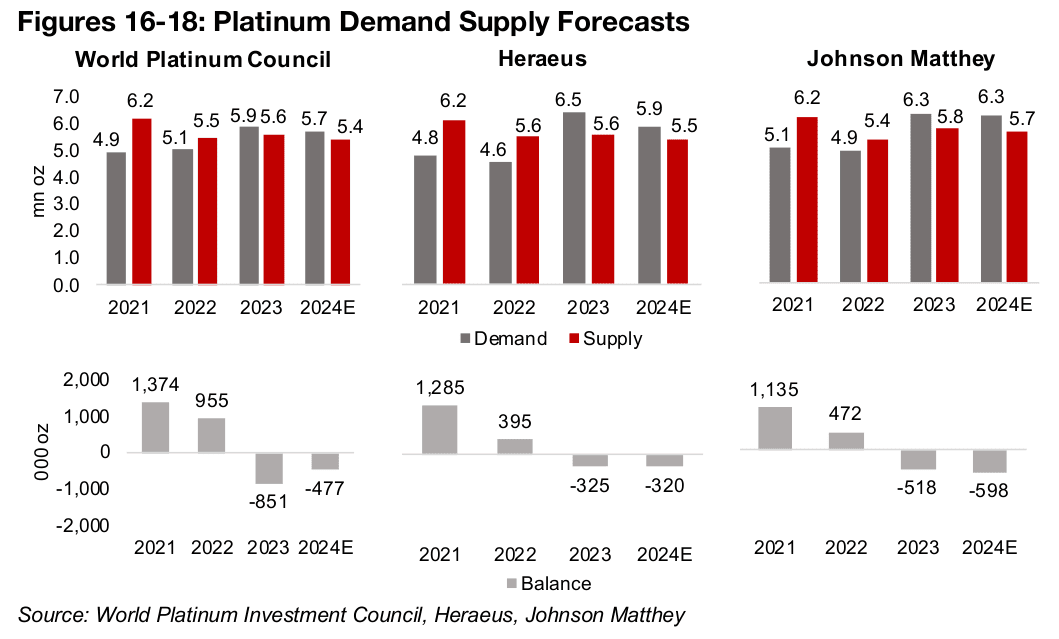
For platinum there are three main sources which provide 2024 forecasts, the World Platinum Investment Council (WPIC), Heraeus and Johnson Matthew (JM). They show the same general trend from 2021 to 2023, which are large surpluses in 2021, a significant contraction in the surplus in 2022 and then a shift into deficit for 2023 (Figures 16, 17, 18). However, while all the sources expect another deficit in 2024E, they vary on the direction of its change, with WPIC expecting it to contract, Heraeus estimating it will be near flat, and JM forecasting a widening. These could correlate with relatively bullish, neutral and bearish views on the platinum price, respectively.
Only a single major source so far for 2024 palladium forecast
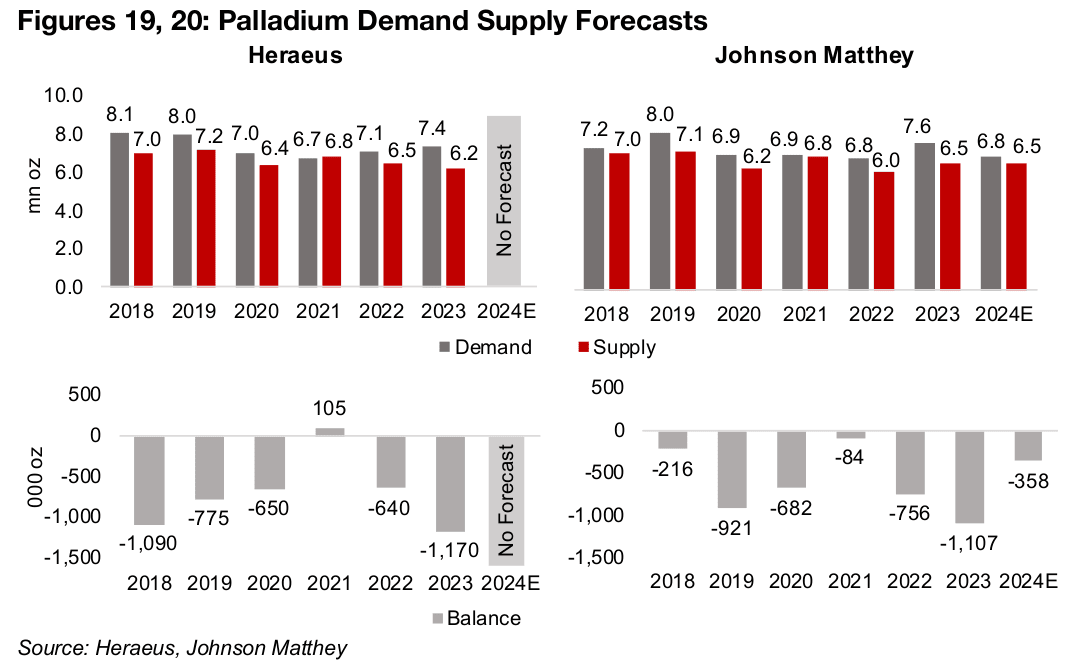
For palladium only Johnson Matthey has released its 2024 forecast so far, although
a Heraeus forecast is expected to be issued soon. Both sources show a similar trend
from 2019 to 2021 with a large deficit contracting to a nearly balanced market, and
then an expanding deficit in 2022 and 2023 (Figures 19, 20). For 2024, Johnson
Matthey expects a significant contraction in the deficit, which would seem to be a
bullish indicator for the palladium price.
Beyond just these industrial drivers, platinum especially, and to a much lesser extent
palladium, are also driven by monetary factors, although nowhere as much as gold,
and both have a currency code for international trading and are considered investable.
Therefore, the factors that tend to drive up gold, including lower real interest rates, a
falling US$ and increase in the global money supply, could also drive up these two
metals to some degree. However, the industrial factors will likely tend to dominate
the price movement, and will especially be the case for palladium.
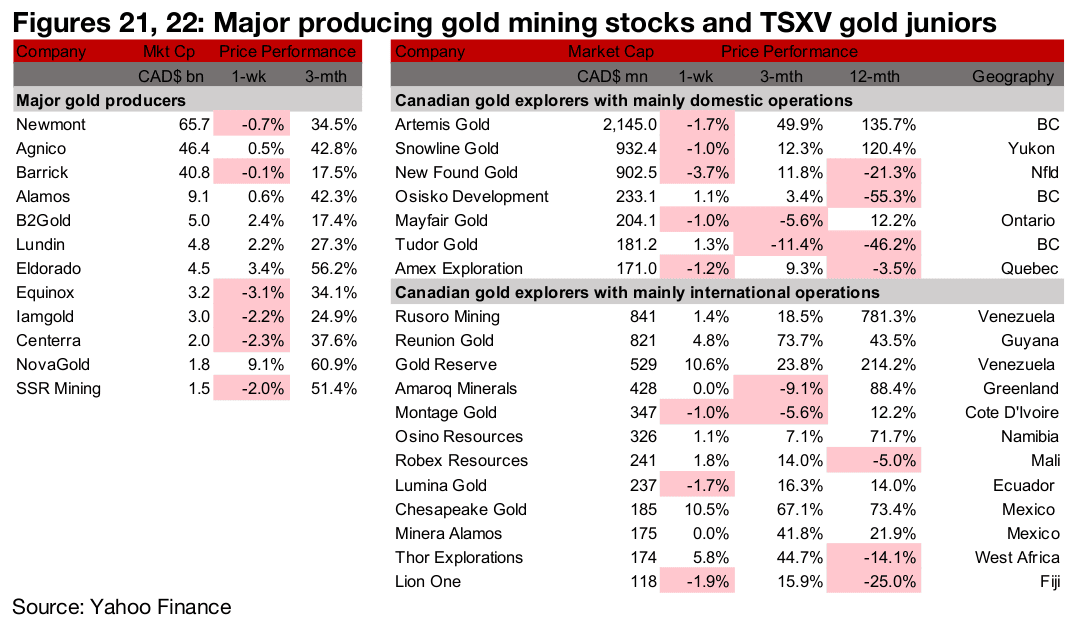
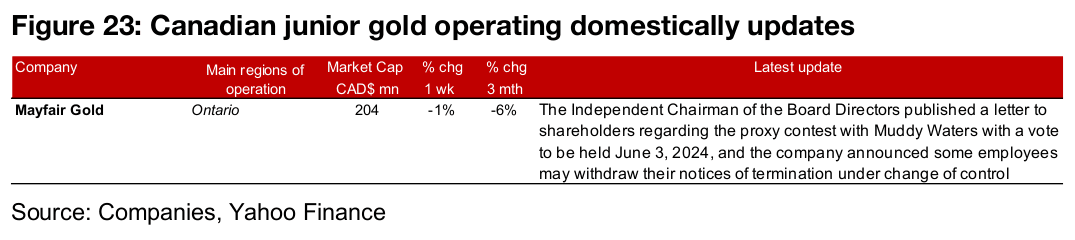
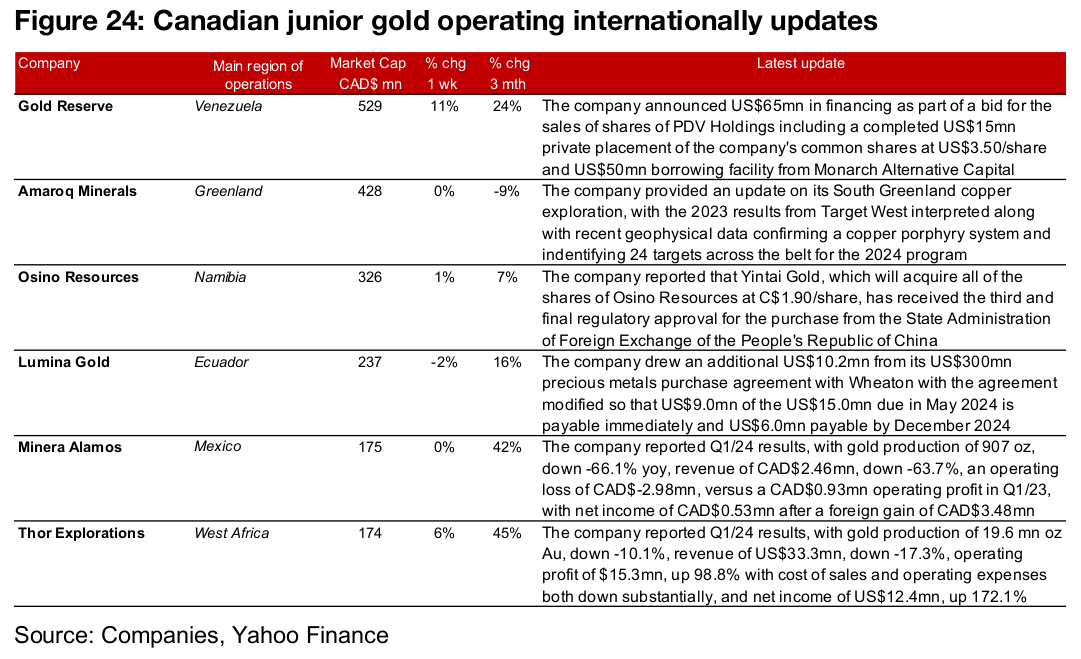
Major gold producers and TSXV gold mixed
The major gold producers and TSXV gold were mixed for the week (Figures 21, 22). For the TSXV gold companies operating domestically, Mayfair Gold’s Chairman published a letter regarding the proxy contest with Muddy Waters and announced some employees may withdraw their notices of termination under change of control (Figure 23). For the TSXV gold companies operating internationally, Gold Reserve announced a US$65mn financing, Amaroq provided an update on its South Greenland copper exploration and Osino’s acquirer Yintai Gold received the third and final approval from the regulator in China. Lumina Gold drew an additional US$10.2mn from its US$300mn precious metals purchase agreement with Wheaton, and Minera Alamos and Thor Explorations reported Q1/24 results (Figure 24).
Disclaimer: This report is for informational use only and should not be used an alternative to the financial and legal advice of a qualified professional in business planning and investment. We do not represent that forecasts in this report will lead to a specific outcome or result, and are not liable in the event of any business action taken in whole or in part as a result of the contents of this report.