March 14, 2020
Junior Gold Miner Weekly
Author - Ben McGregor
Fear Factor: Market crashes and gold prices
Following 'the great crash of 2020' of the past three weeks, in this report we compare gold's recent performance versus the S&P 500 index to the last three material US market crashes, 2008, 2000 and 1987.
Generally, gold proves to be a hedge in crashes
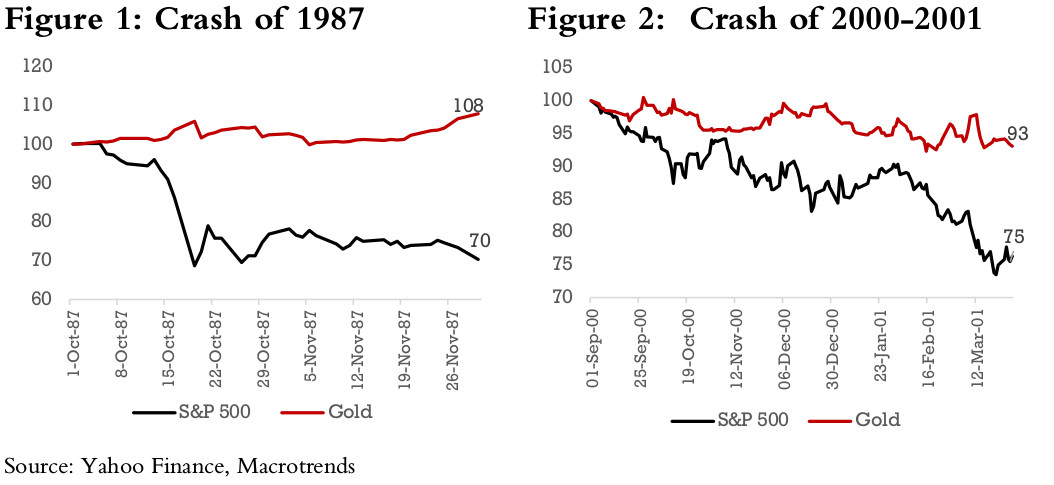
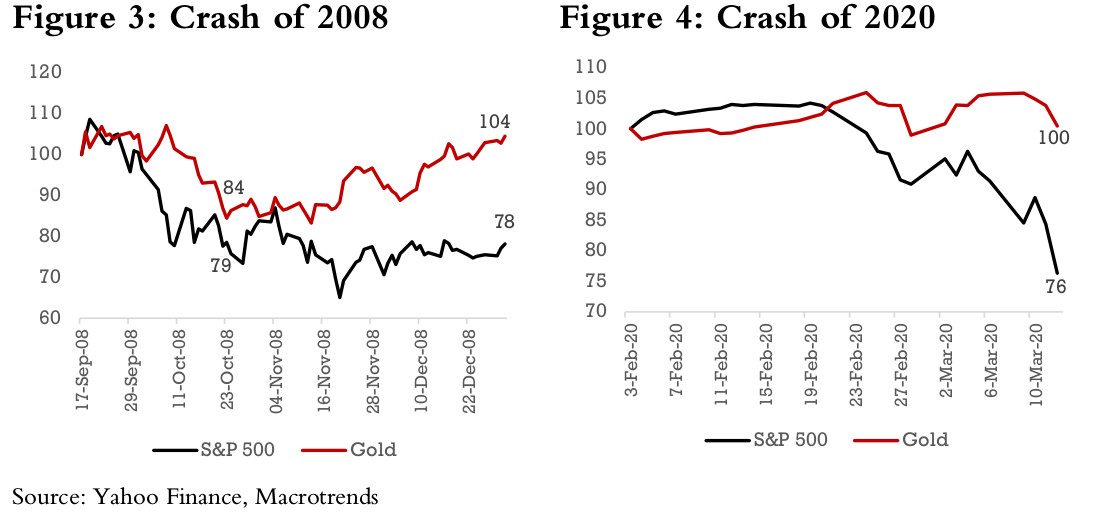
Gold proves to be a decent hedge in 1987 and 2000, and while it takes an initial, margin call driven in dip in 2008, it rebounds quickly in contrast to the S&P. It is too early to make a call about 2020, but gold so far has held up well.
Gold price and gold mining ETFs

Source: Yahoo Finance, *Van Eck
Fear Factor: Market crashes and gold prices
Looking at 2008, 2000 and 1987 as indicators
In our weekly we will usually focus on key updates for multiple junior miners, but this week we focus on the main driving factor for all of them; the gold price, and its pandemic and recessionary fear driven changes in recent weeks. We look at gold price moves in previous crashes, in 2008, 2000, 1987 to provide examples of how gold might perform in a range of market crash scenarios. To put the moves in context, we consider them as landing somewhere between two extremes; 1) a massive rush towards gold for safety, or in reaction to money printing, and 2) a massive dumping of gold, mainly in order to meet margins calls for other assets.

Gold is a good hedge in 1987 and 2000-2001
For our first two crashes, 1987 and 2000-2001, gold clearly acts a strong hedge. In 1987, the S&P 500 lost 30% in six weeks after the crash (Figure 1), but gold was up 8%, and in 2000-2001 the S&P 500 lost 25%, but gold just 7% (Figure 2). These crashes differ from 2009, with the 1987 decline sharp but short-lived and 2000-2001 driven by declines in the extremely overvalued technology sector, and not involving concerns that the entire financial system was on the verge of collapse.

Gold takes a margin call hit in 2008
The 1987 and 2000-2001 moves both seem to lean towards the flight to safety and a hedge against money printing scenarios (with the Fed following up both crashes with large monetary increases). For 2008, in contrast, it first swings to the other side of the story, with margin calls leading to dumping of gold holdings and the collapse in gold from mid-September 2008 to October 23, 2008 by 16%, almost as severe as the S&P 500's 21% fall over the period (Figure 3). However, this was followed by a massive monetary expansion by major global central banks, leading gold to rebound by the end of the year to 4% above the level it entered the crash, even as the S&P 500 remained down 22%. So we see both effects, margin call related selling and the hedge against money printing, but in sequence.
Too early to call the 2020 crash, but so far gold holding up
While gold has been holding up well in the crash of 2020, which is now three weeks along, with gold flat, but the S&P 500 plummeting 24%, it is still too early to call which scenario gold will follow (Figure 4). For comparison, we can see that in 2008, gold held up for about three weeks before a margin call driven decline that lasted over a month, so further market declines could potentially generate such a scenario.
However, the global financial system from the commercial and investment banking side is in better health from a capital base perspective and much more cautious than heading into the 2008 crisis. This time the strains are coming from the real factor of the pandemic fears, and monetary issues this time appear to be more with central banks' heavy balance sheets and malfunctioning bond markets.
Real factors seems to be the driver rather than monetary
Interestingly, central bank announcements of heavy liquidity provision did not provide much relief to markets, which were more focused on the real effects of the pandemic, and markets jumped on Friday only after major fiscal, not monetary, measures were approved in the US. That the market is concerned about real factors, and is not buoyed by monetary ones may be a good thing, however, as the real effects of the pandemic, however heavy, can eventually be fully priced in, and we can reach a floor. This also suggests that once pandemic fears fade, which could be within the next two months, this market panic will also subside, and even though there will remain a quarter or two of weak economic data to slog through in its wake, the damage could be temporary.
What the crash could mean for the juniors
Fears of ability to raise capital overshadow resilient gold price
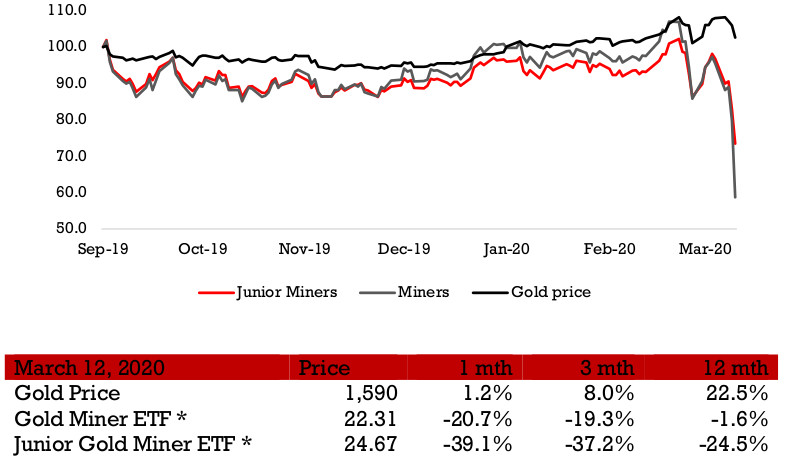
As long as gold was lingering around US$1,200-US$1,300, junior miners were always going to remain undercapitalized and face low investment, where even producing miners were languishing just on the edge of profitability. And while US$1,500/ounce starts to look interesting for producing miners, it may still not be adequate to compensate investors for the more substantial risk of the juniors. However, as we rise above US$1,600, the outlook for juniors is substantially improved, and so far, with at least a big proportion of the collapse already out of the way, gold has only marginally dipped below US$1,600. Even given this, Van Eck's junior miner ETF has collapsed -39% in the month to March 12, 2020, as fears about the ability of juniors to raise capital in a recessionary environment and continue operations overshadowed gold's resilience. However, as long as gold continues to hold up, we could see this heavy bearishness on the sector subside.
Disclaimer: This report is for informational use only and should not be used an alternative to the financial and legal advice of a qualified professional in business planning and investment. We do not represent that forecasts in this report will lead to a specific outcome or result, and are not liable in the event of any business action taken in whole or in part as a result of the contents of this report.

