May 23, 2022
Gold Up After Five-Week Drop
Author - Ben McGregor
Gold picks up after five-week decline
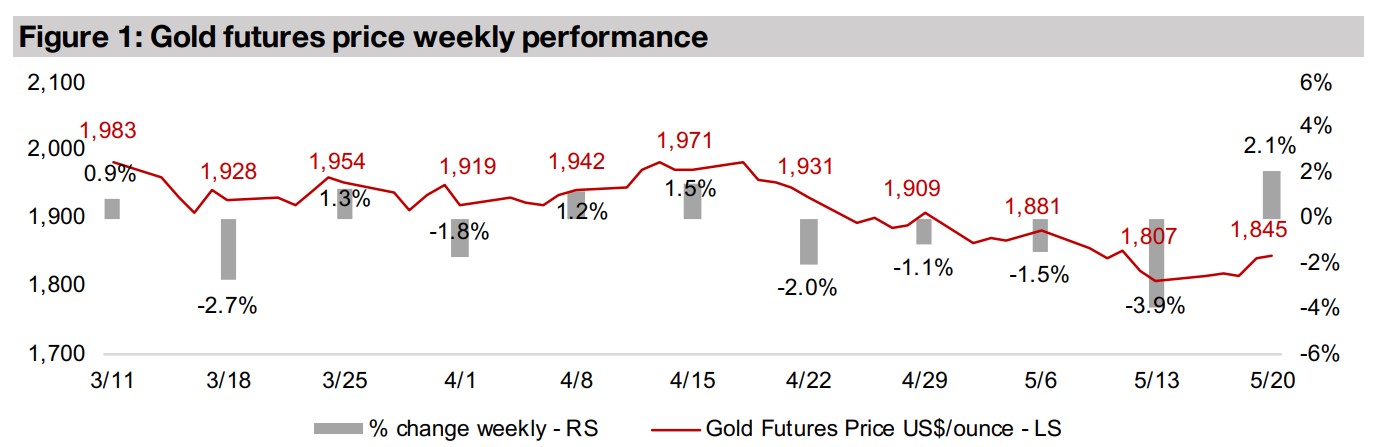
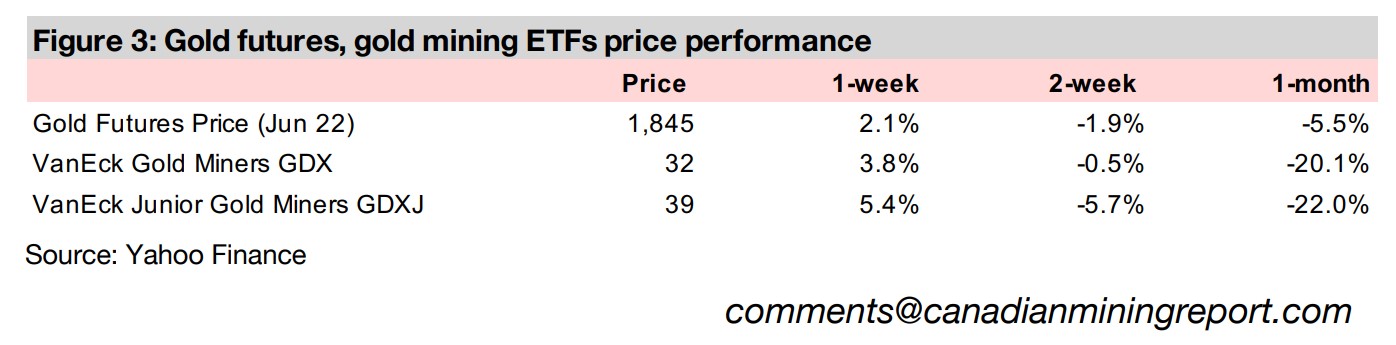
Gold rose 2.1% to US$1,845/oz this week, after a five-week decline, as both the US dollar and US bond yields eased, while the strong decline in equity markets continued, which may have seen investors seeking safety in gold.
Gold in the context of 1970s-1980s inflation and 2008-2009 crash
This week we review the broader macro situation for gold, considering currently high inflation in the context of a similar spike in 1970s and early 1980s and looking at the recent moves in gold and equity markets in the context of the 2008-2009 crisis.
Global producers and juniors rebound, Canadian juniors mixed
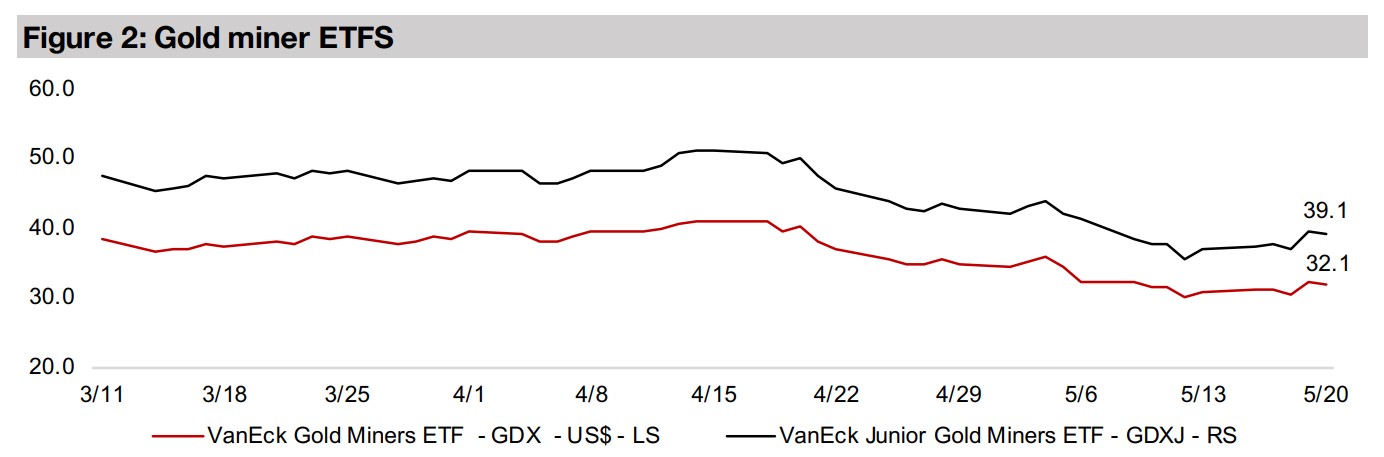
The global gold producers and juniors rebounded as gold rose, with the GDX up 3.8% and the GDXJ up 5.4% but the Canadian juniors were mixed as the rise in the metal's price was offset by a continued decline in the equity markets.


Gold Up After Five Week Drop
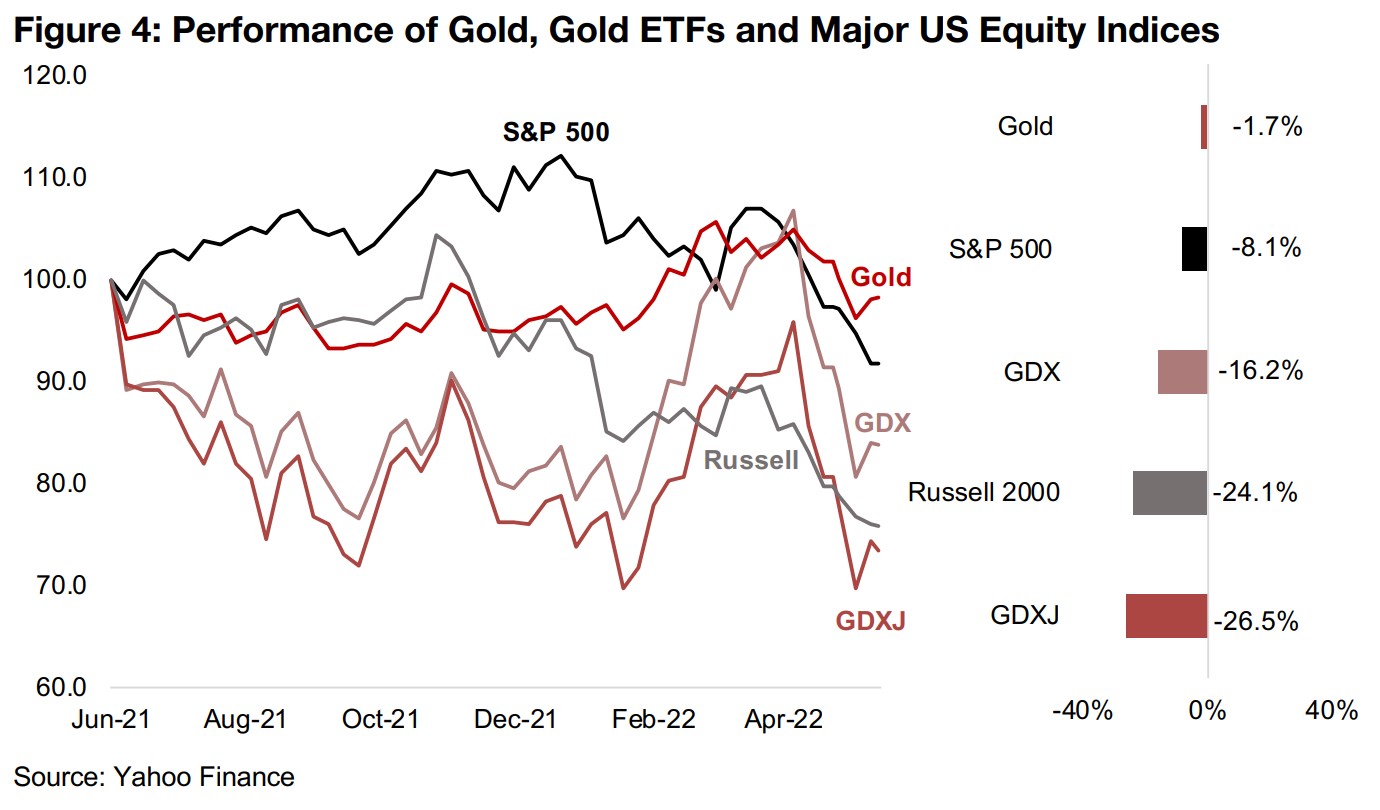
Gold rose 2.1% this week to US$1,845/oz, as both the US dollar and US bond yields declined, and the equity markets saw another major decline, with the S&P just on the cusp of bear market territory, as defined by a 20% drop from its peak, which may have driven some investors toward gold as a safe haven asset. While the decline in gold from a recent peak of US$1,971/oz to just $1,807/oz last week is concerning at first glance, in a longer-term context, the metal is still holding up well, down just 1.7% since June 2021, compared to an -8.1% decline for the S&P 500 (Figure 4). Mainly what seems to have been lost in in recent weeks was the geopolitical premium baked into gold since Russia's invasion of Ukraine in March 2022, offset by Fed rates hikes.
Fundamental pressure on gold from rate hikes ...
These Fed rate hikes have already begun in earnest, with a 25 bps hike in March 2022
and 50 bps hike in May 2022, and are expected to continue, and could affect gold
mainly in two ways. First, with the US increasing interest rates higher and faster than
other countries, it would be expected to cause funds to flow into the US, other things
equal, driving up the US dollar's value, therefore driving down gold's price in US dollar
terms. Second, the rate hikes will increase nominal US bond yields, which should
theoretically make bonds more attractive than yield-less gold, warranting some
degree of shift into bonds and out of gold.
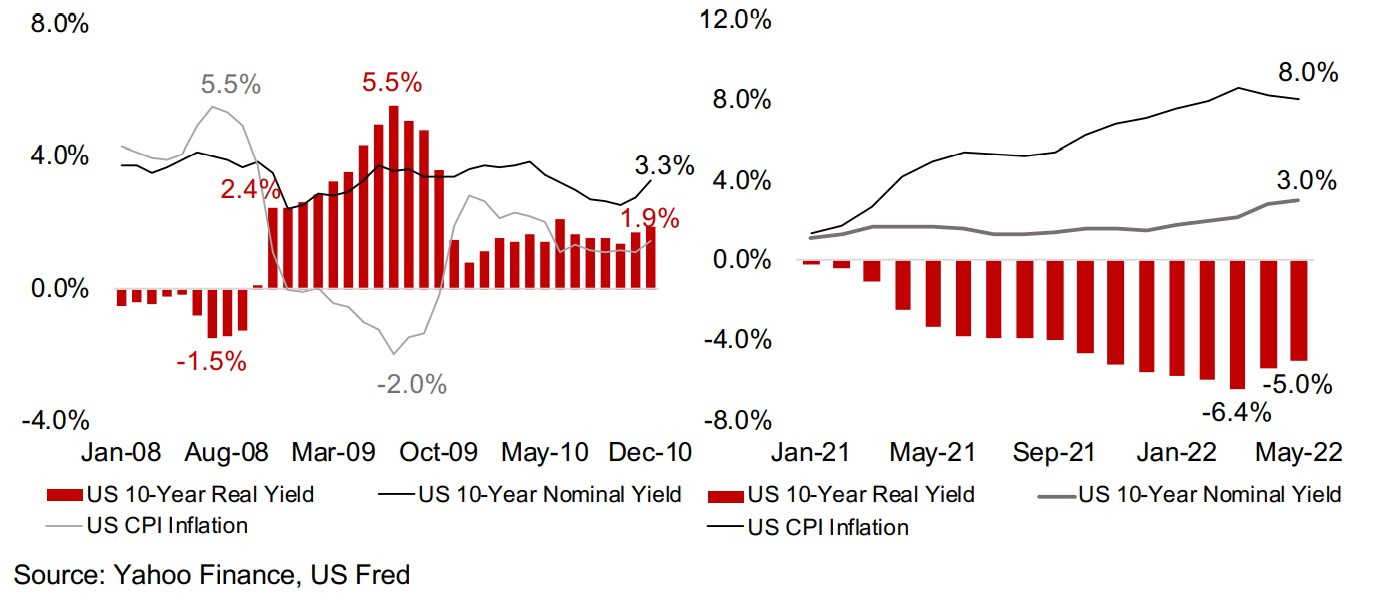
However, currently there is the rare situation where real bond yields have become
very negative, declining from zero percent at the start of 2021 to below -5.0% in,
meaning investors make a major loss holding bonds to maturity, making holding gold,
with its 1.0%-2.0% storage cost per year, much more attractive. Still, the recent
interest rate hikes and a tick down in inflation over the past month has made the real
yield on bonds moderately less negative and making them more attractive as an
investment. Assuming the Fed continues to hike rates and inflation stays flat or eases,
we could see the real rate continue to become less negative, warranting at least some
degree of a shift towards bonds relative to gold. This is the kind of calculation that
likely has been a major driver of the gold's price decline over the past weeks.
...but how far can the Fed really go?
While the market is currently quite nervous about the rate hikes, and rightly so, as the Fed's actions have matched its words so far this year. However, we question how far the Fed can really go in this rate hike cycle, and suspect that the market is questioning this too, and incorporating an eventual retreat by the Fed into the gold price. Given gold's decline over the past five weeks, the market does appear to have baked in continued short-term aggression by the Fed on rate hikes, indicating that it views this as offsetting the geopolitical risk premium seen since March 2022. However, given gold's rebound this week, it also seems to understand that inflation does continue to rage, and could certainly not be considered to have been brought under control yet.
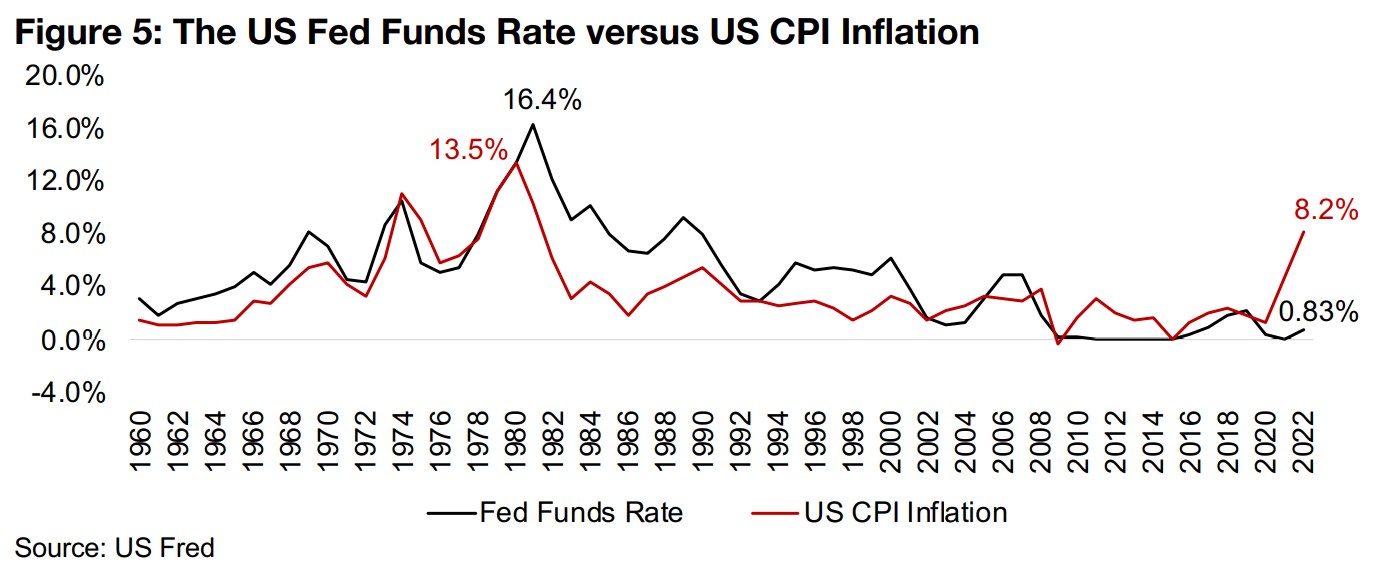
Very aggressive hikes required to slash inflation the last time it spiked
To tackle the last great wave of inflation from the mid-1970s to the early 1980s, that peaked in 13.5% in 1980 took a massive hike in the Fed Funds rate to 16.4% in 1981 (Figure 5). If a similarly aggressive hike would be required curb inflation currently, that would suggest a hike towards 10.0%, or up 500% increase. Given that just the just a 75 bps hike in 2022 has been enough to perpetuate a bear market and seems on the verge of driving an economic slowdown, if not an outright recession, truly curbing inflation seems likely to have dire consequences for the stock market and economy.
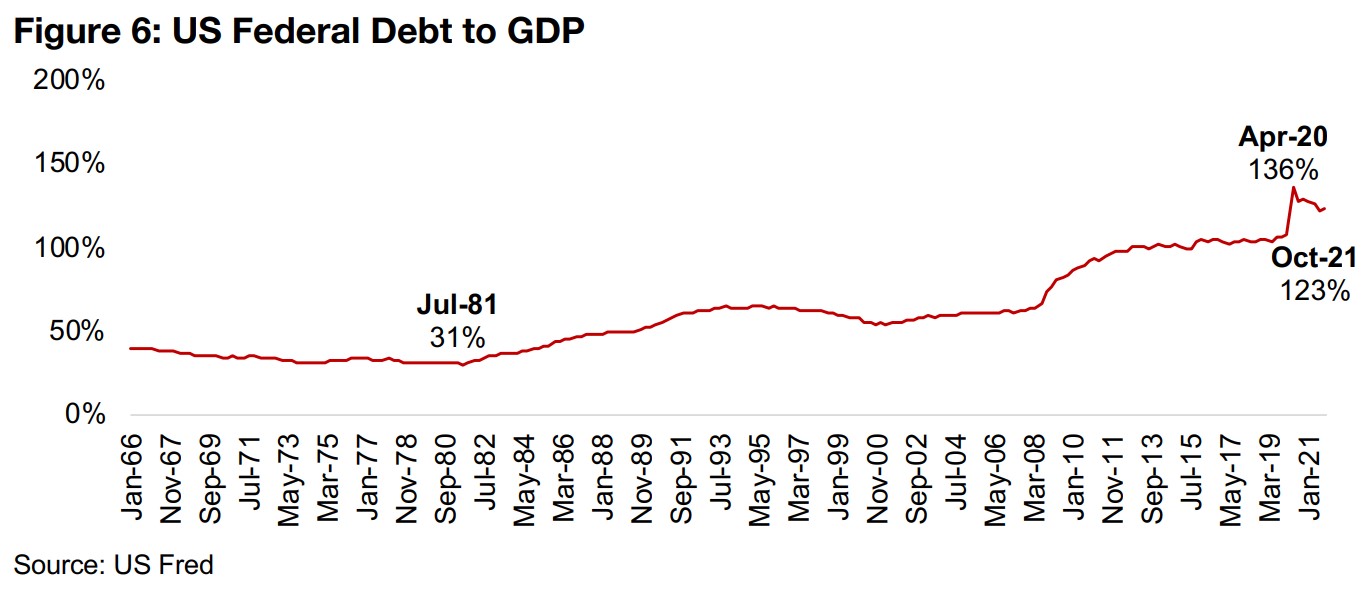
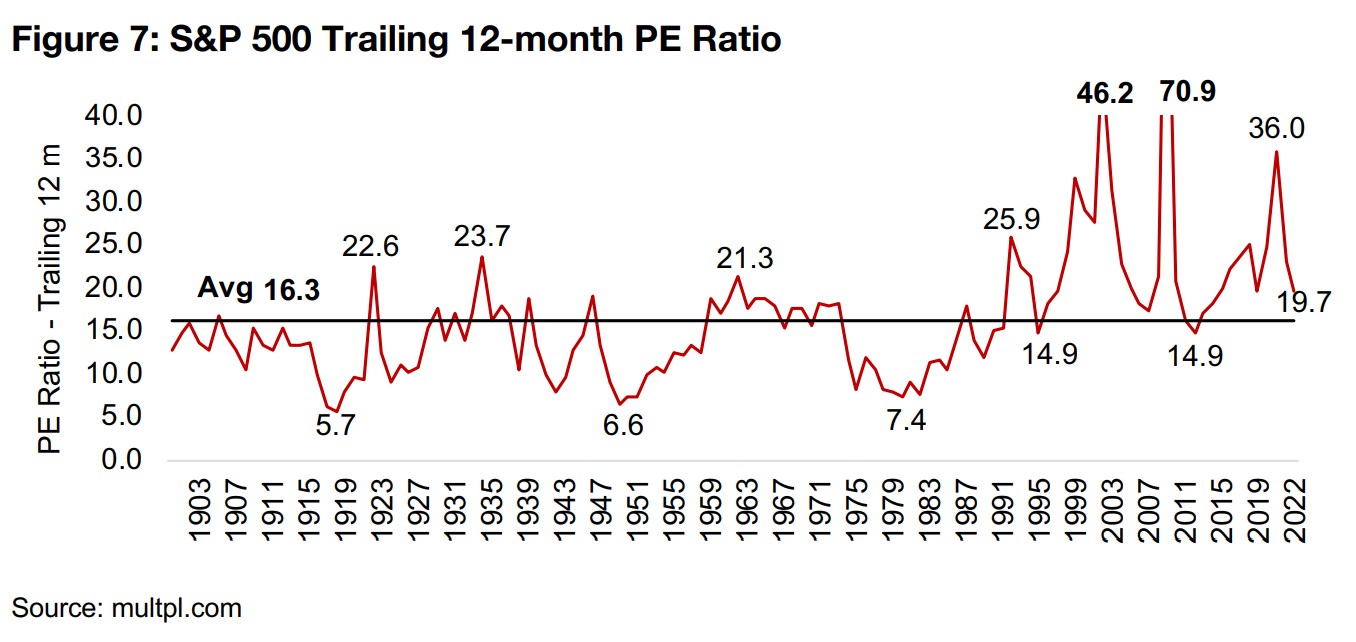
Fed had more room to maneuver in the 1970s than it does in 2022
We also need to consider that the US had much more head room in terms of debt expansion heading into the 1980s, and the situation is much tighter now, with US Federal Debt to GDP at 123% as of October 2021 compared to just 31% in July 1981 (Figure 6). With such a huge debt load, the Fed's target to increase the base rate to around 3.0% by 2023 would make the US debt service the largest single item in the US Federal budget. Another issue is that heading into the 1980s, equity prices had been depressed because of the decline in the 1970s, and certainly no housing bubble had yet developed. In contrast, equity valuations still remain elevated even after the recent correction in markets, with the S&P 500 trading at a trailing 12-month PE of 19.7x, compared to a multiple of just 7.4x heading into the 1980s (Figure 7). These issues are likely to constrict the Fed considerably in how much they can hike before causing substantial market and economic disruption.
High inflation changes everything
Overall the markets seem recently seem to be coming to the terms with the fact that high inflation changes everything, and that the easy money of almost the entire last thirty years had been driven by an absence of any major increase in prices. We have to go back forty years to understand what happens when the Fed is actively fighting inflation, and as shown above, it is not particularly pretty. So while the market does fundamentally need to price into the gold price surging yields and flattening inflation over the past month to the downside, it also needs to price in the limits on how far the Fed can really go in its rate hikes, and the potential for inflation to continue to rage, supporting the gold price to the upside.

Considering current real yields and gold in the context of 2008-2009
With the US stock market already in a considerable decline, we also want to consider
what might happen to the gold price if the equity decline continues. The most recent
comparable period the 2008-2009 financial crisis, with a considerable drop in the S&P
500 index and the gold price. While some of gold's decline in 2008 would have been
because of forced selling to cover equity losses there is also a fundamental basis for
its price movement in 2008. The gold price was high heading into the crisis as 10-
year real bond yields were negative, reaching as low as 1.5% in July 2008, which has
some parallels to the current situation (Figure 8).
Real yields popped in November 2008 to 2.4%, as the crisis took hold, sending the
gold price down, as would be expected, likely exacerbated by forced selling.
Interestingly, even as real yields continued rise, which we would expect to drive gold
down further, the metal actually picked up moderately. This is possibly because
investors were both looking to move into a safe haven asset and expecting eventual
inflation from the government's massive bailout program, although there is actually a
period of deflation that develops first, with prices down by -2.0% at their lows in July
2009, with real yields peaking in July 2009 at 5.5%.
An absence of inflation a key factor driving the 2013-2018 gold bear market
Real yields then dropped abruptly from October 2009 to December 2009 driving the start of a major surge in the gold price, coupled with the huge bailout and stimulus driving up inflation expectations. Of course, any expected high inflation did not arise, incredibly, given the degree of money printing, pointing to the underlying deflationary pressures in the global economy at the time. Eventually, beyond the scope of these charts, a rebound in growth with very limited inflation collapses the gold price into the bear market from 2013 to 2018. We highlight that the huge difference in the financial crash of 2008-2009 versus the current period is that inflation remained subdued throughout. We expect that the current high levels of inflation will lead to a very different outcome for the gold price this time around, and that the likelihood of another gold bear market is much less likely because of these persistent high prices.
Junior miners see less pressure than Russell 2000 overall in 2022
We have warned investors since the start of 2022 while we expected that gold would
hold up, that there could be considerable pressure on the equity markets in general,
and the junior miners especially (see our product ‘A Time for Caution: The Top 50
TSXV Metals Miner’ for more detail). This thesis has generally played out, with gold
up 0.9% since the start of 2022, and down -1.7% over the past twelve months (Figure
4). While the gold stocks have not had a great performance over the past twelve
months, they have held up better than we expected since the start of 2022. The ETF
of mining producers, GDX, while down -16.2% over the past twelve months, is exactly
flat since the start of 2021, and the ETF of junior miners, the GDX, down -26.5% over
twelve months, is down just -6.8% in 2022.
So while the GDXJ was down more than the Russell 2000, the benchmark for US
small cap stocks, which fell -24.1% over the past twelve months, since 2022, it has
outperformed, with the Russell 2000 down -21.0% since January 2022. This suggests
that there is some relative support for the sector this year compared to other small
caps. This could be because at anywhere above a US$1,700/oz gold price, the
margins for most producers are still very high, even incorporating recent price
inflation, keep them cashed up and looking for junior miner acquisitions. Also,
valuations for juniors generally remain quite moderate, in distinct contrast to the small
cap sector overall, which saw some extremely excessive valuations developing in
2021, and while they have come down in the recent decline, are still relatively high.
Junior gold mining sector did not participate in excesses of 2013-2020
In contrast to many other sectors, the period from 2013-2020 for the junior gold miners was not one of surging risk tolerance and abundant investment going into increasingly risky projects. It was instead a time of extreme consolidation, with many companies disappearing and only very strong projects surviving, with the industry overall cut down to a lean level. While there has been a resurgence in investment since the second half of 2019, it has still been far from excessive, with caution continuing to rule with the memory of a difficult 2013-2018 still fresh. This all provides some justification for junior gold’s relative outperformance so far in 2022.
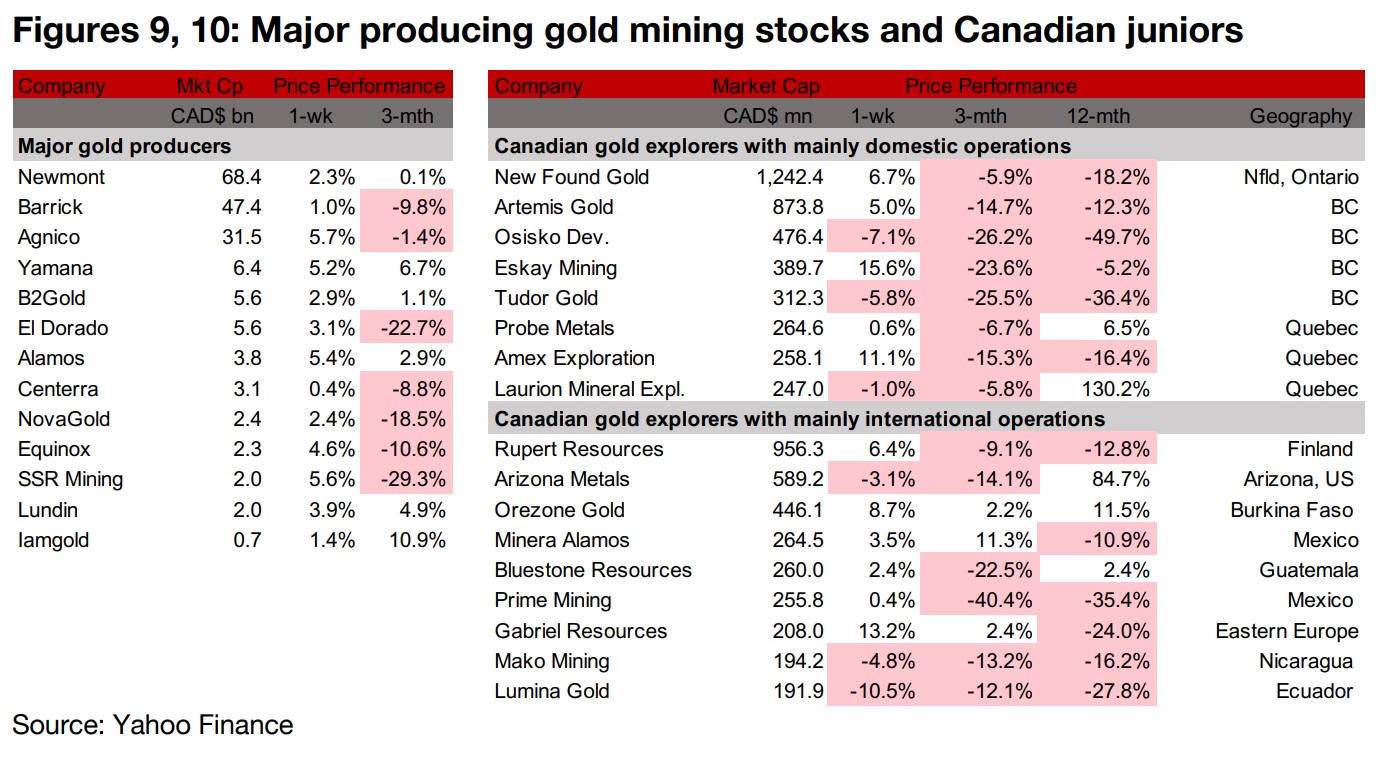
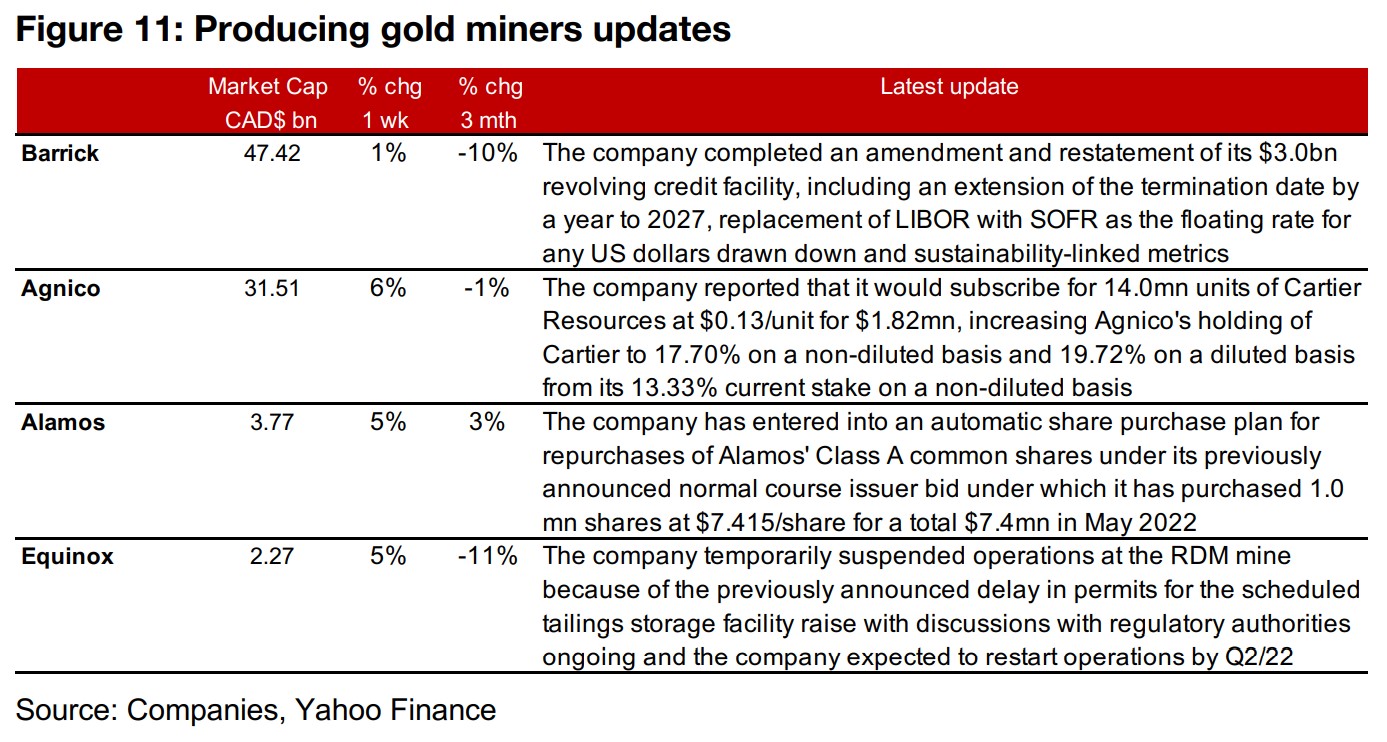
Producing miners all rise as gold pulls out of slide
The producing gold miners were all up as the gold price pulled out of a five-week slide (Figure 9). Barrick completed an amendment and restatement of its $3.0bn credit facility and Agnico reported that it would subscribe to a placement by Cartier Resources increasing its stake in the company to 19.72% on a diluted basis, up from 13.33% on a non-diluted basis currently (Figure 11). Alamos reported that it had purchased $7.4mn of its own shares in May 2022 under its normal course issuer bid and Equinox announced that it had temporarily suspended operations at the RDM mine because of a previously announced delay in permits for the scheduled tailings storage facility raise.
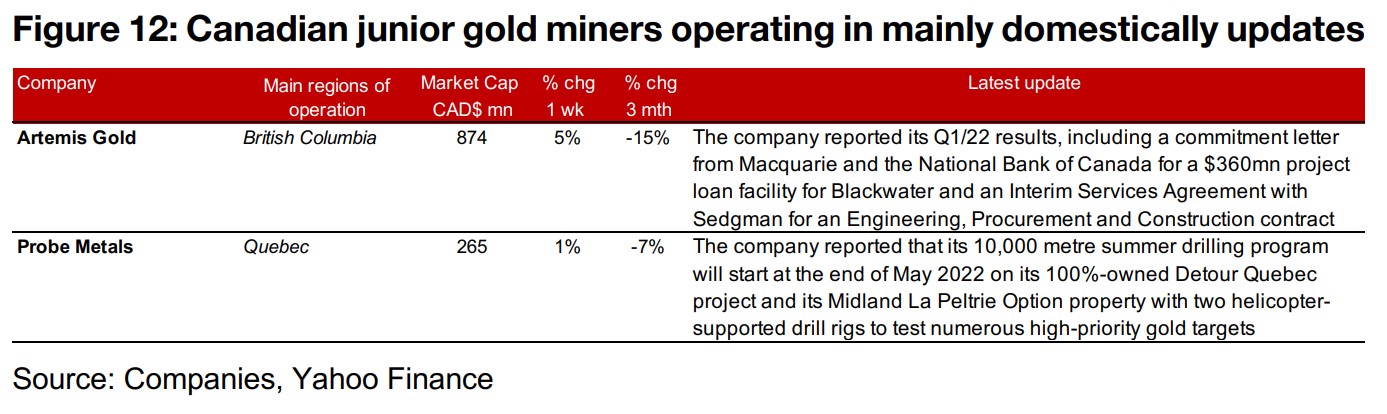
Canadian juniors mixed on rise in gold, decline in equity markets
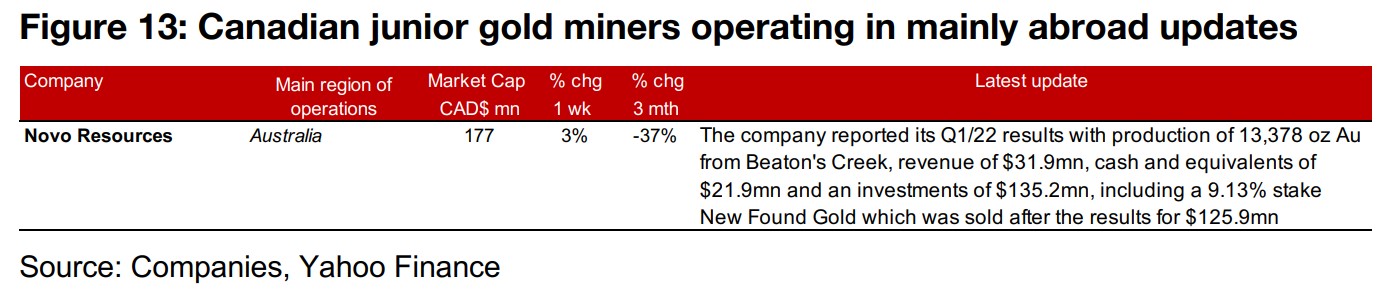
The Canadian juniors were mixed as gold rebounded but the equity markets continued to decline (Figure 10). For the Canadian juniors operating mainly domestically, Artemis Gold reported its Q1/22 results, including a commitment letter for a $360mn project loan for Blackwater and an Interim Service Agreement for an Engineering, Procurement and Construction contract and Probe Metals reported that its 10,000 metre program at Detour would start at the end of May 2022 (Figure 12). For the Canadian juniors operating mainly internationally, Novo Resources reported its Q1/22 results (Figure 13).
Disclaimer: This report is for informational use only and should not be used an alternative to the financial and legal advice of a qualified professional in business planning and investment. We do not represent that forecasts in this report will lead to a specific outcome or result, and are not liable in the event of any business action taken in whole or in part as a result of the contents of this report.