April 21, 2025
Gold Train Keeps On Rolling
Author - Ben McGregor
Gold up on concerns over escalating tariffs
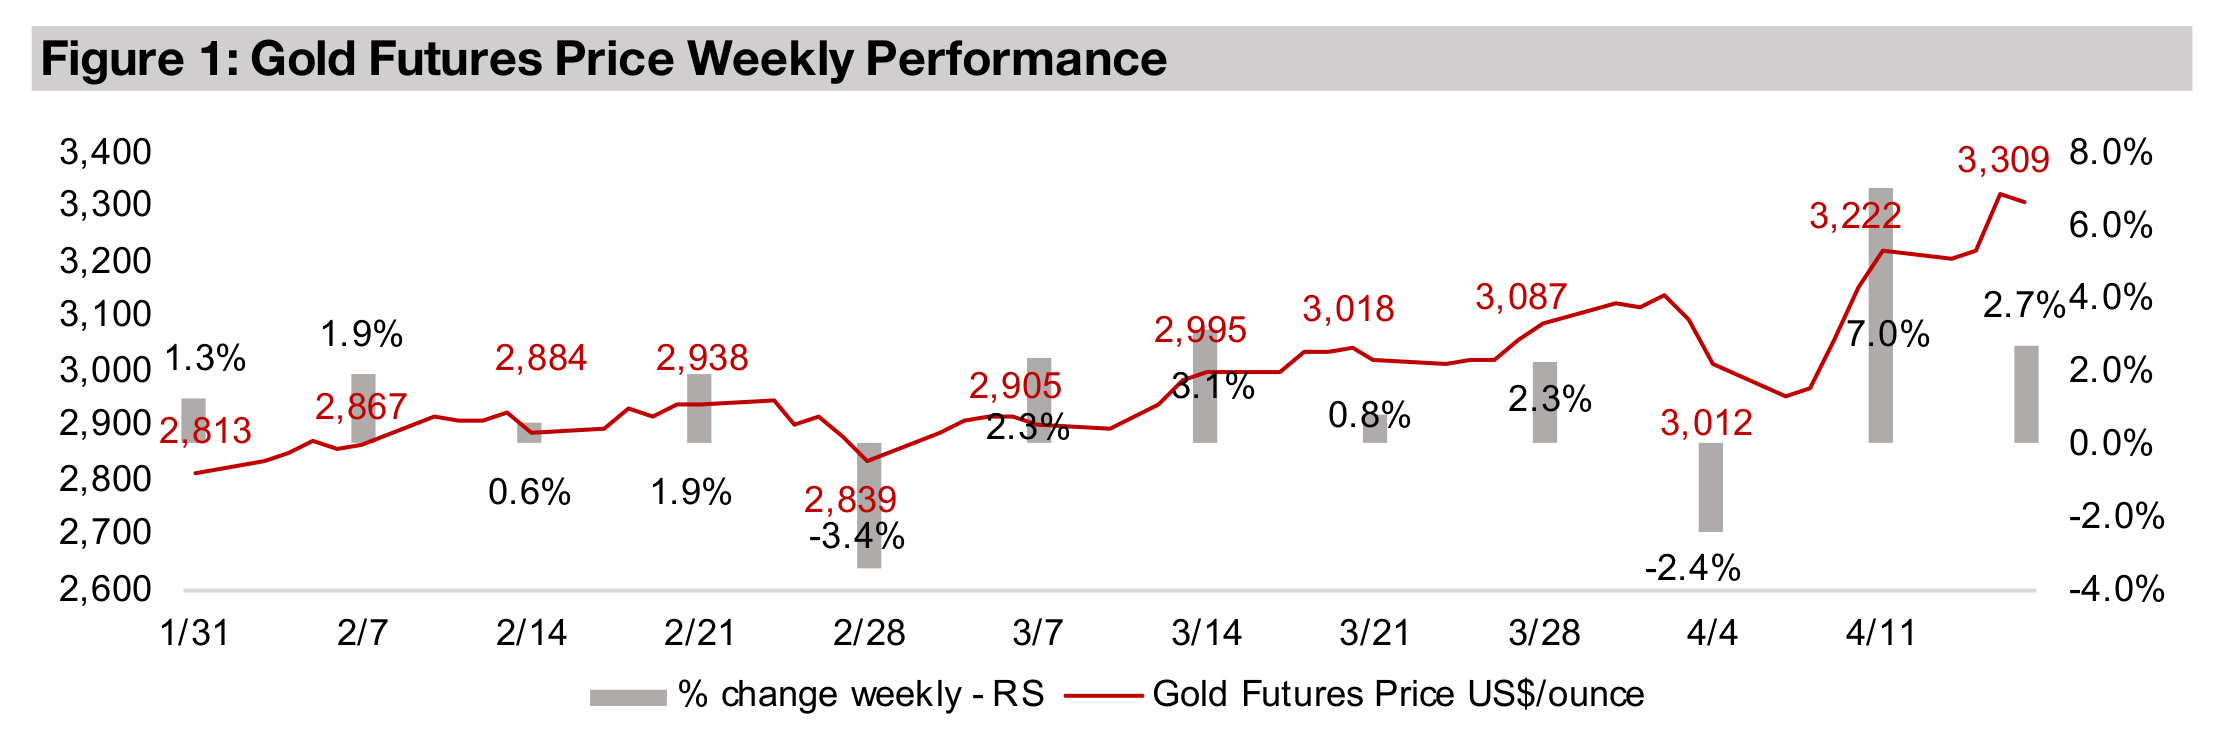
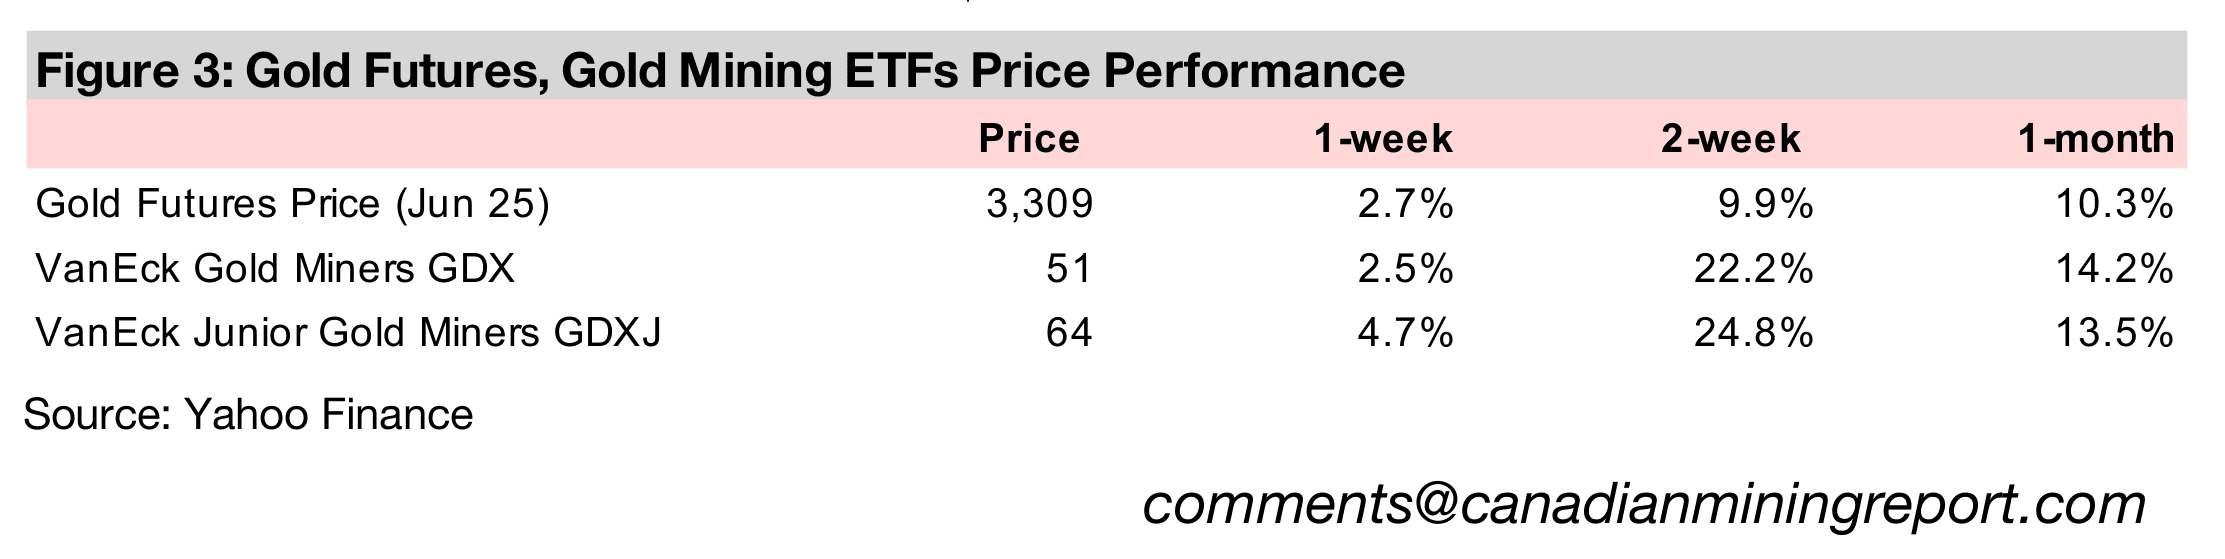
Gold rose 2.7% to US$3,309/oz, up US$300/oz in just two weeks and continuing an increasingly parabolic move, as an economic backdrop of tariff disputes and high rates, inflation and geopolitical risk has seen the market flock to the safe haven.
Gold stocks up, juniors outperform on small cap strength
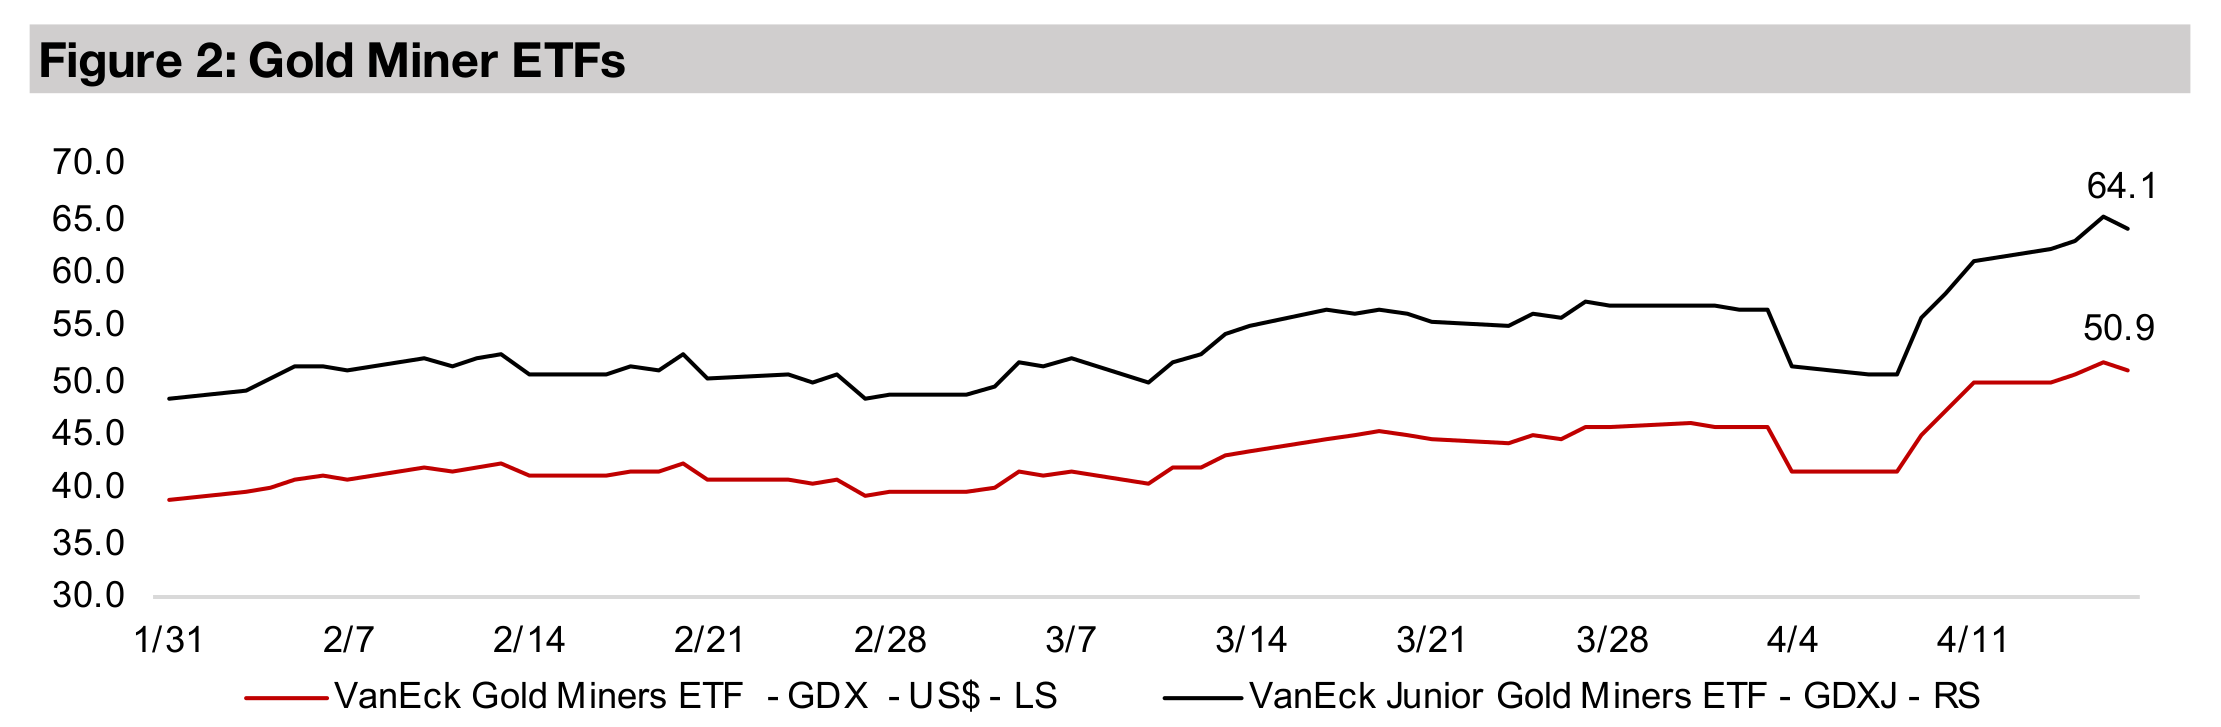
The gold stocks rose with the GDX adding 2.5% even with sluggish large cap equities, as the S&P 500 edged up 0.5% and Nasdaq slid -0.4%, and juniors outperformed with the GDXJ up 4.7% on strong small caps with the Russell 2000 adding 2.7%.


Gold Train Keeps on Rolling
Gold gained 2.7% to US$3,309/oz as the markets were relatively calm this week for the first time in a month. The S&P edged up 0.5% and Nasdaq fell -0.4% in far more subdued moves than the previous two weeks, and even a 2.9% rise in the small cap Russell 2000 Index looked moderate in the context of the earlier volatility. The gold stocks rose on the gain in the metal, with the GDX adding 2.5%, outperformed by the 4.7% jump in the GDXJ, which was supported by the jump in smaller companies. While markets were not shaken much by economic data this week, they remain concerned over the tariff hikes and high rates, inflation and geopolitical risk.
Early signs a gold bubble may be developing
The last time we checked gold’s ratios versus key comparable assets, which provides
an overall picture of the relative valuation of the metal, in February 2025, there were
signs it was potentially getting a bit ahead of itself. Looking at these same ratios now,
just two months later, they seem to be indicating that gold may have moved into the
early stages of a bubble. Gold’s ratios to silver, copper, platinum, oil and commodities
are now all far above their medium-term averages and the ratio of the S&P 500 to
gold has slumped back down near the long-term average.
These ratios seem to be reflecting an increasingly consensus bullish gold trade that
has really taken off only in the past few months and is evidenced by a rise in the press
coverage of the metal. We view this sudden shift in the stance of markets, especially
retail, after a distinct lack of interest in the metal for several years, as a risk that could
drive the price ahead of its fundamentals, and eventually precipitate a significant
pullback. However, we do acknowledge the upswing still seems to be in its early
stages, has widening support, and could continue well into 2025.
After an initial burst in late 2019 and into 2020 as the gold bull market started, there
had not been that much interest from the wider markets in the metal for four years
through to early 2024. Gold consistently reverted to an average around US$1,800/oz,
and only had a major breakout from this range in the second half of last year. However,
it was not the only sector that saw relatively limited attention and low valuations from
2020 through 2023, as the market seemed mono-focussed on the tech sector. Only
late in H2/24 did it become clear that the tech bubble was finally popping.
This has driven the market to more actively shift into a wider range of sectors and
especially safer alternatives, given the jump in economic and political risk over the
past year. This has included the highly defensive utilities, consumer staples and gold
sectors, which all had already started to outperform tech by late 2024, and this trend
went into overdrive in the recent crash. Even as late as October 2024, there was still
a large proportion of the market that was tech bullish, and this flip to risk aversion
has really been quite recent, especially the sudden strong gold support.
Investment banks ahead of the gold price, institutions still behind
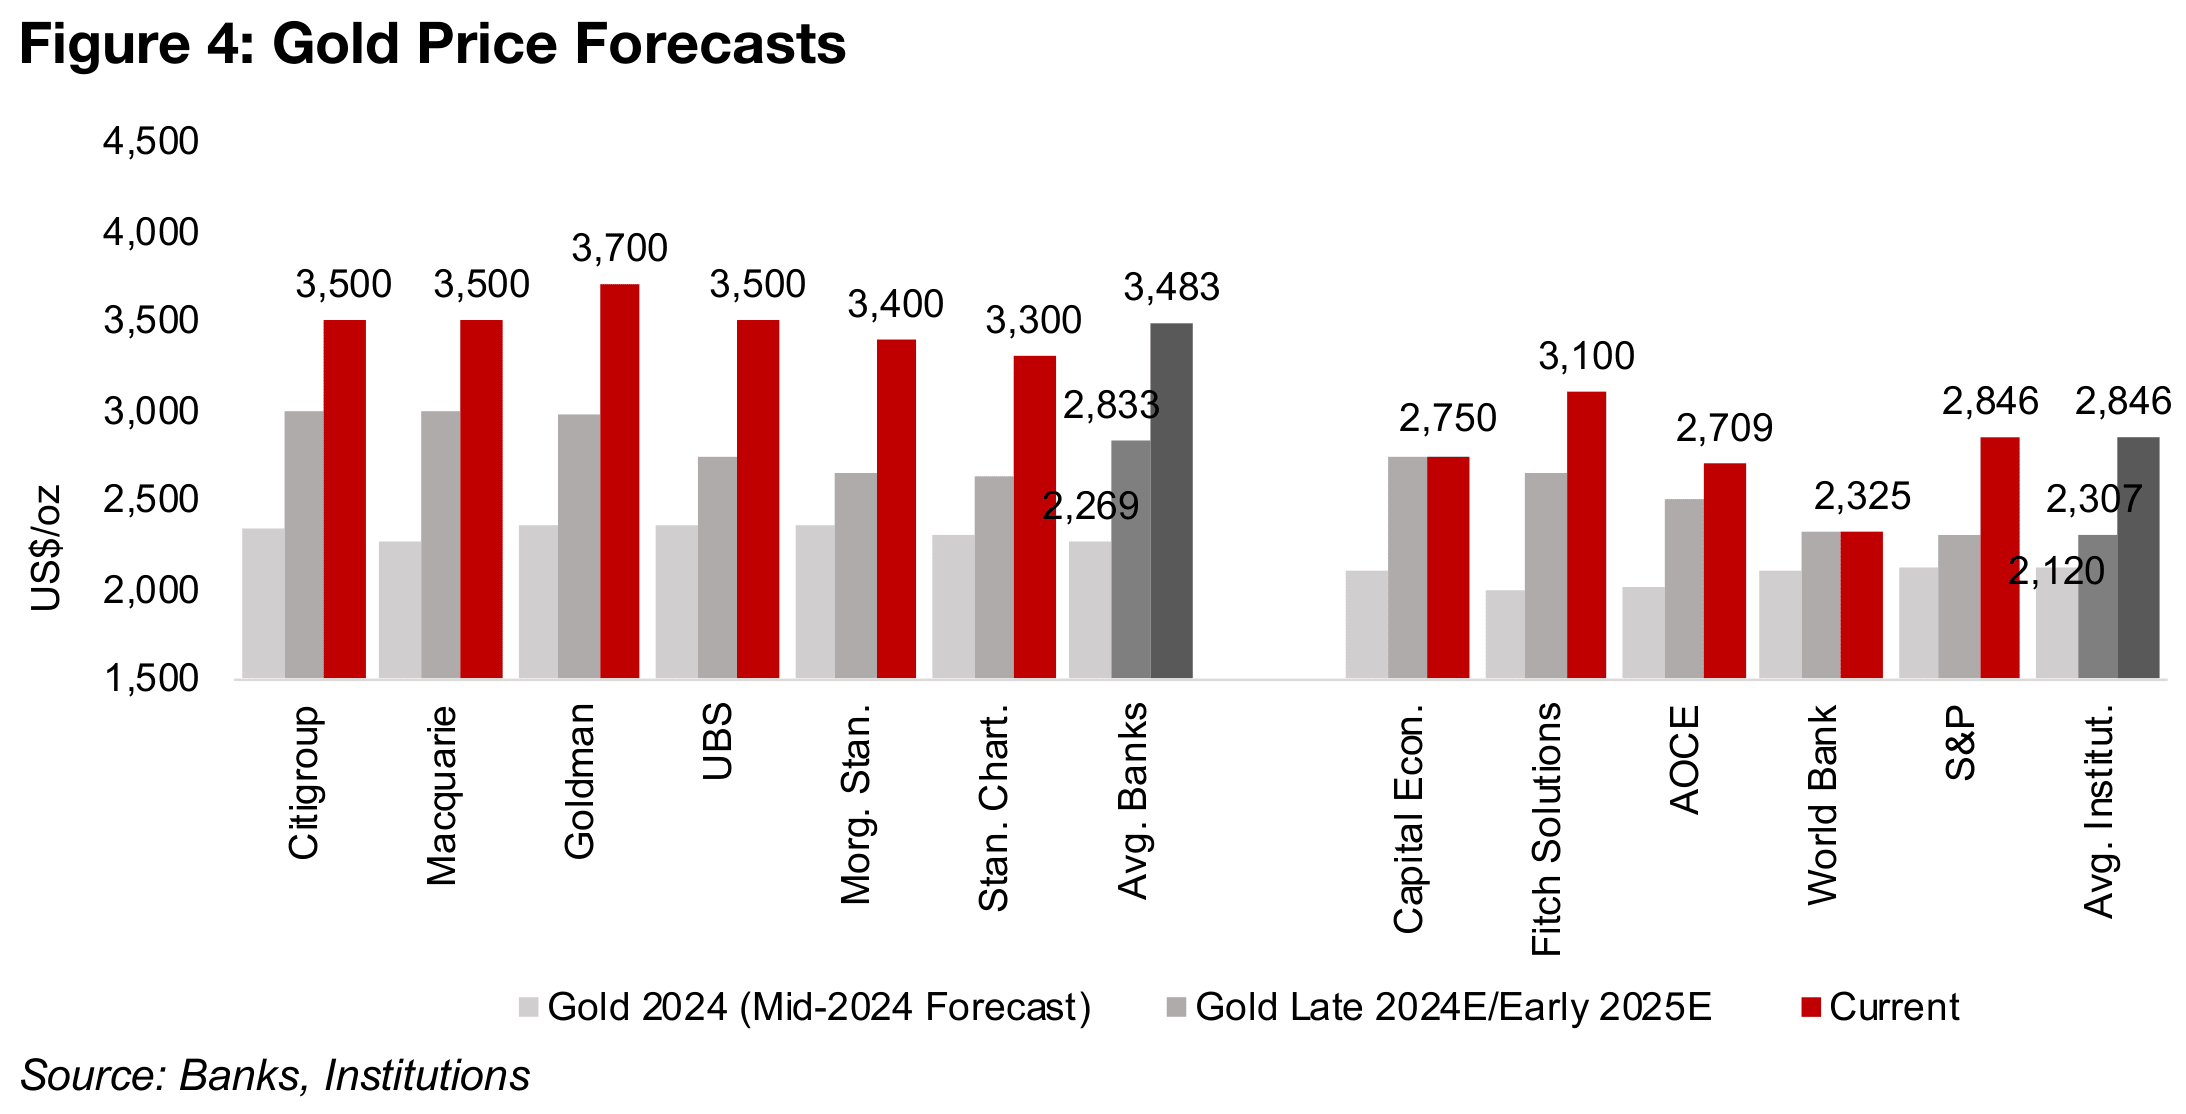
This can be seen by the gold forecasts of the major investment banks, which
averaged just US$2,269/oz as of mid-2024 and increased to only US$2,833/oz near
the end of last year (Figure 4). This left their forecasts significantly lagging the actual
realized gold price over this period. However, this year there has been a shift in this
dynamic, with a dramatic boost to their gold targets, to an average US$3,483/oz, with
a range from US$3,300-US$3,700/oz. This puts all of them now ahead of the gold
price, instead of behind, for the first time in four years. We actually view this as a
concerning trend, as it indicates just how mainstream and consensus the gold trade
has become, which often sets the stage for an asset to see a major pullback.
The major institutions are still behind, however, forecasting an average US$2,846/oz,
with Fitch at the high end with US$3,100/oz, and the World Bank’s low estimate of
US$2,325/oz from October 2024 now dated, and likely to be increased at the next
update. Many of this group have an institutional imperative to forecast an economic
improvement in the forward year, which tends to imply a stable monetary situation,
and therefore no jump in gold. If we do see even the institutions’ estimates get far
ahead of the gold price, this could be a clear warning sign of an advanced bubble.
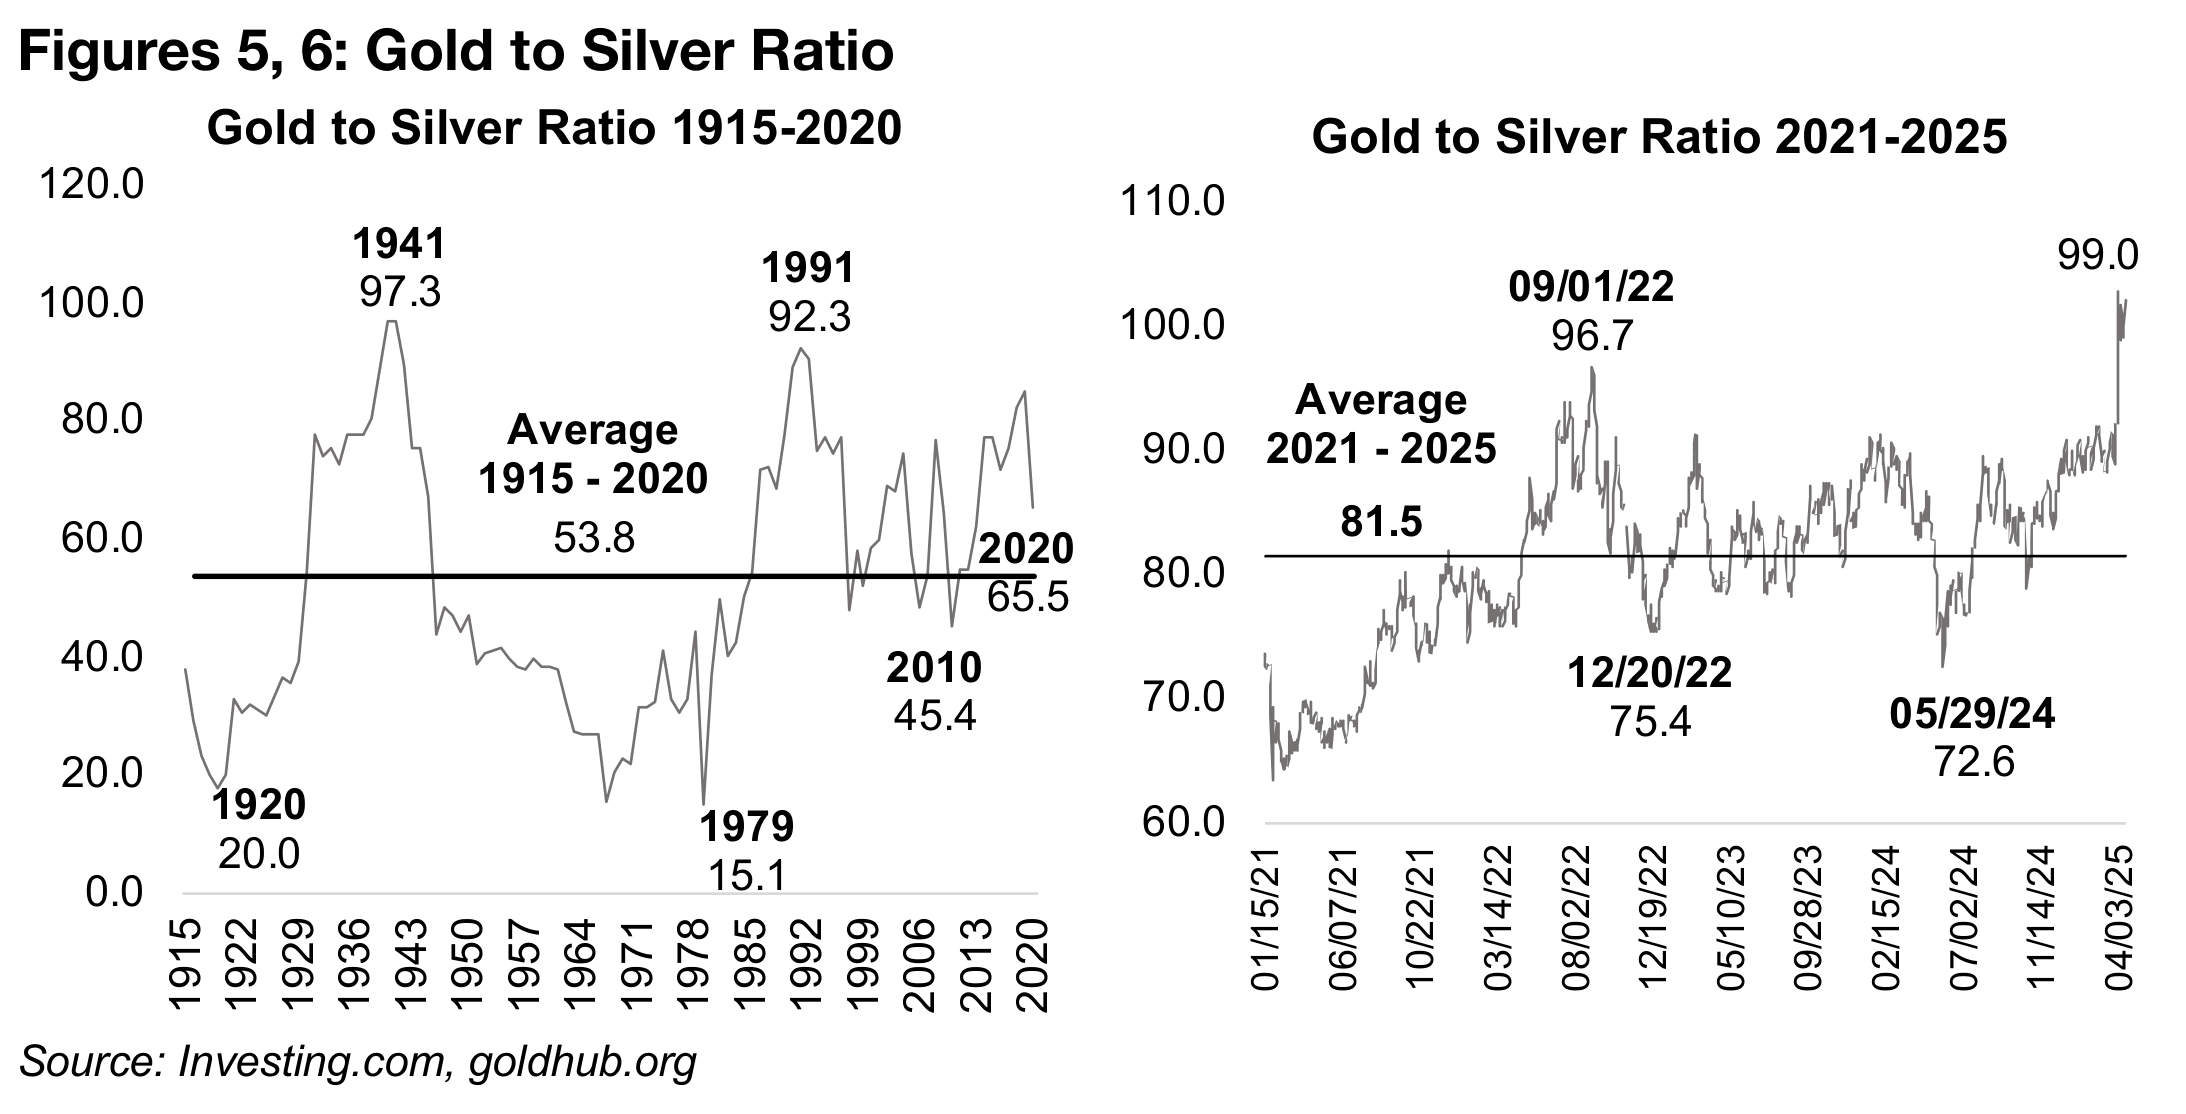
Gold to silver ratio flashing red that rebalance is coming
The gold to silver ratio is one of the most fundamental for the metals, with the two
the closest cousins in the sector. The ratio has gone from slightly above the medium-
term average to a flashing red, truly historic, all-time high of 99.0x in just two months,
above long-term peaks of 92.3x in 1991 and 97.3x in 1941 (Figures 5, 6). This
suggests that gold will either need to plunge, or silver to surge, to bring this ratio back
into reasonable historical balance.
While given gold’s parabolic recent move, we would not entirely rule out some short-
term pullback, even if just from profit taking, while the broader uptrend remains intact,
there is also a case for a substantial rise in silver. The metal is a rare hybrid, driven
both by monetary factors, like gold, but also industrial factors, like copper. Historically
there has not been a consistent pattern for which of these two metals silver tracks
more closely in a range of economic scenarios. If the market starts to focus more on
its monetary factors, it could rapidly close the gap with gold, as it is widely expected
that the monetary expansion already underway by most central banks will continue.
However, as there are also expectations for slowing global industrial growth, if the market focuses on this side of silver’s demand, as it seems to be currently, it could continue to linger below the gold price. Overall we expect that there is a high probability that the market does start to price in more of a premium for silver’s monetary role and that this reduces to ratio to more balanced levels versus its history. There could also be a short-term reversal of the gold if its parabolic move continues, with this type of correction common in most of the metal’s historical bull markets.
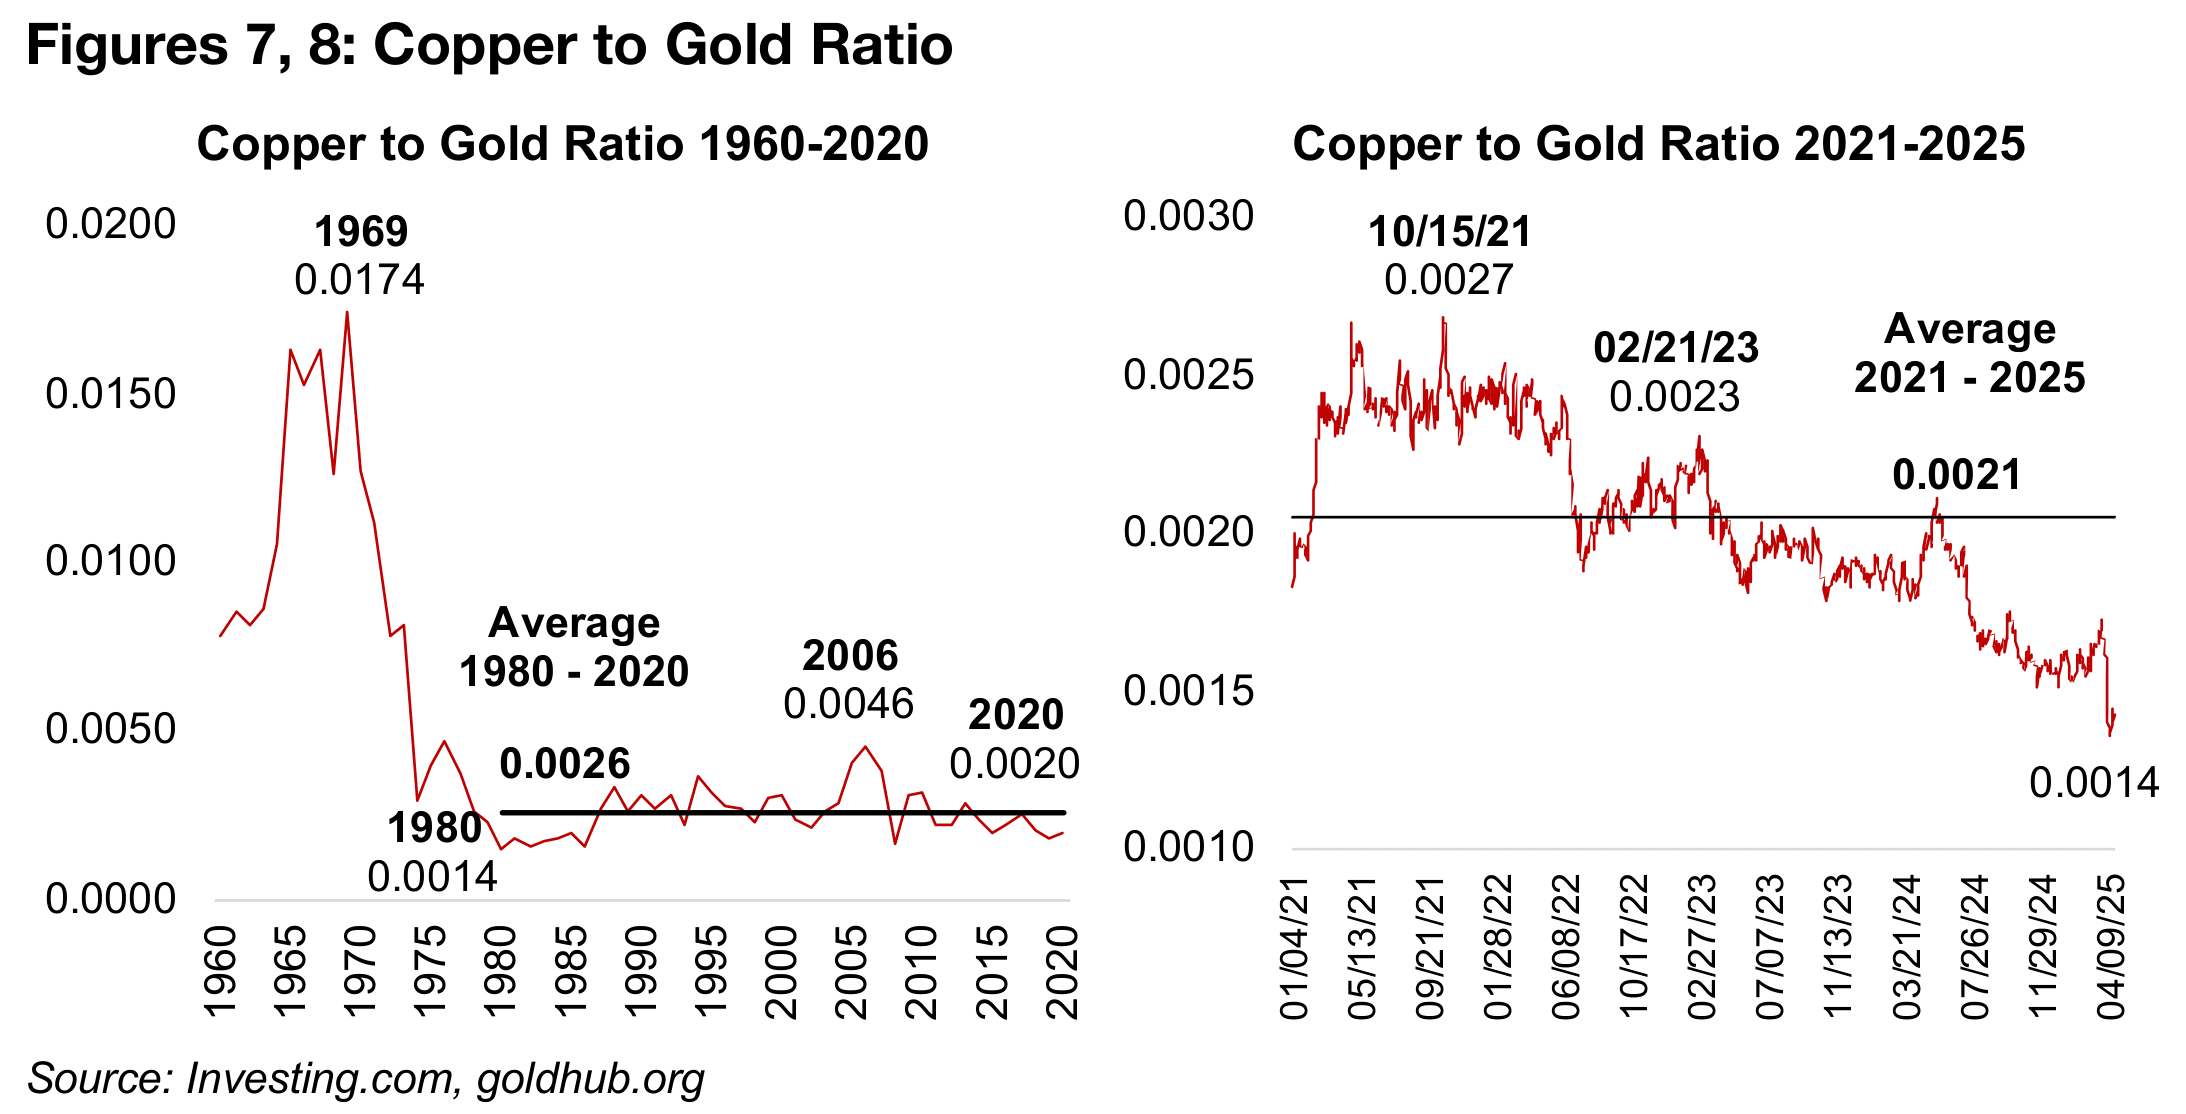
Copper to gold at the lowest since 1980s
The copper to gold ratio can be viewed an indicating the split between the market’s expectations for the industrial and monetary sectors of the economy. Currently there seems to be severe concerns of an industrial decline, accompanied by a monetary surge, in turn implying stagflation, a period of low growth but elevated inflation. The ratio has dropped to just 0.0014, the lowest level since the 1980s, and well below the 0.0021 average of the past four years and 0.0026 of the past four decades (Figures 7, 8). This ratio was also already low well before the crash, having fallen below the medium-term average as early as mid-2024, indicating that expectations of downward industrial cyclicality are not new to the market, only just more severe.
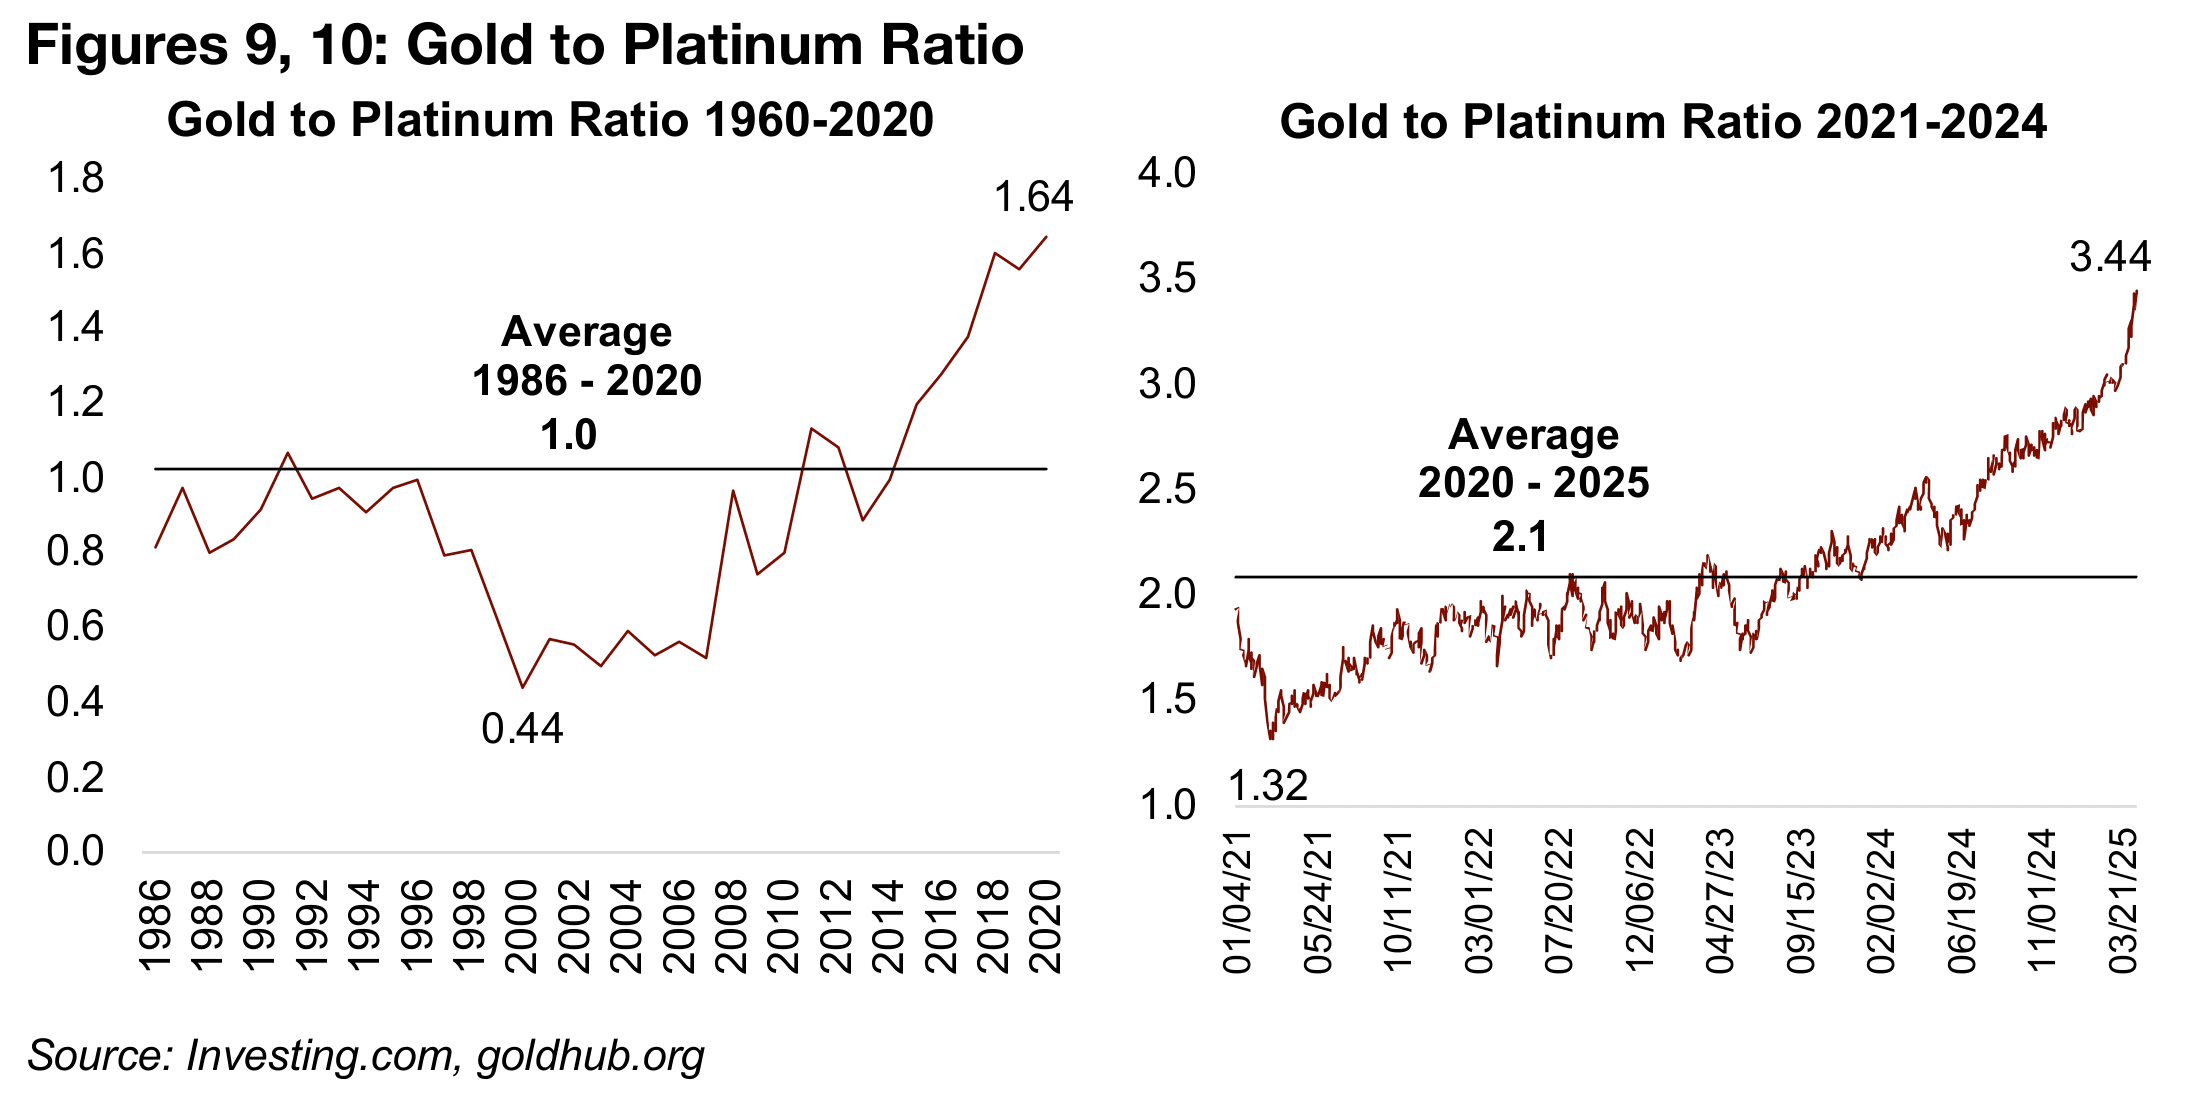
Gold to platinum at long-term highs
While copper is a broad indicator of industrial demand, platinum more specifically reflects the auto industry outlook, with its main use in autocatalysts. It is also a hybrid, with some monetary demand, but less than for silver, and more than for almost entirely industrial factor-driven palladium. The ratio has surged to long-term highs of 3.44x, far above its medium and long-term averages of 1.0x and 2.1x, with platinum lagging on concerns of an auto industry slowdown (Figures 9, 10). There is a case that the long-term average is less applicable currently given a structural shift in the metal’s demand towards industrial over monetary factors. However, even taking this into consideration, the ratio does seem quite inflated.
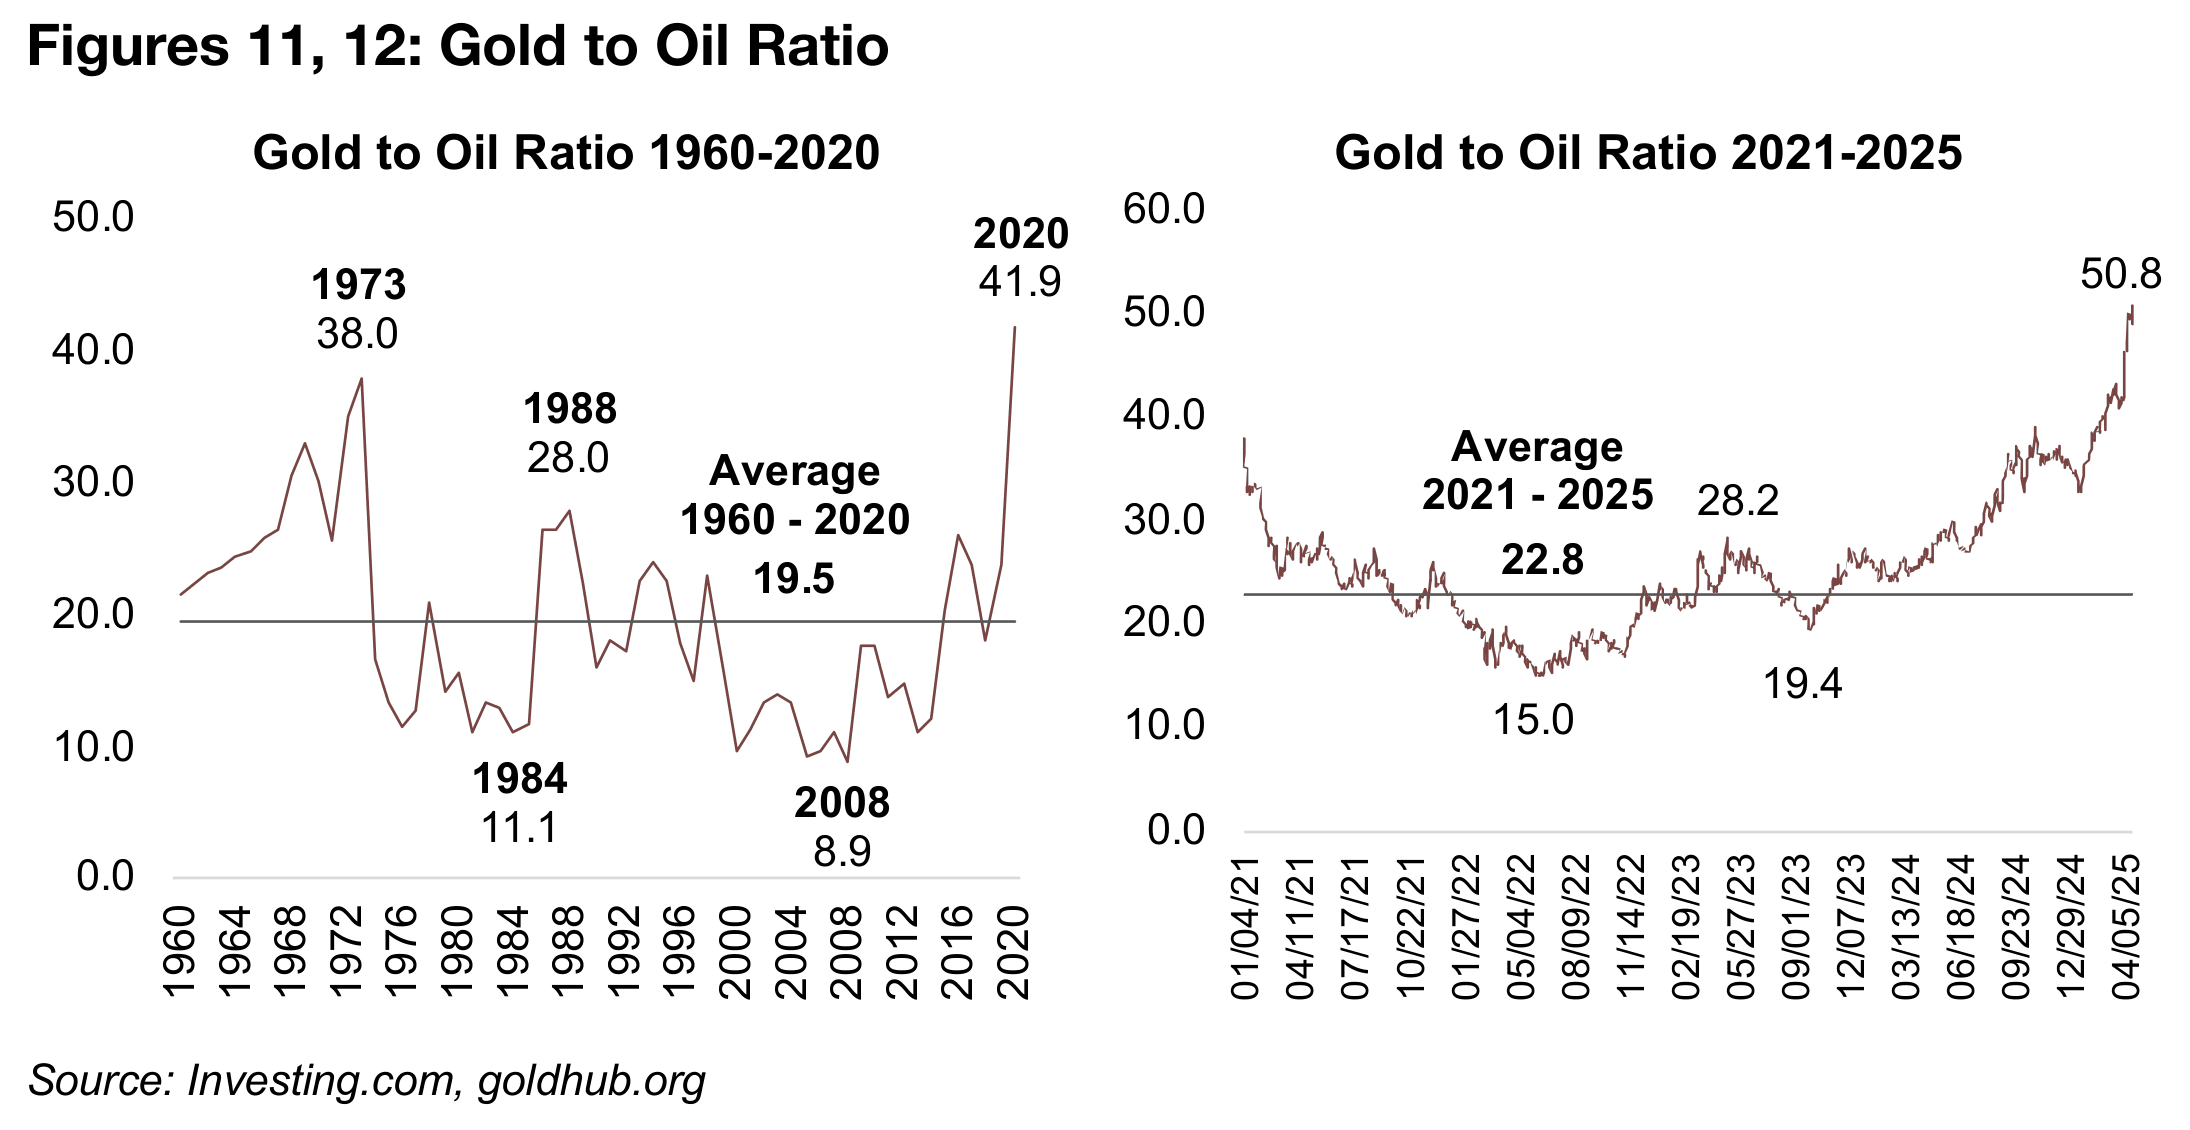
Gold versus oil above highs, near peak versus commodities
The gold to oil ratio has jumped to 50.8x, up from just over 30.0x at the start of 2024. This is considerably above long-term highs of 41.9x in 2020 and 38.0x in 1973, with the latter reached around the start of an extended stagflationary period (Figures 11, 12). It is also more than twice both the medium-term and long-term averages for the ratio, which are similar, at 19.5x from 1960-2020 and 22.8x from 2021-2025, suggesting a relatively steady dynamic between the two assets. This has been driven partly by a major decline in the oil price, on concerns over a potential decline in global industrial demand. There has also been pressure from the demand side, with many global oil producers expected to increase output this year.
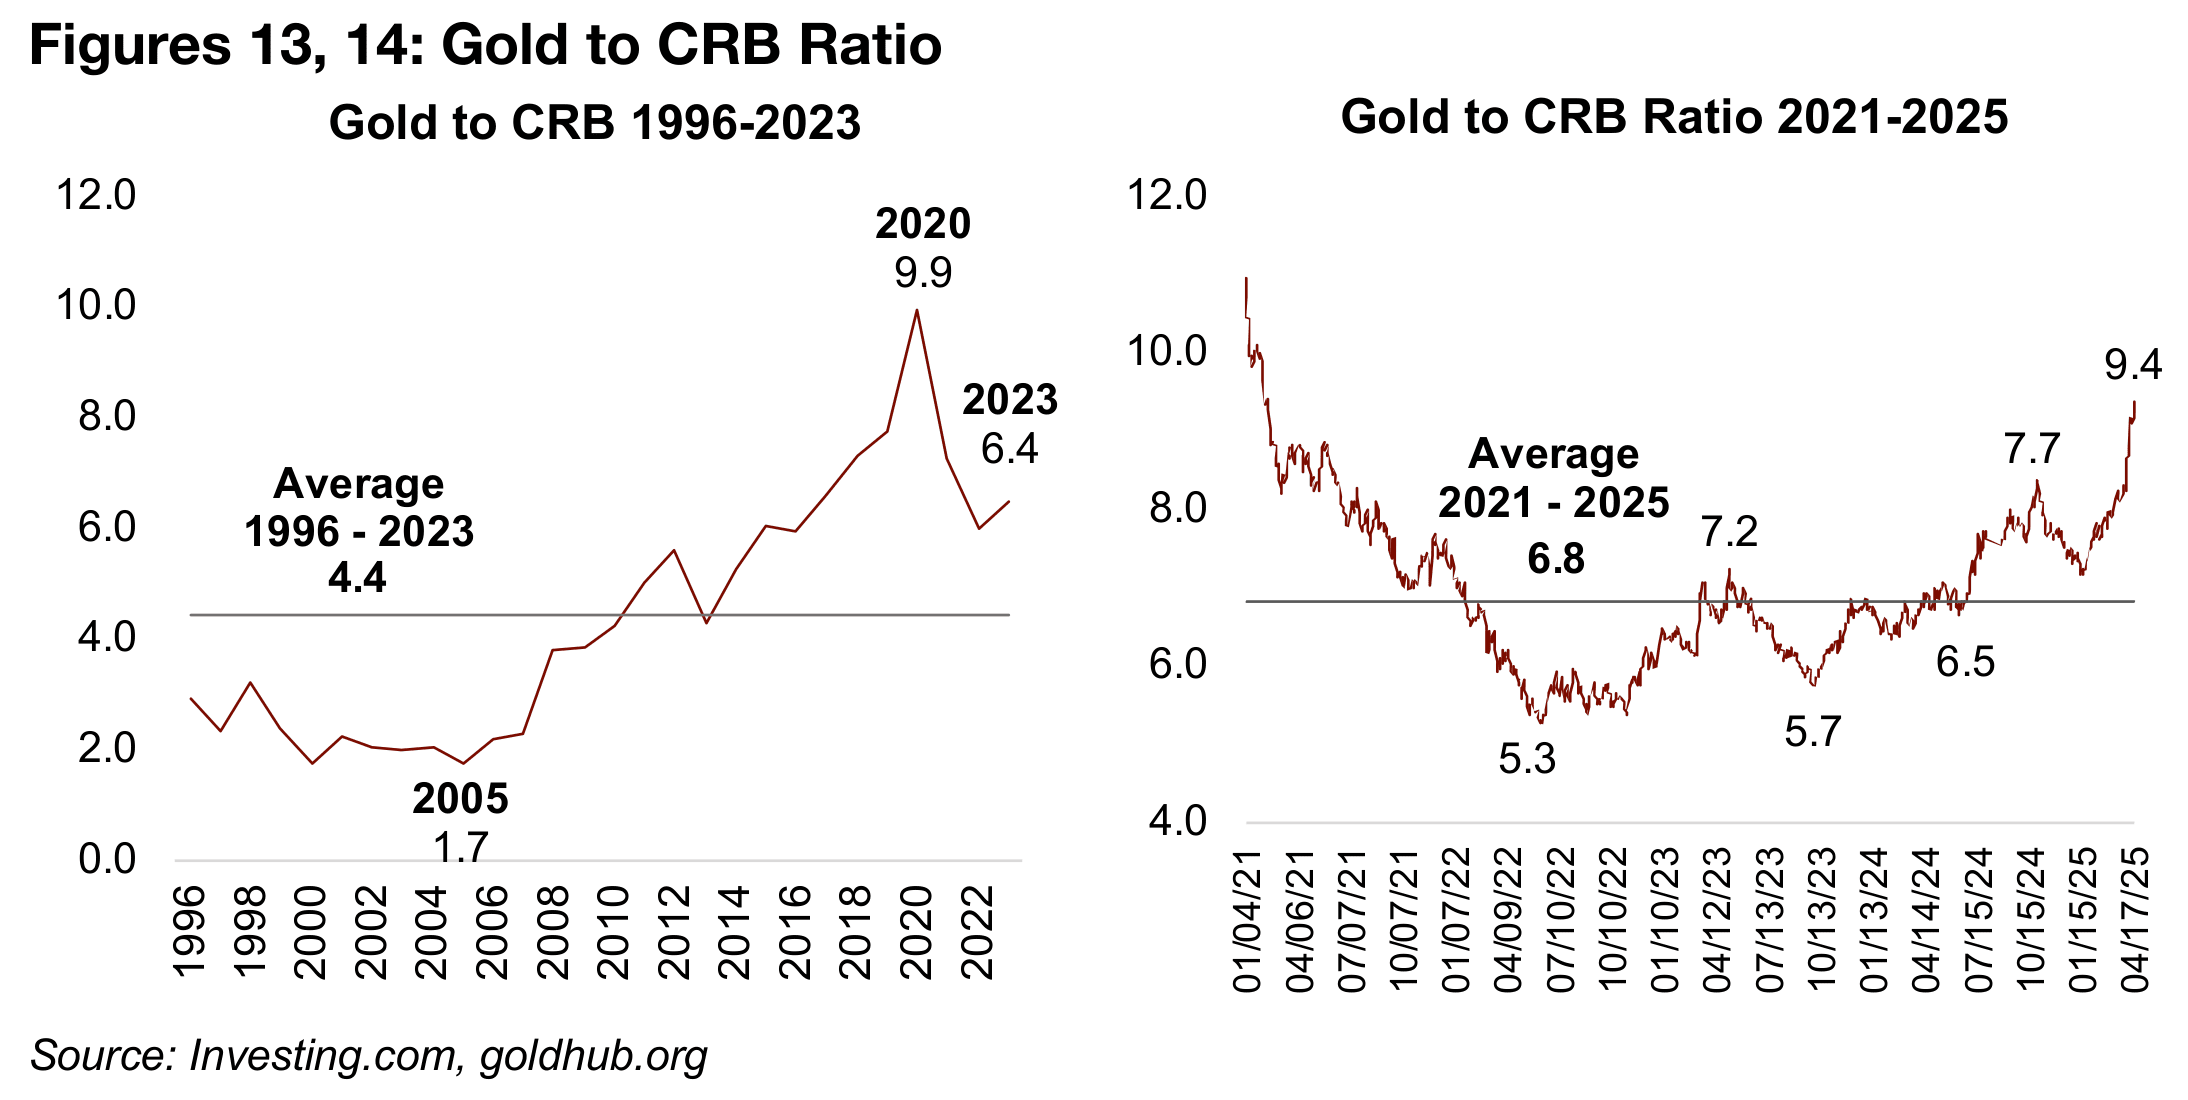
There has been a similar major breakout in the gold to CRB Commodities Index ratio to 9.4x, heading for the 2020 highs of 9.9x, more than twice the average from 1996- 2023 of 4.4x, and well above the medium-term average from 2021-2025 of 6.8x (Figures 13, 14). The ratio started the year only slightly above the medium-term average after a major rise in many major commodities towards the end of 2024, leaving gold not looking particularly overvalued versus commodities more broadly. However, some of these big gainers have cooled in 2025 even as gold gained.
S&P 500 to gold ratio sees huge reversal on tech decline
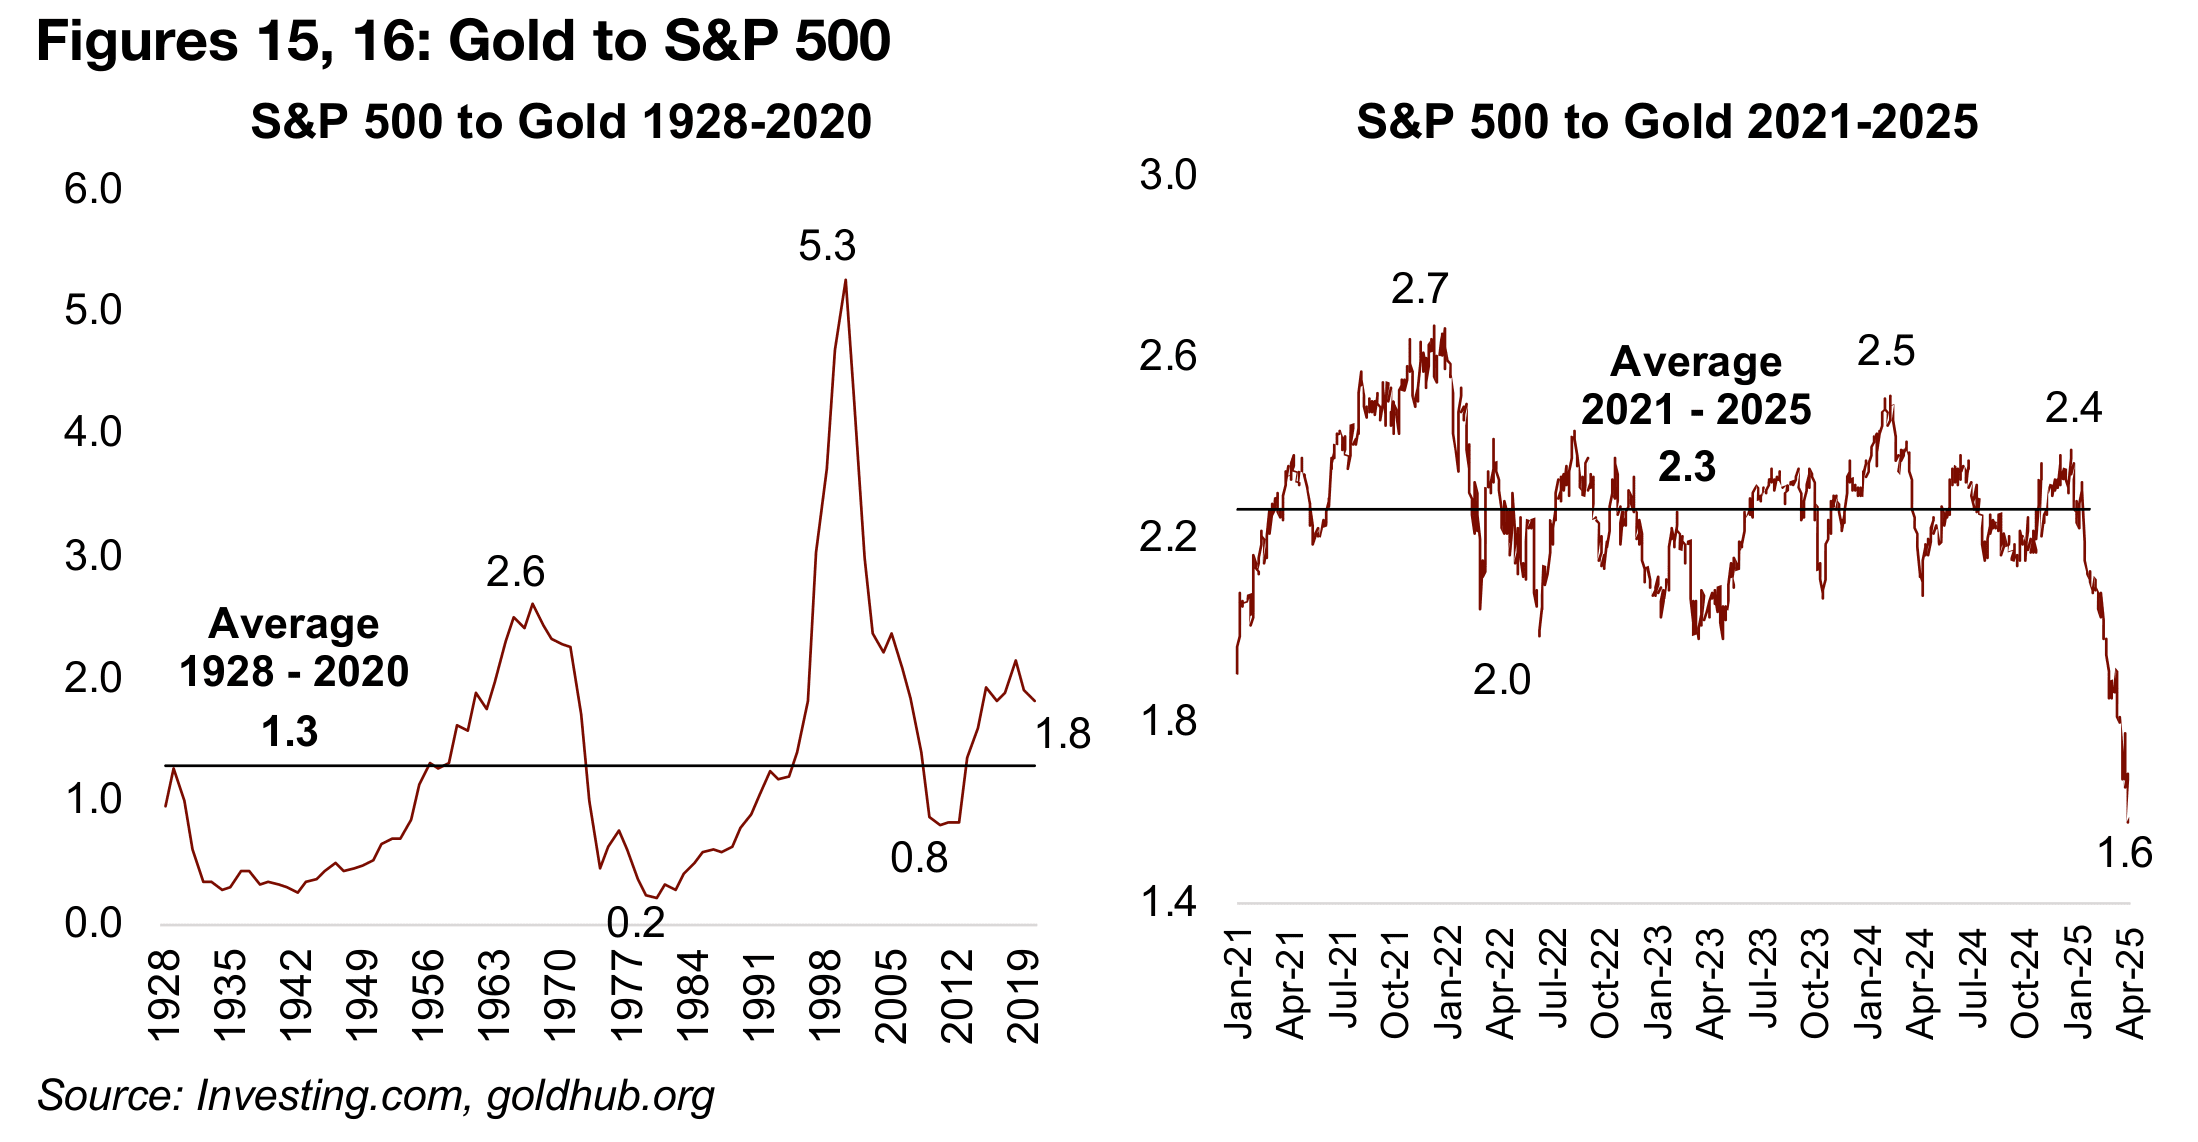
The S&P to gold ratio has also seen a huge move, plunging to 1.6x currently from 2.4x in February 2024, substantially above the long-term average of 1.3x and slightly ahead of the 2.3x average from 2021-2025 (Figures 15, 16). This was caused by the S&P 500 crash, which was in turn was driven by the decline in tech. The tech sector seems to have been the main factor keeping the ratio so elevated from 2021 to 2025, and it was also cause of the spike in the ratio in 2000 to 5.3x. While a simultaneous spike in gold exacerbated the move, this is the one ratio of the group where it seems that the comparable asset has been as much of a driver as the metal.
Gold versus sector stocks ratios ease on equities gain
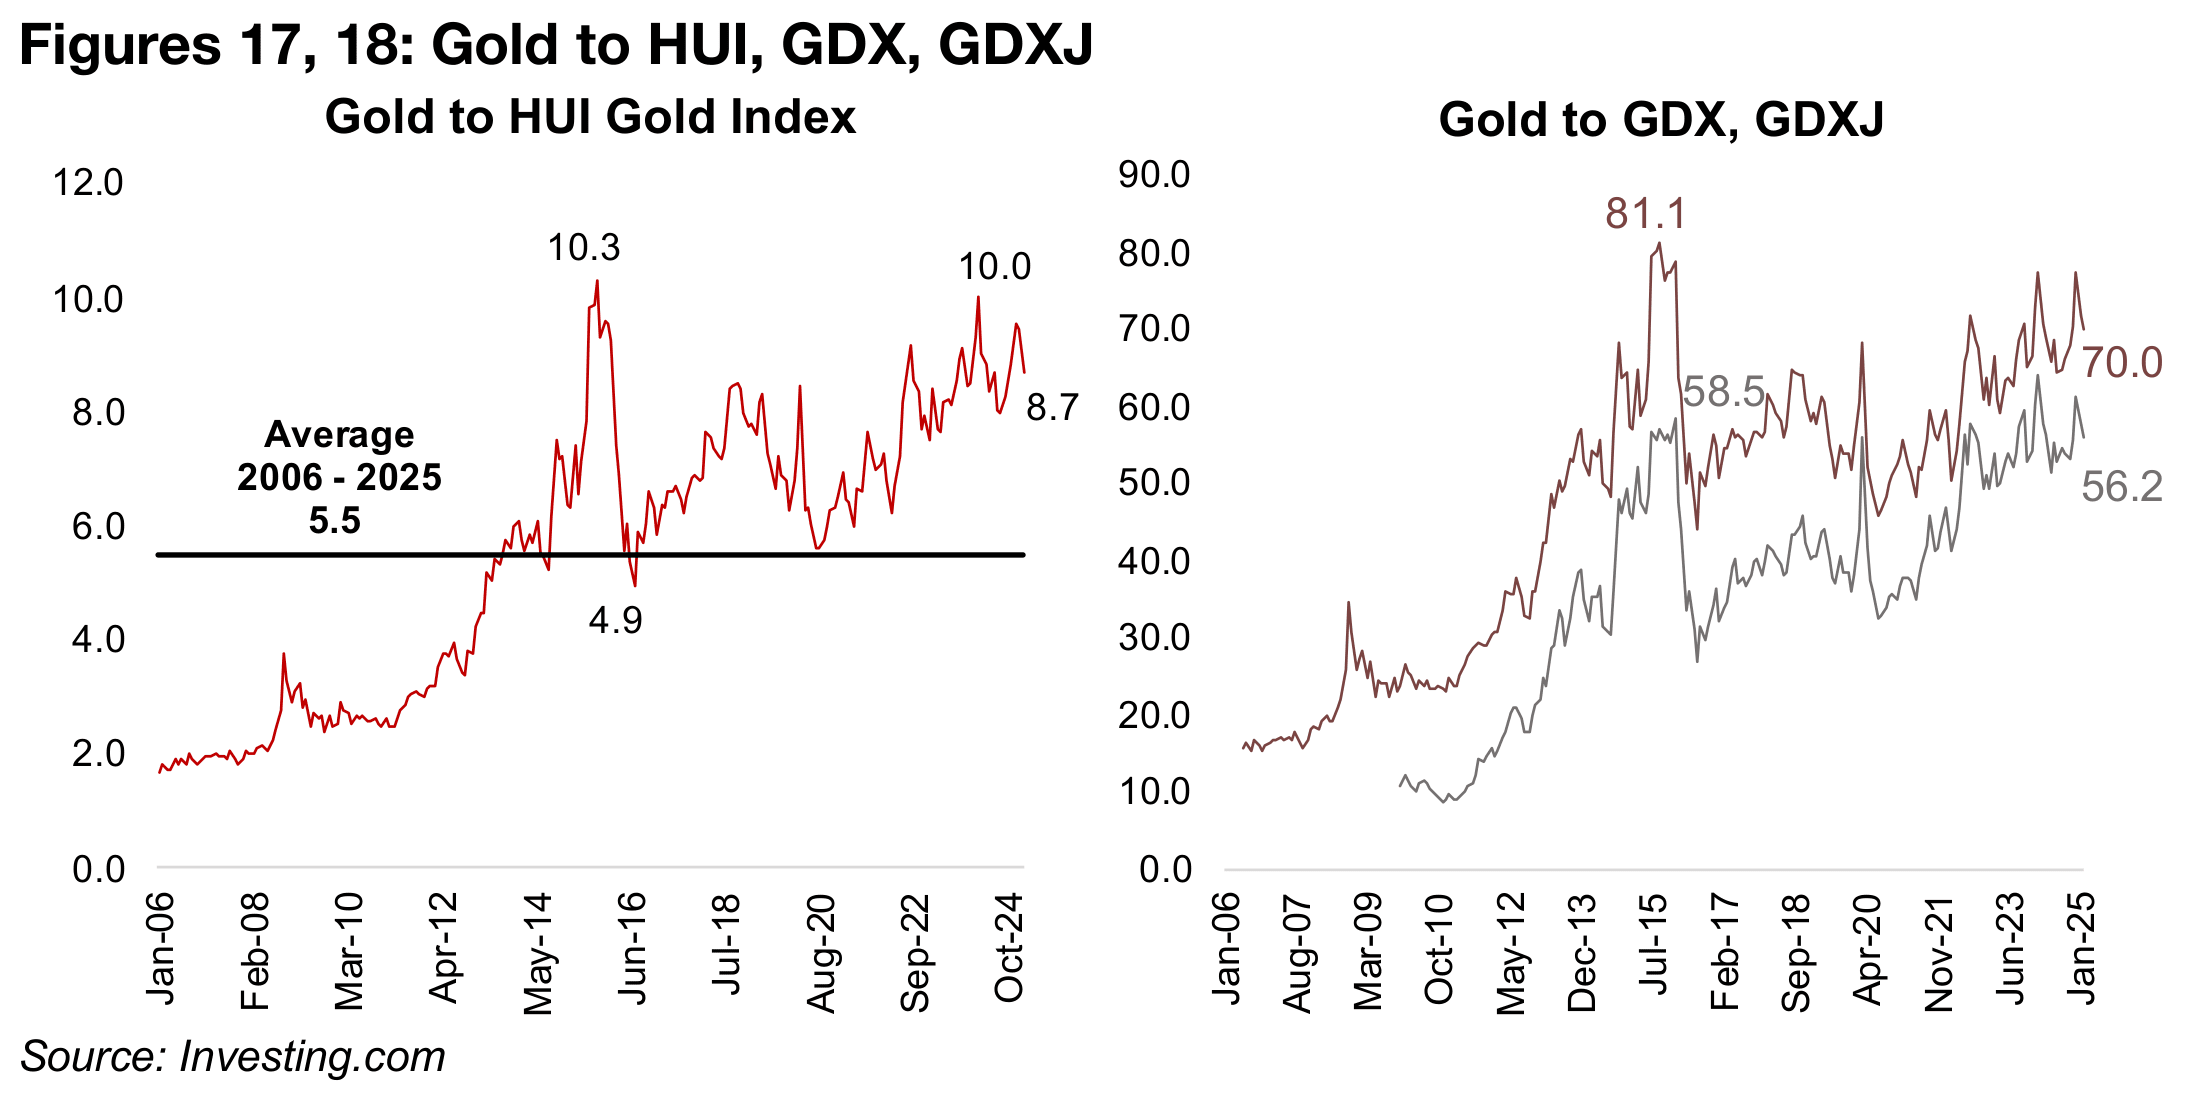
While the gold versus sector equities ratios are still very high historically, the gold to
HUI goldbugs, GDX and GDXJ ratios have pulled back over the past two months from
recent peaks in February 2024 as the stocks have risen (Figures 17, 18). The main
reason the ratios remain high seems to be that the market is still not pricing in the rise
in gold as sustainable long-term. It could also partly be from the market expecting
that a bear market could drag down valuations of all stocks, which could also weigh
on the gold sector.
However, with gold sector valuations still relatively low even after the huge rise in the
price, it does provide a cushion for the sector, especially in contrast to tech multiples,
which remain elevated even after the recent crash. This also leaves room for multiple
expansion even if the gold price even just remains at current levels, which could see
a period of gold stocks rising faster than the gold price and reducing these ratios.
However, we would not necessarily weight the probability of this scenario highly.
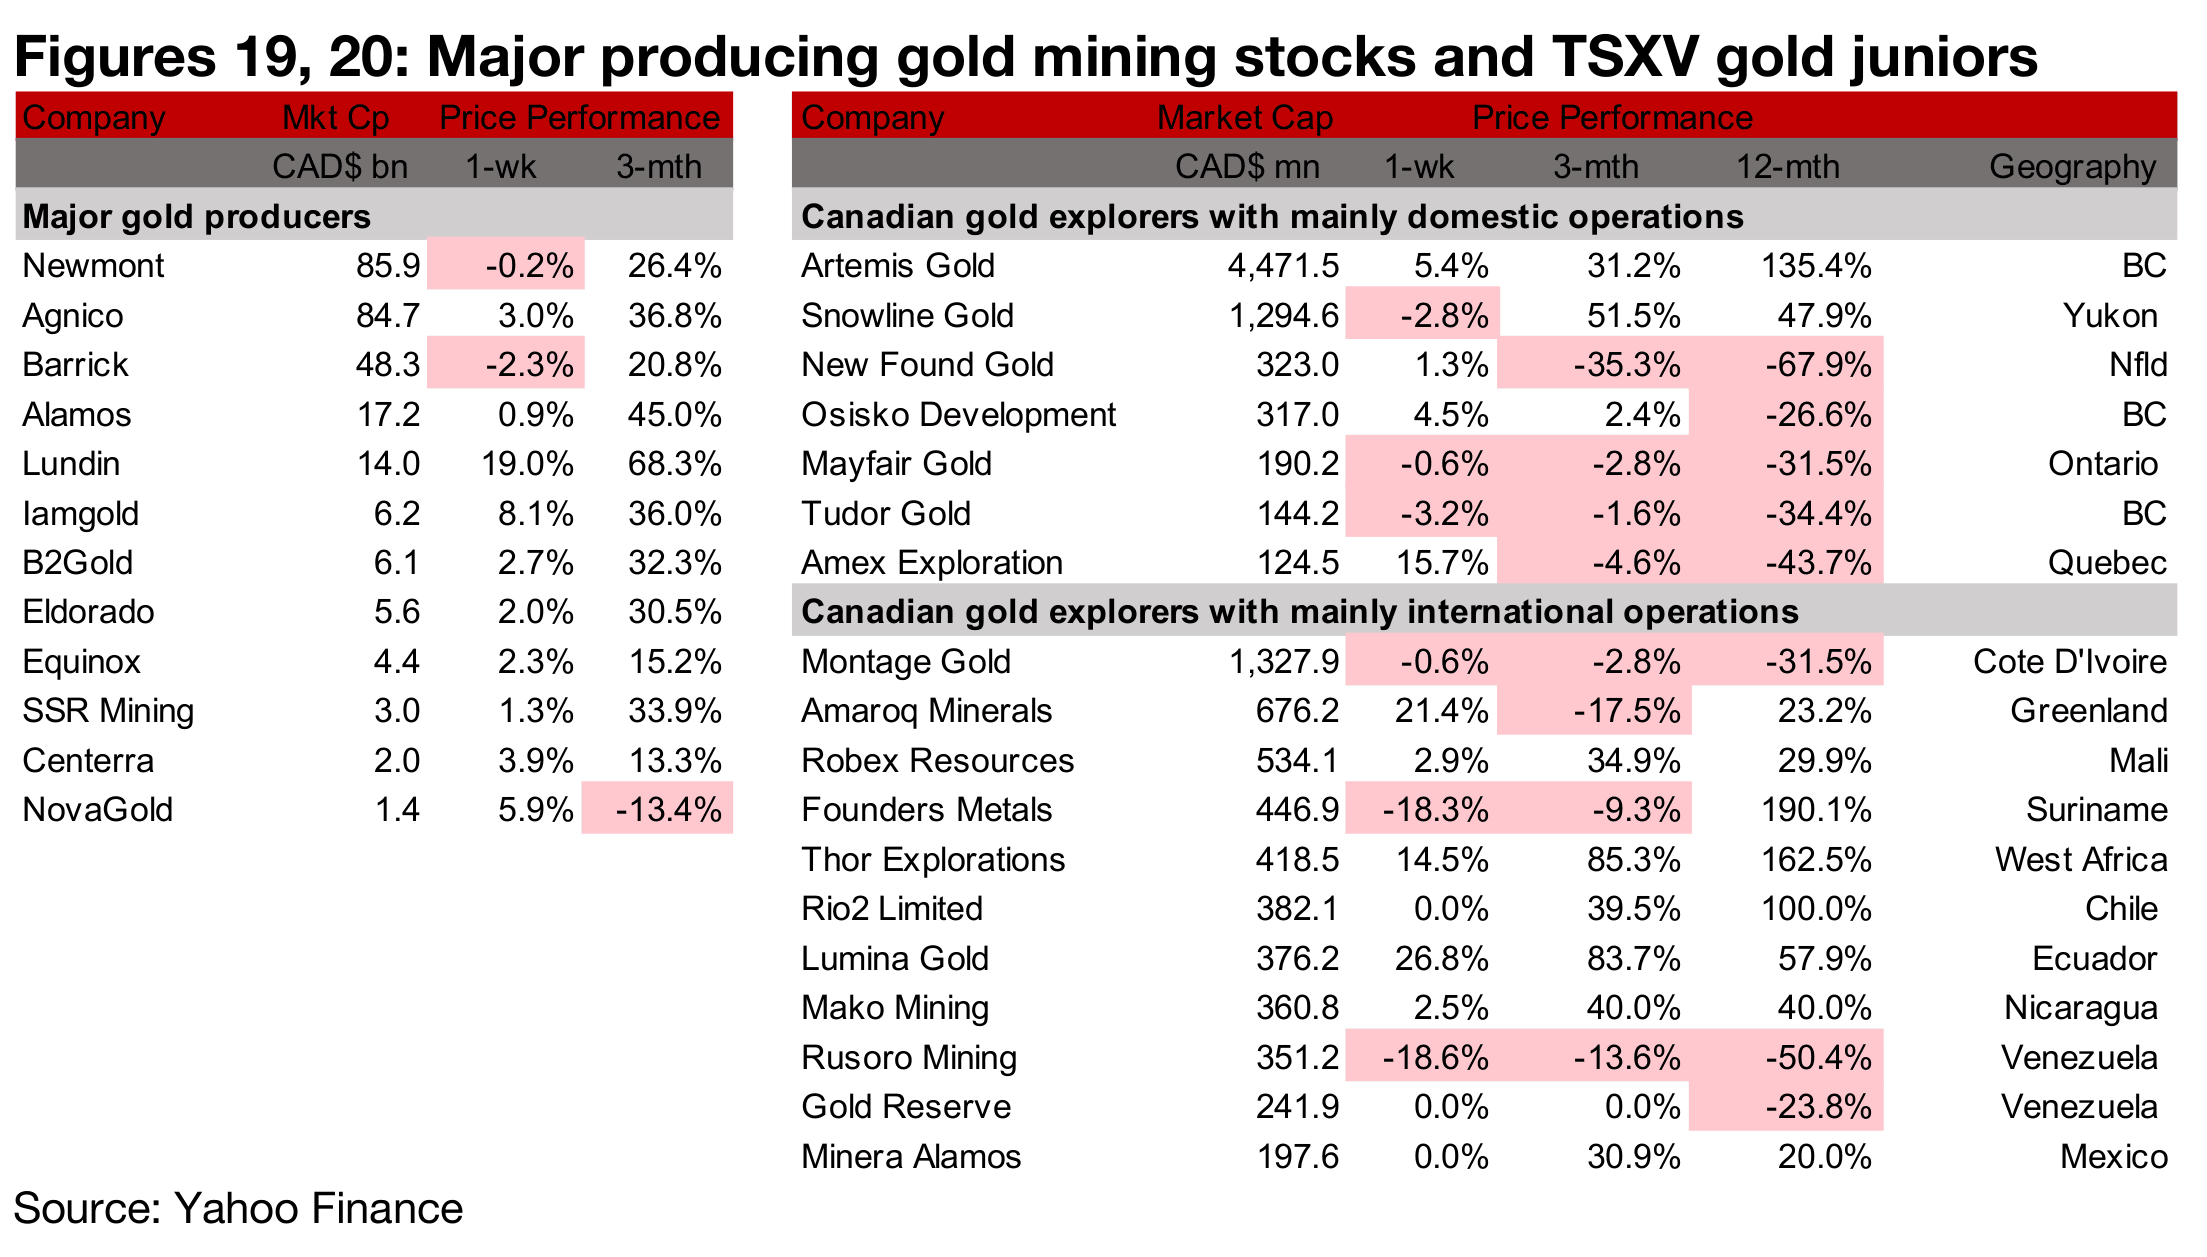
Major producers and TSXV large gold mostly up
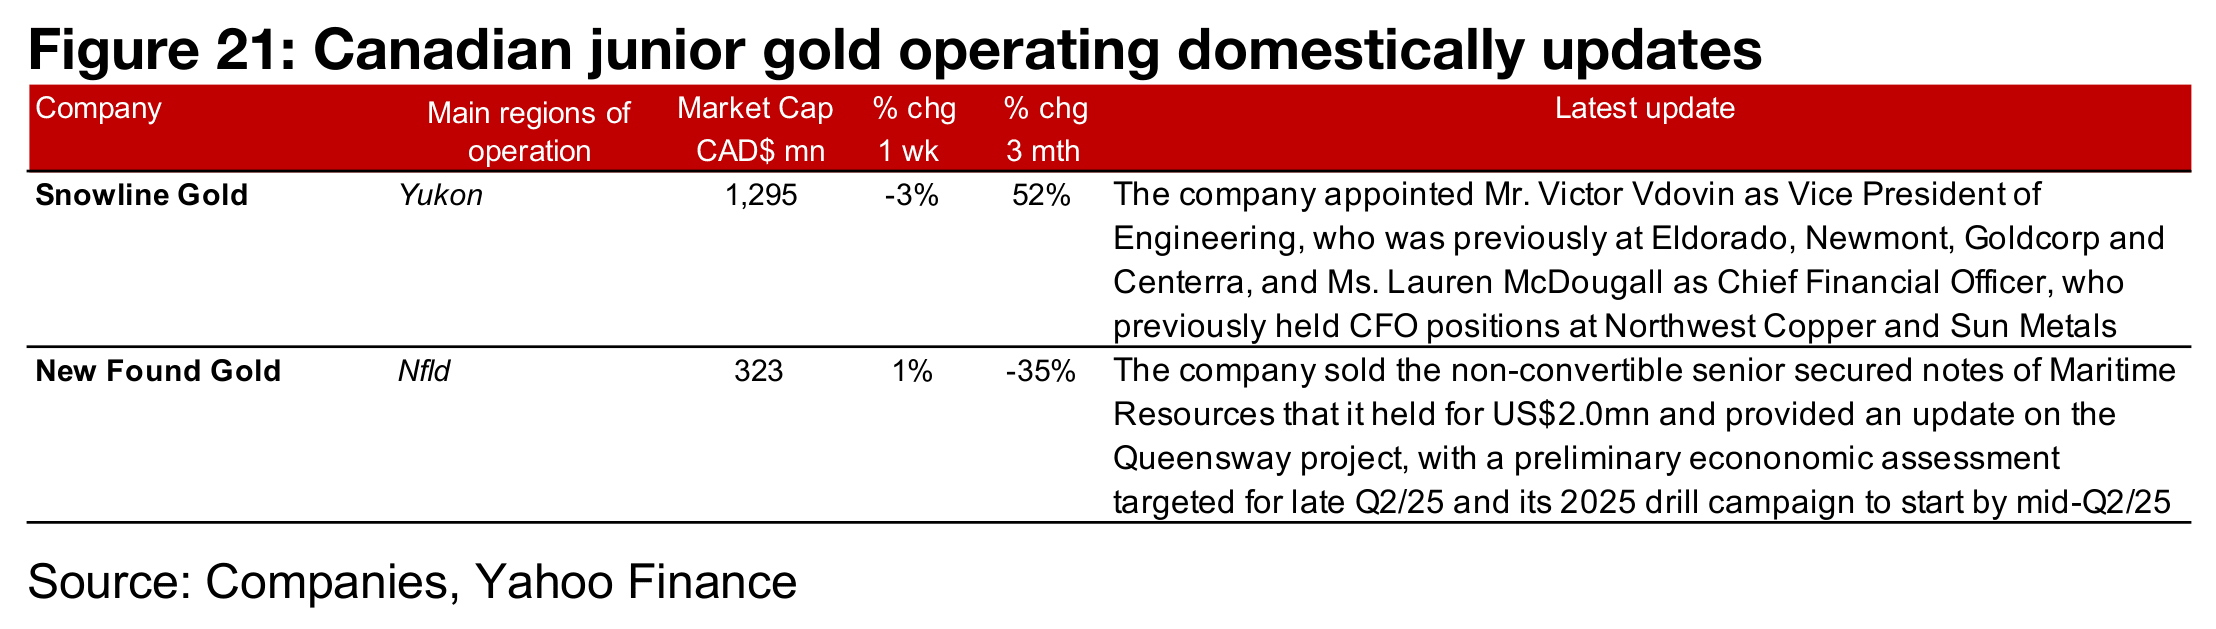
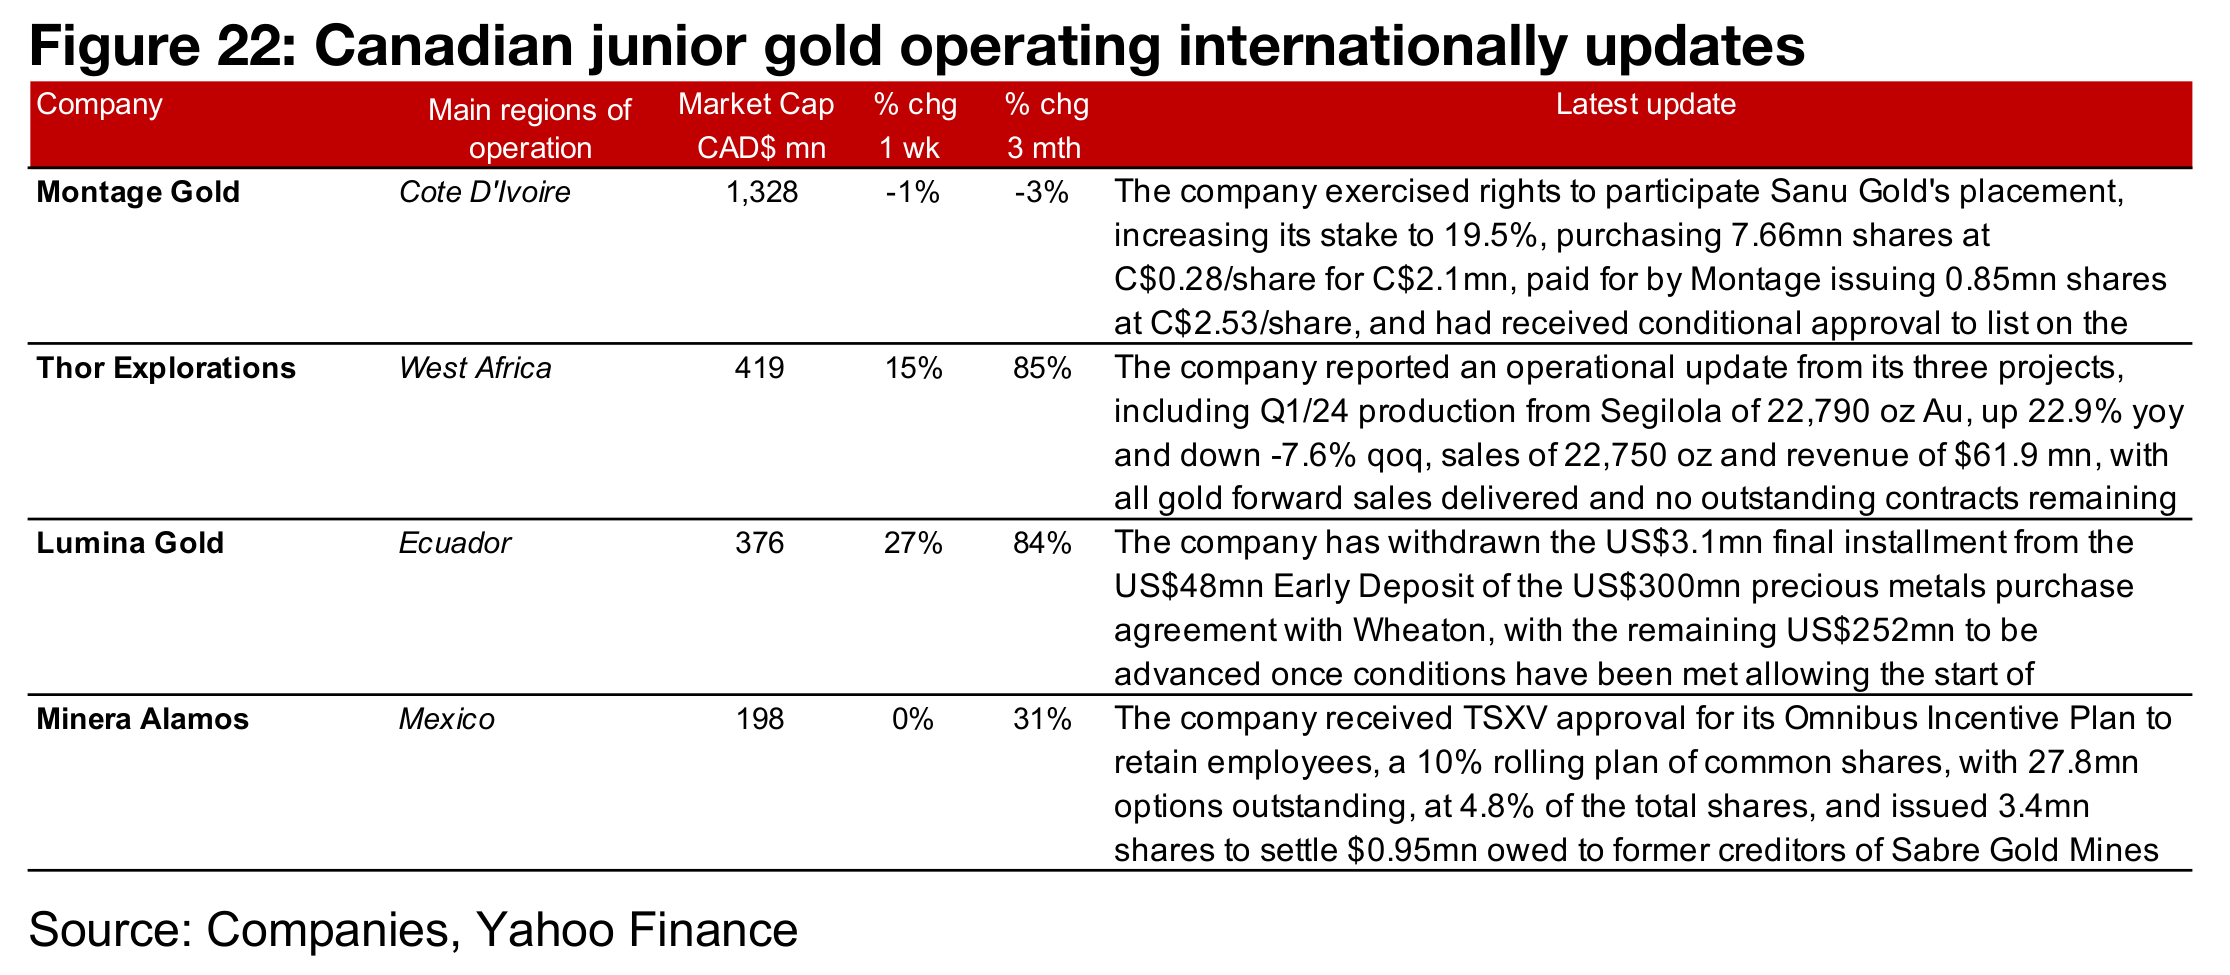
Most of the major gold producers and TSXV large gold rose on the strong gold price (Figures 19, 20). For the TSXV gold companies operating mainly domestically, New Found Gold sold the notes of Maritime Resources it held for US$2.0mn and provided an update on Queensway with a PEA expected by late Q2/25 and drilling to start by mid-Q2/25, and Snowline Gold appointed Mr. Victor Vdovin as VP of Engineering and Ms. Lauren McDougall as Chief Financial Officer (Figure 21). For the TSXV gold companies operating mainly internationally, Montage Gold exercised rights to participate in Sanu Gold’s private placement, issuing its own shares for a C$2.1mn purchase, with its stake rising to 19.5%. Thor Explorations reported an operational update on its projects, including Q1/25 production and sales from Segilola, and Minera Alamos received TSXV approval for Omnibus Incentive Plan and issued shares to settle $0.95mn owed to former creditors of Sabre Gold (Figure 22).
Disclaimer: This report is for informational use only and should not be used an alternative to the financial and legal advice of a qualified professional in business planning and investment. We do not represent that forecasts in this report will lead to a specific outcome or result, and are not liable in the event of any business action taken in whole or in part as a result of the contents of this report.