October 30, 2020
Gold, the health crisis, and US elections
Author - Ben McGregor
Health crisis resurgence concerns hit gold this week
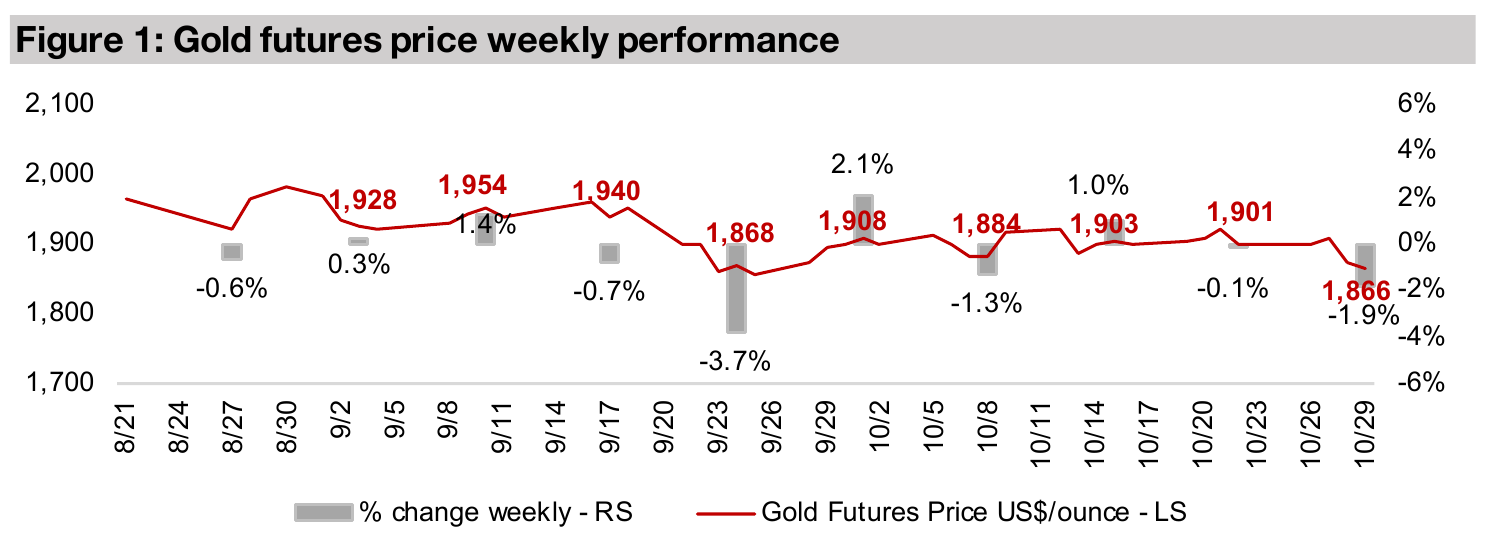
The gold price dipped 1.9% this week to US$1,866/oz, its worst performance in a month and a half, as concerns of the global health crisis resurging in the winter months hit gold, and the S&P 500, which declined -4.1%.
Health crisis boosts gold but no consistent effect from US elections
Although gold was down this week on the health crisis, the long-term trend has been the opposite; more cases mean higher gold. While the other potential driver could be the upcoming US election, historically these have no consistent effect on gold.

A look at the link between gold's rise and the health crisis
While gold dipped this week as concerns about the health crisis rose, in general this
goes against the overall trend of the past six months, which has been that as health
crisis cases rise, so does gold. However, we saw something similar this week to what
we saw in March 2020, a panic phase, in which everything is sold, even gold, although
gold tends to hold up versus other asset classes. For example, the S&P plunged 33%
from its February 2020 peak to its March 2020 trough, but gold was down just 11%,
and this week the S&P slid -4.1% but gold declined just -1.9%.
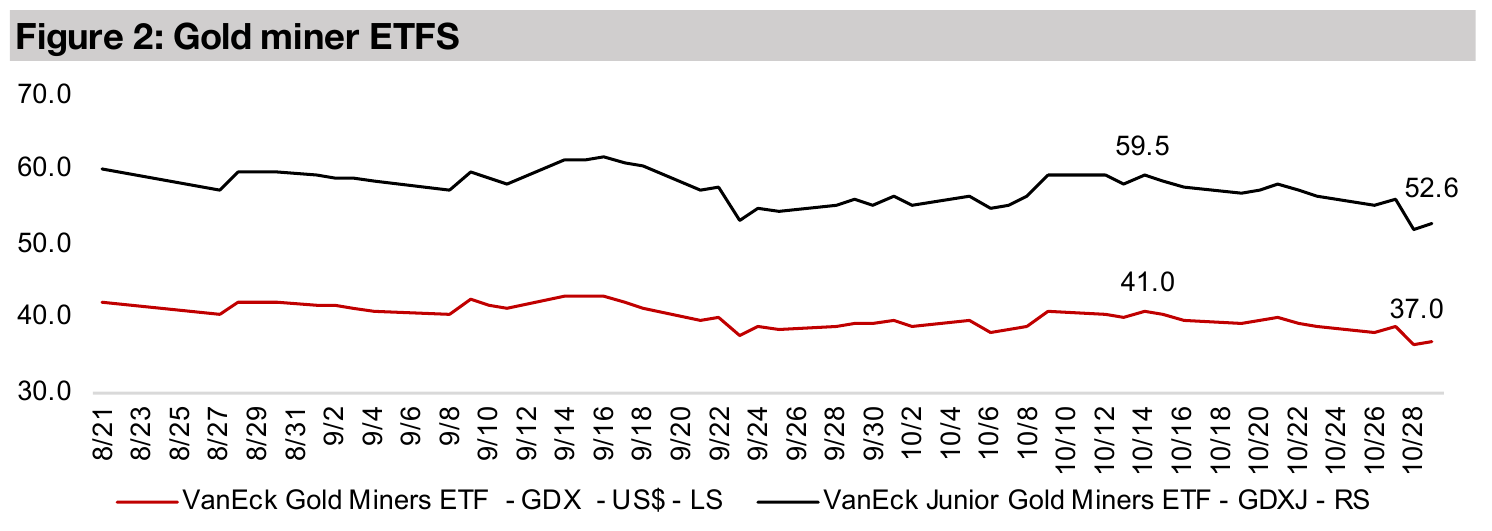
Also in keeping with the March panic, this week we saw gold ETFs fall much more
severely than gold itself. This was from two effects; 1) the companies in these funds
are highly leveraged to gold, and thus can be expected to rise and decline by a
multiple of the change in gold and 2) a broader sell off of risk assets, with more risky
assets being hit the hardest, with, for example, the GDX of less risky producing miners
down -5.7% but the riskier junior mining ETF GDXJ down -7.9%.
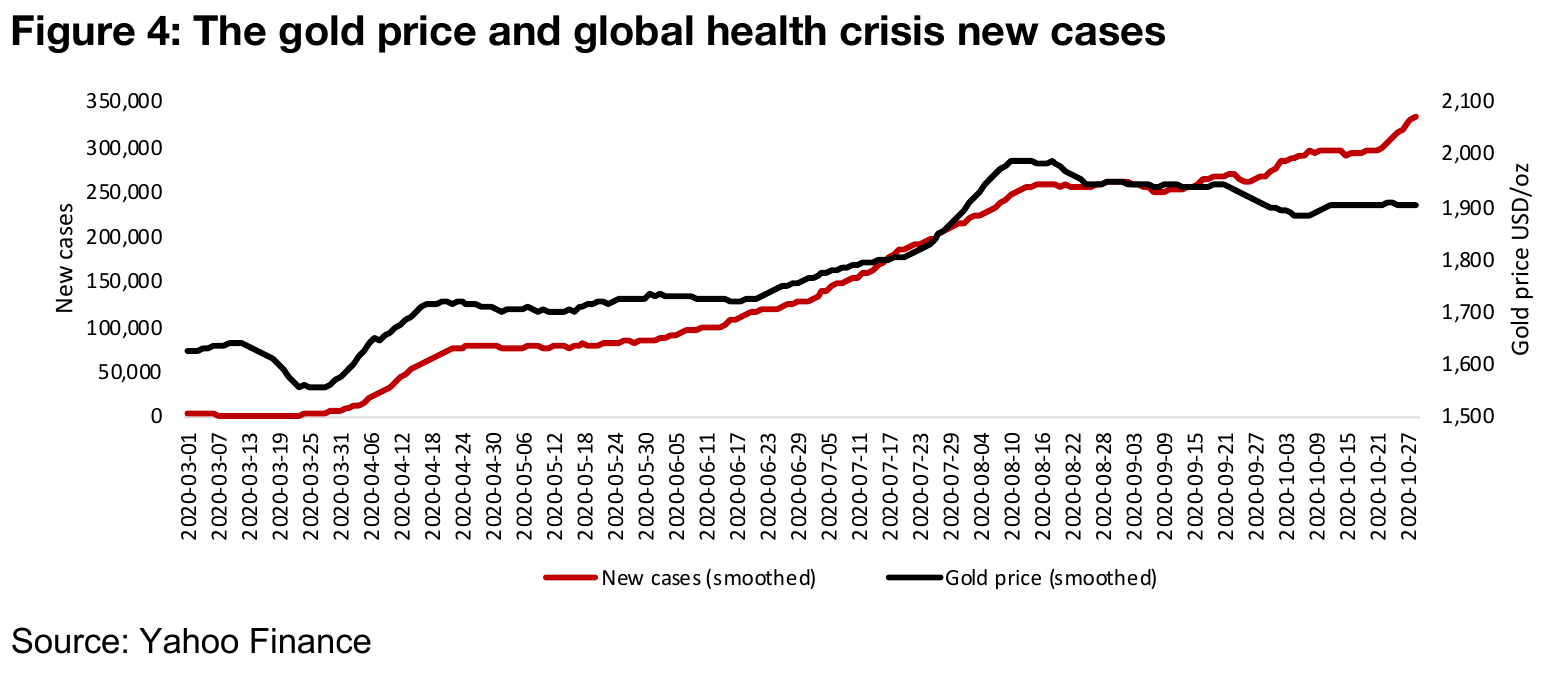
The gold price and the new health crisis cases are shown in Figure 4, indicating a
reasonably strong correlation. We could also consider two factors for this movement;
1) a general fear factor related to the health crisis as a broad driver of markets,
pushing a move to the safety of gold, and 2) a more direct driver being money printing
in reaction to the actual economic fallout from health crisis fears devaluing the US
dollar and thus driving up gold. We expect that both have played a significant role,
and that while the initial concerns over a resurgence in health crisis cases this week
has been predominantly a panic, 'sell-everything' phase, if these issues continue to
become exacerbated, they are likely to be a driver for gold, whether by fear or by
further monetary or fiscal stimulus. Given that new cases have started to move above
the gold price over the past month, if the correlation between gold and new cases
holds, we could see gold pick up, especially after the US election, with some gold
traders possibly holding back currently, awaiting the outcome next week.
The quite random relationship between gold and US elections
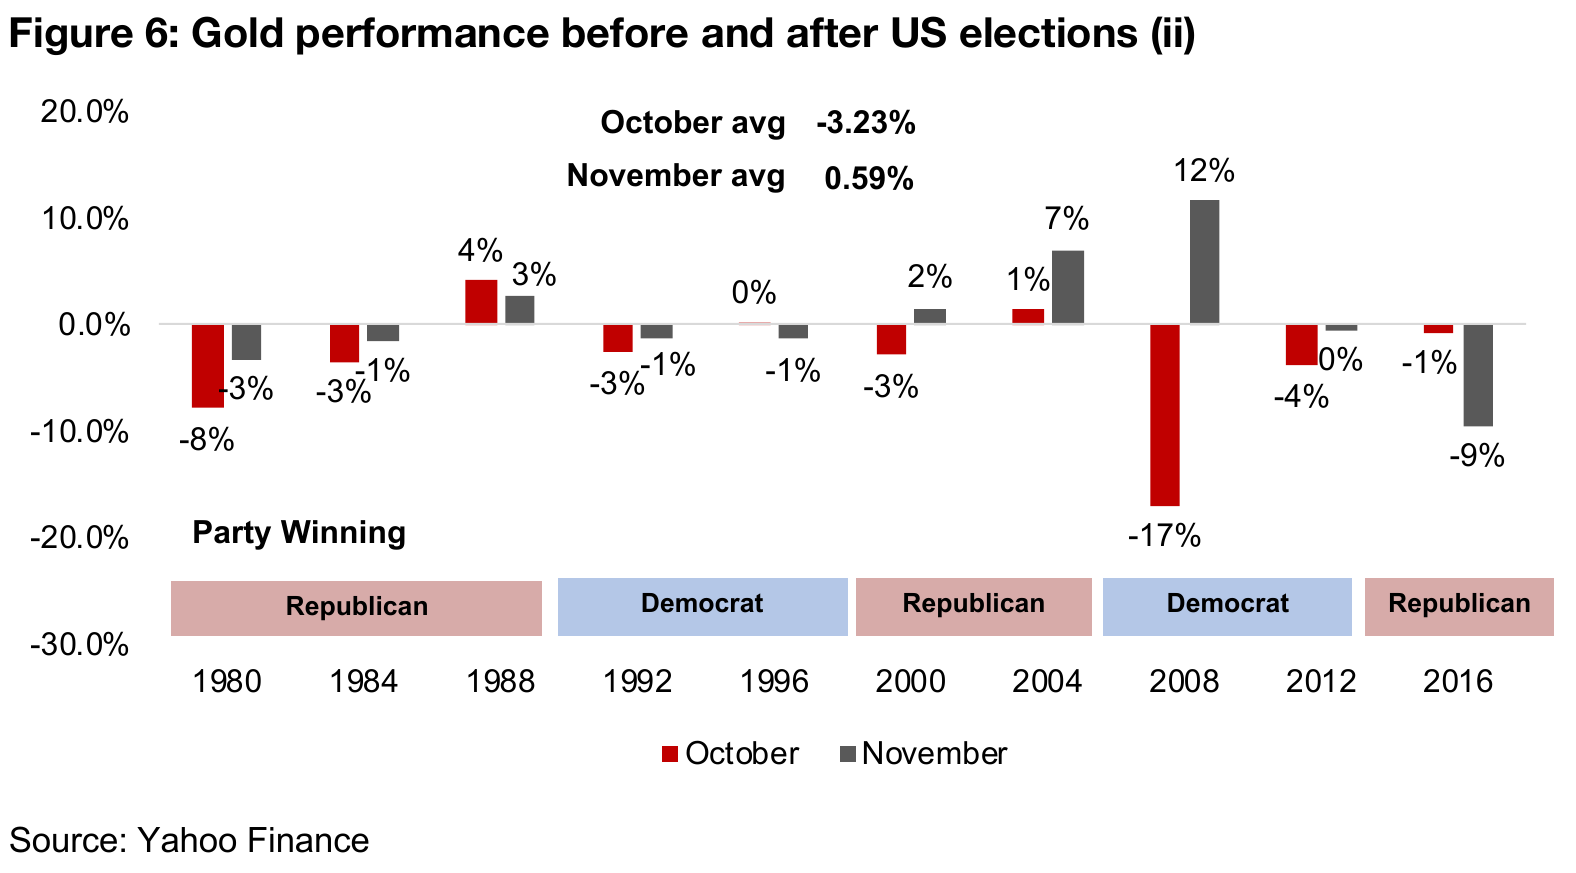
While the health crisis appears to have had strong effects on gold, whether directly or indirectly, there is also a potential driver for gold in the imminent US election. However, a look at the historical gold price movements from the 10 elections since the US went off the gold standard shows no consistent trend in terms of gold and US elections. With all US elections held in early November, we look specifically at the gold's performance in the run up to elections in October, and then through November and into December, which comprises the 66 days shown in our charts in Figure 5. The average performance in October leading into elections is a -3.2% decline, and the average in the month of November after an election is relatively flat, a 0.6% gain (Figure 6). However, when we look at details of each election, we see that this average is not very representative of the wide variations that actually play out, before and after the election, no matter the party or candidate.
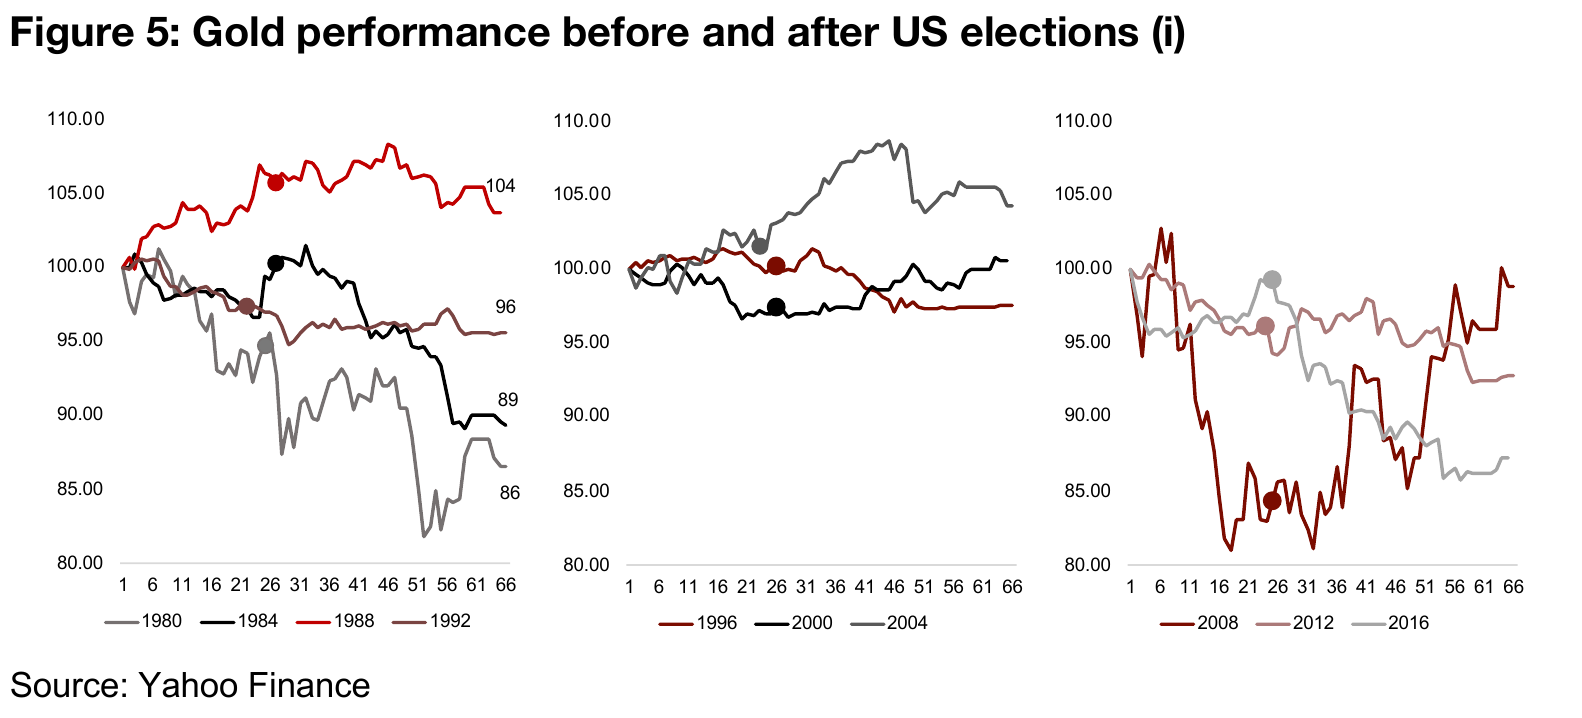
For Republicans, we see three election years where gold gained in November, and three where it declined. For Democrats, we two years of slight declines, one flat year, and one year of large gains in the month after the election. Also, even the same president being elected for a second term can have a completely different effect on gold than the first time they were elected. For example, G.W. Bush's election as US President has every different effects on gold in 2000 and 2004, as did Barack Obama's election in 2008 and 2012. We also see that candidates even from the same party can see very different reaction from gold, for example Reagan's two presidencies in 1980 and 1984 compared to H.W. Bush's election in 1988, with both being Republicans. In general, the US election, whatever the outcome, is historically not a great predictor of the performance of gold in the month prior to, or following, the election.
Producing miners with strong Q3/20 results offset gold decline
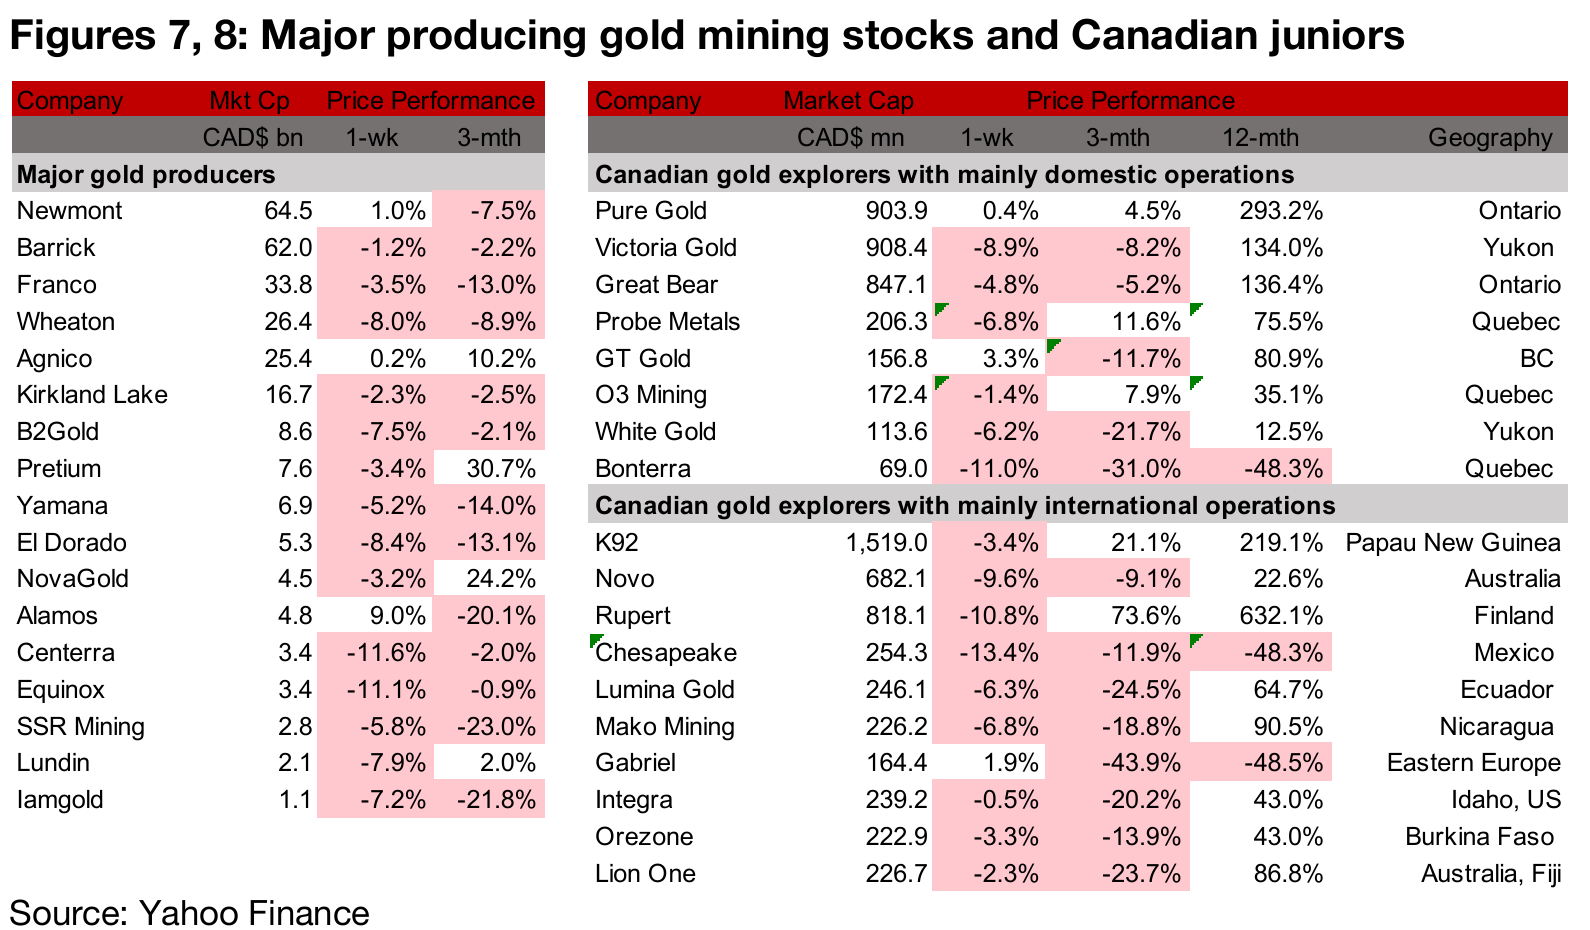
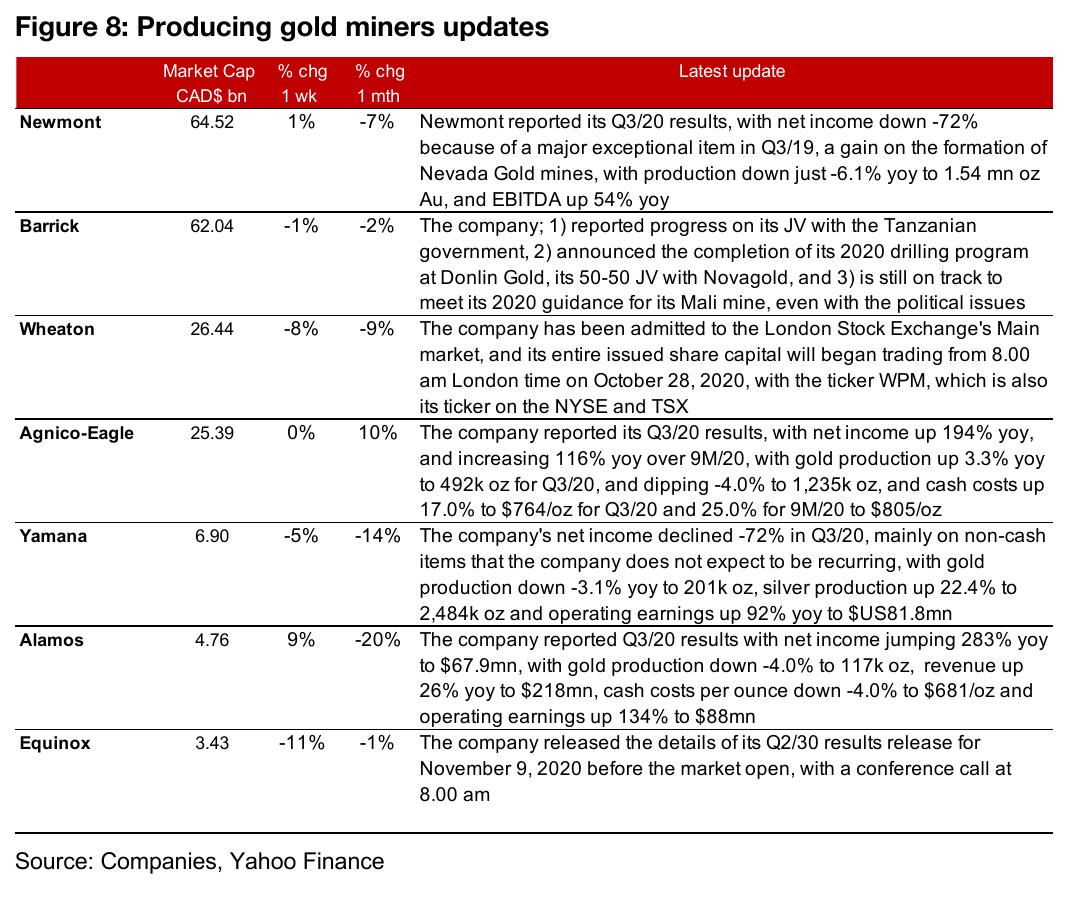
The producing miners mainly declined this week on the retracement in gold on rising concerns over the global health crisis (Figure 7). However, three out of four of the major gold producers that reported Q3/20 results this week resisted this trend, with Newmont up 1.0%, Agnico up 0.2% and Alamos gold seeing the strongest performance of all the producers, up 9.0%. Only Yamana declined of the Q3/20 reporters, with its Q3/20 net income down -72% yoy, mainly on what the company expects to be non-recurring items. Other news included three operational updates from Barrick on Tanzania, the Donlin mine and Mali, Wheaton's start of trading on the London Stock Exchange, and Equinox's Q3/20 results release details (Figure 8).
Canadian gold juniors operating domestically mainly decline
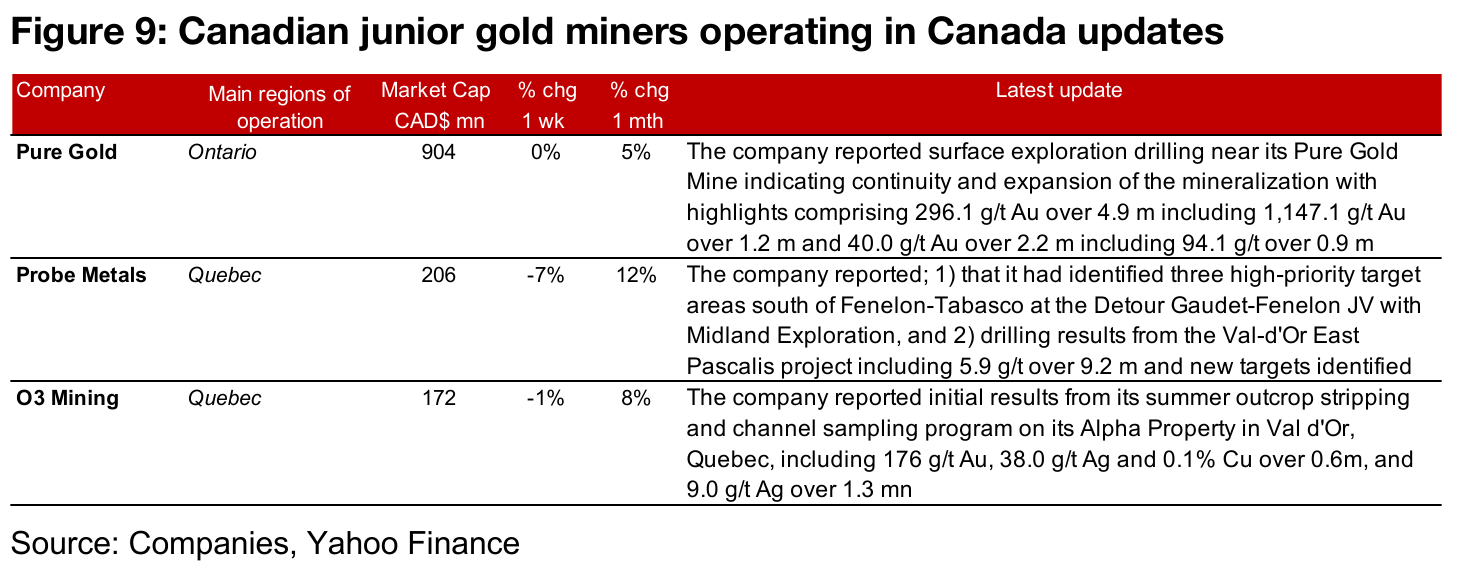
The Canadian juniors operating domestically mainly fell this week on the decline in the gold price (Figure 8). News flow included Pure Gold's drilling update, indicating continuity and expansion of the mineralization at its mine in Red Lake, Probe Metals identifying three new targets at its Detour Gaudet-Fenelon JV with Midland Exploration, and O3 Mining reporting results from its summer outcrop stripping and channel sampling program on its Alpha property at Val d`Or in Quebec (Figure 9).
Canadian gold juniors operating internationally mostly dip
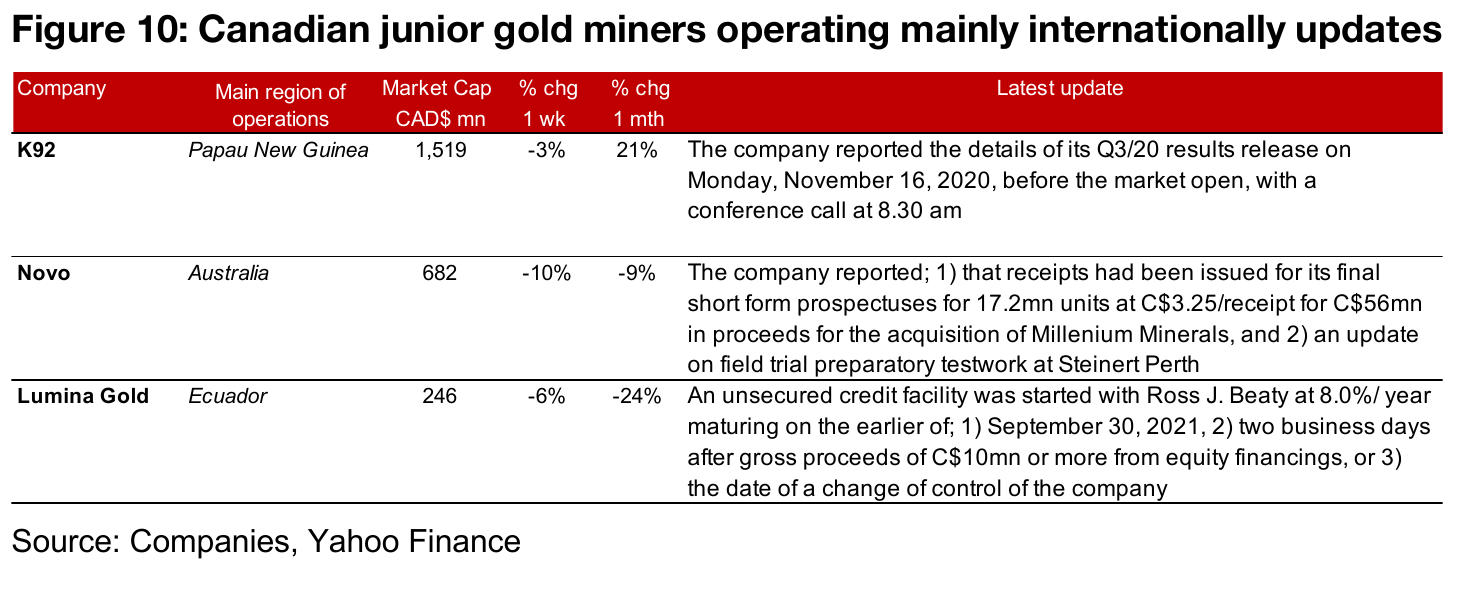
The Canadian juniors operating internationally were almost all down this week on the gold retracement, with only Gabriel Resources seeing a rise (Figure 8). New flows comprised K92 releasing the details of its upcoming Q3/20 results, Novo reporting on the issue of C$56mn in receipts related to its acquisition of Millenium Minerals, and an update on field trial preparatory testwork at one its projects, and Lumina Gold providing the details of an unsecured credit facility started with Ross J. Beaty (Figure 10).
In Focus: Dolly Varden Silver
Improved infrastructure in historically lucrative Golden Triangle
Dolly Varden Silver is exploring for high-grade silver, gold and base metals in British Columbia's Golden Triangle, which has seen exploration since the 1860s and was part of the late-1800s gold rushes, with large scale mines being developed as early as 1918. The Dolly Varden and North Star mines combined produced 1.3 mn oz Ag from 1919-1921 at an average grade of 1,109 g/t Ag, and the Torbrit Mine produced 18 mn oz Ag at 466.3 g/t Ag from 1949-1959. One of the more recent major projects was Eskay Creek, producing 3.3mn oz of gold and 160 mn oz of silver from 1994- 2008. Into the 2010s, the area saw declining interest on a combination of falling metals prices and limited infrastructure. However, there have been major infrastructure improvements in the region starting in 2012, including road, port and a electricity plants, which, combined with resurgent gold and silver prices over the past year, have greatly increased interest in exploration and development in the Golden Triangle (see our Overview of the Golden Triangle for more detail on this region).
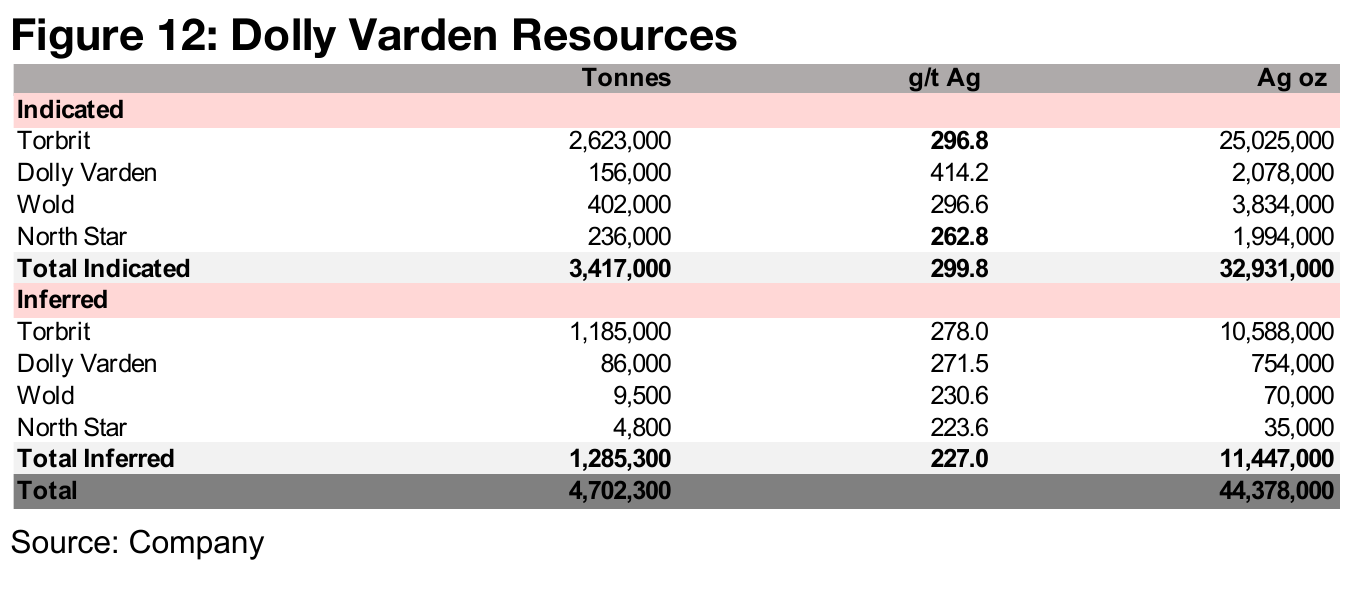
Dolly Varden has an estimated 44.4mn oz Ag in Resources
Dolly Varden is currently exploring its 100%-owned Dolly Varden Project, an 8,800 h.a. property with the production history noted above, and a current high-grade silver resource, with expansion potential and mineralized deposits within a 5 km radius. This comprises the Torbrit, Dolly Varden, Wold and North Star zones, for all of which Mineral Resource estimates are available as of May 8, 2019 (Figure 12). Torbrit has by far the largest estimated Resources, at 25.0 mn oz Ag Indicated and 10.6 mn oz Ag Inferred, or 76% of total Indicated and 92% of total Inferred Resources. The Dolly Varden zone comprises 2.1 mn ounces Ag Indicated and 0.7mn oz Ag Inferred, Wold, 3.8mn oz Ag Indicated and 0.07mn oz Ag Inferred, and North Star 1.9mn oz Ag Indicated and 0.04mn oz Ag Inferred. All four zones combined have 32.8mn oz Ag in Indicated and 11.5 mn oz Ag Inferred Resources, for a total 44.4mn oz Ag.
Exploration to expand resource ongoing since 2017
The company has drilled over 55,000 m across 174 holes at its projects since 2017, including decent results from an area north and outside of the current mineral resource from the 2019 exploration program, and preliminary metallurgical testing has yielded silver recovery rates of 87% at Torbit and 86% at Dolly Varden from bottle roll leach testing. Most recently the company began a 10,000 m discovery-focused and resource expansion drilling program on August 4, 2020, with the most recent announcement on October 7, 2020, highlighting silver assay results from initial step out drilling at Torbrit including 1,083 g/t Ag over 2.80 m within 351 g/t Ag over 12.75 mn, and infill holes to expand the existing mineral deposit, including 302 g/t Ag over 31.95m and 642 g/t Ag over 4.00 m.
Three financing rounds this year see backing from major shareholders
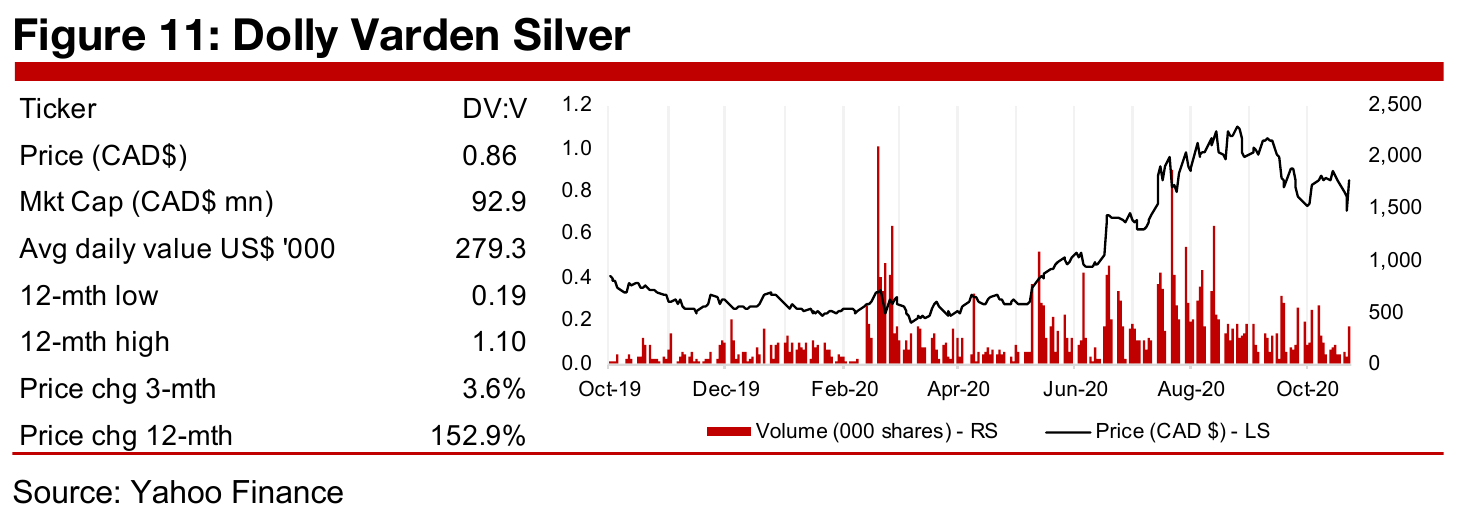
Dolly Varden has seen three financing rounds this year, with a $7.68mn private placement to Eric Sprott in June, 2020, another $10.00mn closed in August, 2020, of which Eric Sprott took 25%, raising his stake to an 19.1%, and $7.00 mn in a flow- through Private Placement in October, 2020. The company's other major shareholder is Hecla Canada, the largest primary silver producer in the US, with 11%, other institutional investors holding a combined 50%, and management and consultants holding 5%. The combination of the large existing resource, potential for the current program to expand the resource, the high silver price and high takeover potential given the presence of Hecla, has driven the share price up 152.9% over the past 12 12 months. Although the stock is off its peak of CAD$1.10/share, this is in line with a general pullback in the silver price and silver juniors over the past two months.
Disclaimer: This report is for informational use only and should not be used an alternative to the financial and legal advice of a qualified professional in business planning and investment. We do not represent that forecasts in this report will lead to a specific outcome or result, and are not liable in the event of any business action taken in whole or in part as a result of the contents of this report.


