September 09, 2024
Gold Stocks Pull Ahead of Tech
Author - Ben McGregor
Gold holds up in another market reversal
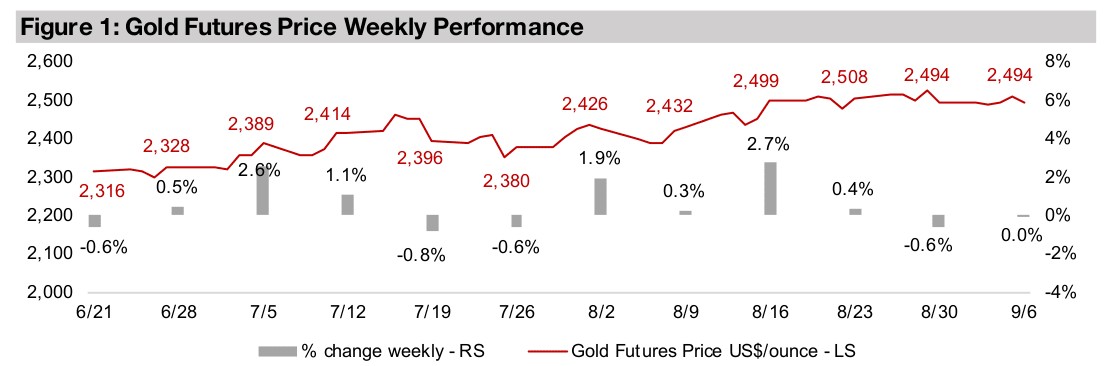
Gold held flat at US$2,494/oz as equity markets plunged for the second time in just a month, with the immediate catalyst weaker than expected U.S. jobs data, but more broadly because the issues causing the first crash were far from resolved.
Gold stocks hit by plunging equities markets
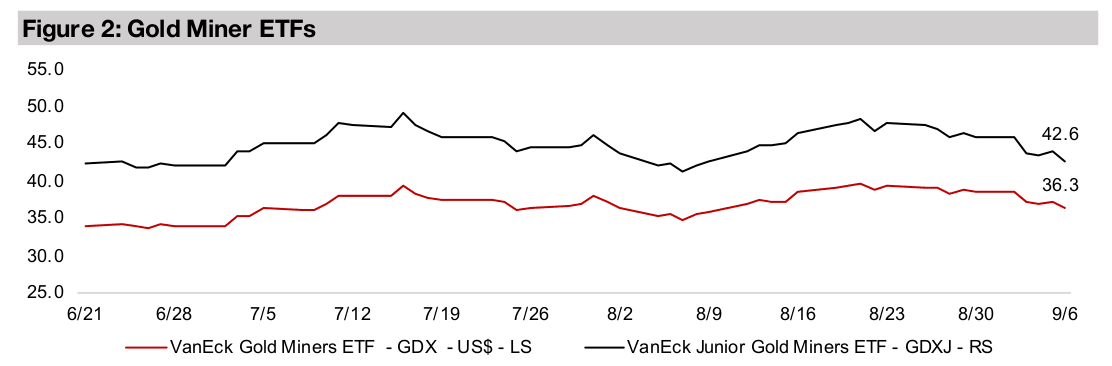
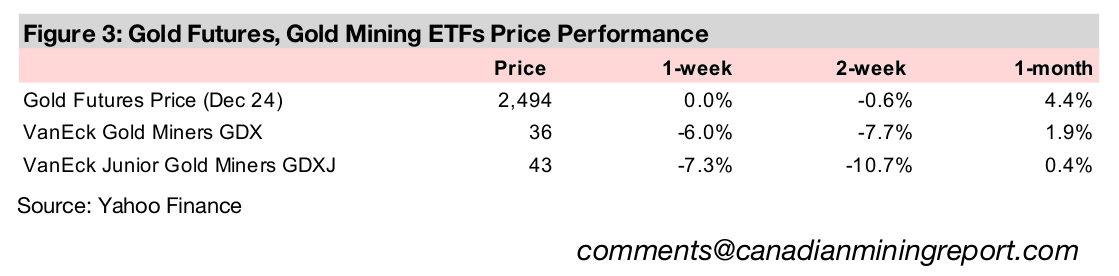
Gold stocks were hit hard by the plunge in equities, with the S&P 500 slumping -3.6%, the Nasdaq off -5.4% and Russell 2000 down -5.3%, which offset the resilience in the gold price and pulled down the GDX by -6.0% and GDXJ by -7.3%.


Gold Stocks Pull Ahead of Tech
Gold was flat at US$2,494/oz even as equities markets plunged, delivering on its safe-
haven promise, with the S&P 500 dropping -3.6%, the Nasdaq slumping -5.4% and
Russell 2000 index declining -5.3%. The immediate driver of the crash was an August
2024 US jobs reports which came in under expectations, while the data from the prior
two months was revised downwards. However, there were more fundamental issues
precipitating this decline, including high interest rates and equity valuations and
inflation still above the targets of the Fed and the European Central Bank.
These same issues also set the stage for the market crash early last month, and while
there was an abrupt recovery from this dive, we had remained wary of the rebound,
as none of the core underlying problems had been resolved. This caution has proved
warranted in retrospect as the markets have now given up a large part of the post-
crash gains. While the markets could continue to remain a bit bearish near-term, we
believe that more big moves could be put on hold until early November 2024, given
the Fed meeting and U.S. election results in the first week of the month.
Clear indications of an imminent rate cut by the Fed seems to have been the main
driver of the turn around from the previous crash, with it to finally follow suit with the
other major central banks that have already started cuts. However, even a 50-bps cut
would leave US rates high, and other central banks have cut only gradually as no
global recession has developed and the spectre of reigniting inflation still looms large.
Central banks could continue only moderate cuts until there are clear signs of faltering
global growth, but by this point such a recession could already be dragging down
corporate earnings and offsetting the upside from lower rates for the stock market.
The shift into safety was not over
Both the short-term drivers in November and longer-term problems outlined above
will likely keep investors cautious for the rest of the year, at least, especially in light
of two major crashes in only a month. This week’s crash showed that the broader
shift that we have seen this year towards safer assets was not over, with the return
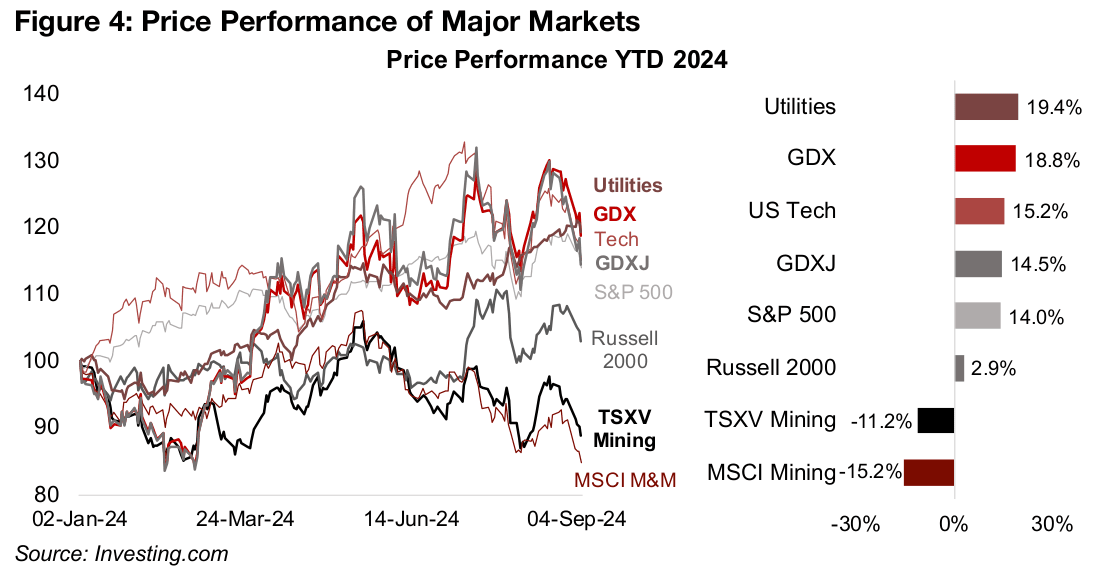
to risk in August proving brief. The year to date performance of the major markets
and sectors shows this preference for safer assets clearly, with the gold stocks up
18.8%, surpassed only by utilities, rising 19.4% (Figure 4).
For the first time this year, we have seen both these sectors definitively move ahead
of tech, which is up 15.2% year to date. This is a huge shift, as until even just a month
ago, it seemed that these safer sectors, while seeing strong gains in 2024, still could
not get above tech even after being on the verge of doing so several times. Also, it is
interesting that the gold juniors have nearly caught up with tech, with the GDXJ ETF
up 14.5%, even given that they are in a small cap sector which has been under
pressure this year, with the Russell 2000 index gaining just 2.9%.
The gold stocks have also done well even as the mining sector overall has struggled,
with the MSCI Metals and Mining ETF down -15.2%, as it has a high proportion of its
performance being driven by stocks with large exposures to a weak iron ore price.
The gold stocks have also significantly outperformed the TSXV Mining Index, which
while having limited iron ore exposure and a high weighting to gold stocks, also has
a large proportion of lithium stocks, with the metal facing a major decline this year.
Monetary-driven precious metals outperform major base metals
This split in the performance of gold and the other major metals seems to be a
reflection of stagflationary economic expectations by the market currently. The
metals mainly driven by monetary factors, gold and silver, are up 21% and 17%,
respectively, year to date, implying the market expects them to be boosted by a
period of global money expansion (Figure 5). This contrasts with the weaker
performance of the two major metals that are bellwethers of the global industrial cycle,
copper, up just 4%, and aluminum, which is flat. This implies that the expected
increase in the money supply may not translate into strong underlying economic
growth. While a monetary expansion does tend to promote industrial growth, there
are precedents of high inflation and low growth in the mid-1970s and early 1980s.
The other metals are not such broad economic indicators and most have smaller
markets. While tin is driven by industrial, not monetary factors, it is been tied with
gold for best performer, up 21%, given supply constraints in its tiny market. Platinum
and palladium, down -6% and 17%, respectively, are heavily driven by their use in
autocatalysts, and an auto sector slowdown led to lower prices. The two biggest
underperformers, iron ore and lithium, down -22% and -33%, respectively, are driven
by China, with large supply and demand exposure in the country.
Gold stock ETFs far outperforming other major metal ETFs
The strong gold price this year has seen gold stocks outperform other metals stocks, with the GDX up 18.8% and GDXJ up 14.5% (Figure 6). However, it is notable that gold stocks declined during both the recent crashes, indicating that there is still risk that even a resilient gold price can be offset by broader equity market pressures. Silver stocks have not performed as well as might be expected given the 17% rise in the metal price, with the SIL ETF of silver producers rising just 8.7%. The 3.7% gain in the COPX ETF of copper producers has been inline with the 4.0% rise in copper.
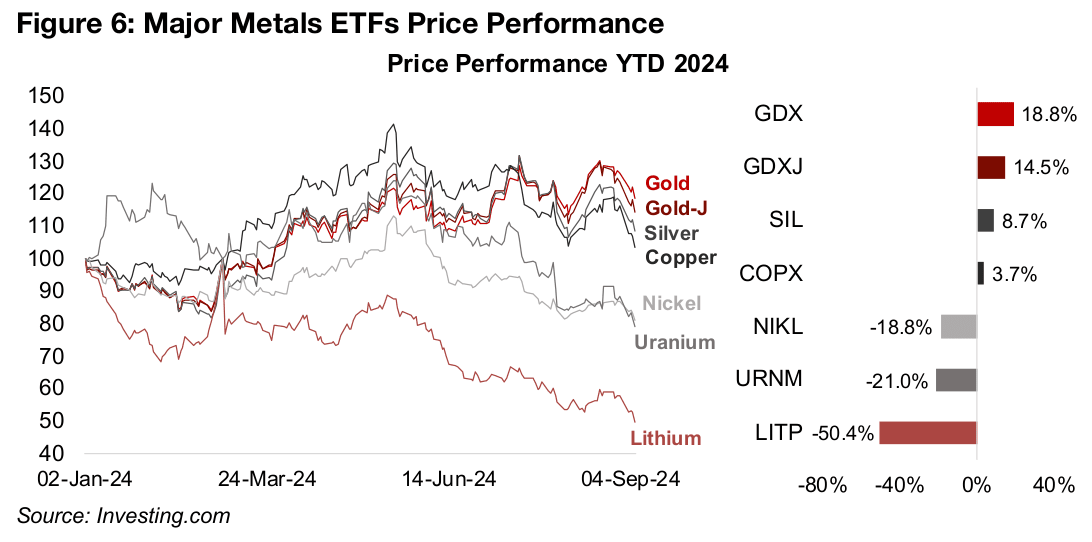
Even considering the effect of downward leverage on metals stocks from a decline in the underlying metal price, the -18.8% drop in the NILK ETF of nickel producers seems excessive versus only a -4.0% drop in nickel. Where negative leverage seems to have had the most effect is for the URNM ETF of uranium producers, down -21% versus a -13% decline in uranium, and LITP ETF of lithium producers, with its -50% decline more than double the -22% decline in the lithium price.
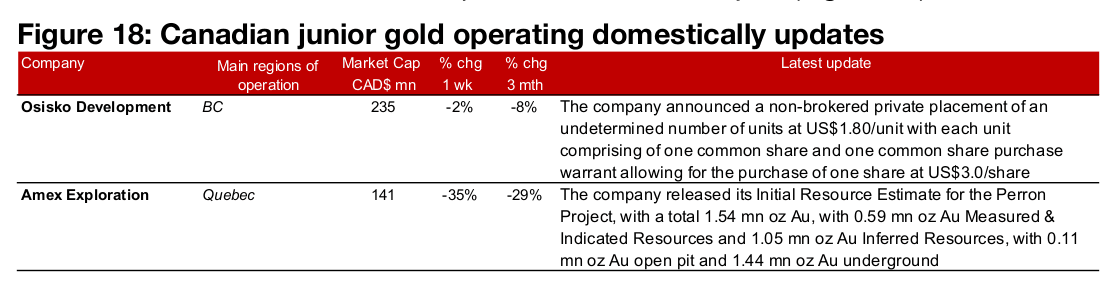
Amex Exploration Resource Estimate underwhelms markets
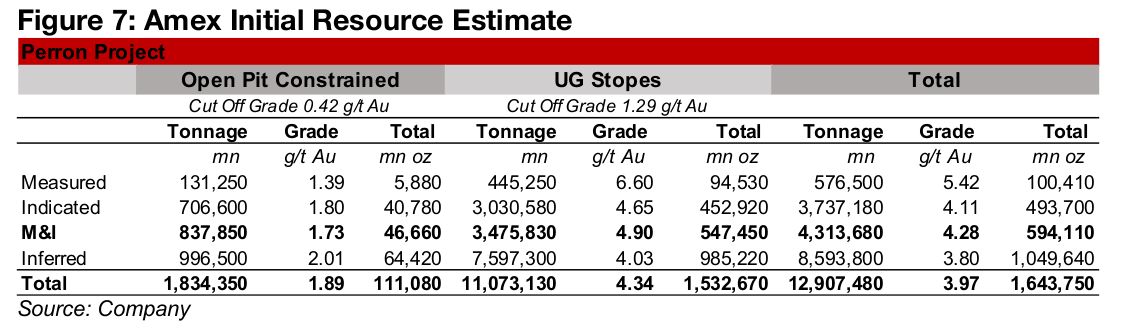
Amex Exploration released its Initial Resource Estimate for its Perron project in the Abitibi region of Quebec, with a total 1.64 mn oz Au, with 0.59 mn oz Au in Measured and Indicated and 1.05 mn in Inferred Resources (Figure 7). A small proportion of the project is open pit, at 0.11 mn oz with the majority, or 1.53mn oz, underground. The announcement had been long awaited, with Amex one of the rare TSXV gold companies persistently at the top of the sector in terms of market cap but without a Resource Estimate. Many pre-Resource Estimate companies near the top of the TSXV gold in terms of market cap from 2020 to 2022 had declined in the rankings as the market shifted towards more risk aversion in 2023, and this has carried over into 2024, with more advanced projects generally being more supported by the market.
The market was clearly underwhelmed by the Resource Estimate, with Amex’s stock plunging 34.6% this week on the news (Figures 8, 9). However, this still left the stock within the group of larger TSXV gold developers, although at the bottom, with a CAD$141mn market cap. The stock is also still down just -4% year to date after the severe drop, as it had previously seen strong gains through the year and had not been severely hit by the crash in early August 2024.
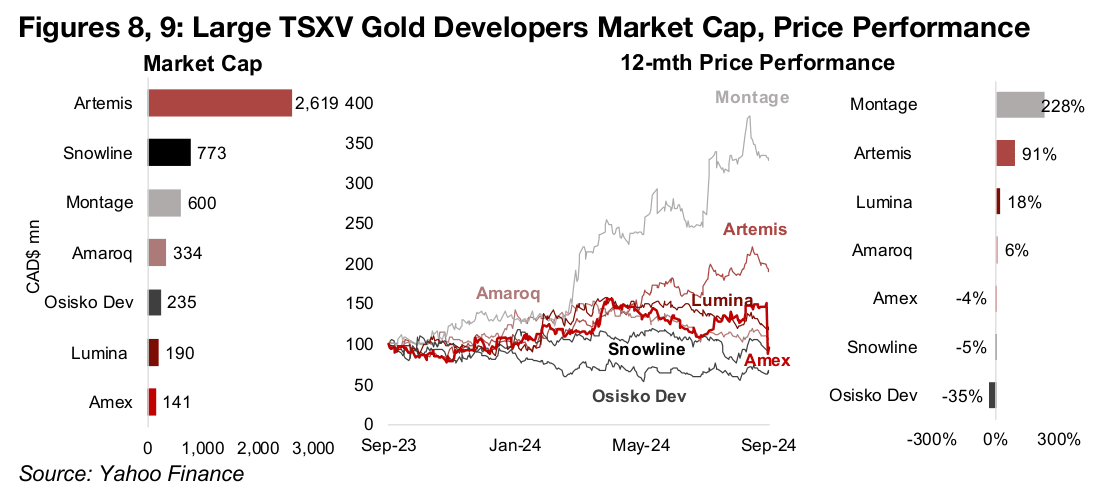
While the near flat performance this year puts it behind outperformers like Montage and Artemis, both have been driven by major company specific developments. Montage was granted a mining permit for its Kone Project in Cote D’Ivoire and closed a C$180mn private placement including investment by the Lundin Group, while Artemis is on the verge of production at its large Blackwater project in B.C. Amex’s performance year to date is roughly inline with Snowline Gold, another company which released its Initial Resource Estimate this year, in June for its Rogue Project in the Yukon. This appears to have been more inline with market expectations than Amex’s Resource, with limited share price movement on the news. Amex’s near flat performance this year has also significantly outperformed the -35% decline in Osisko Development.
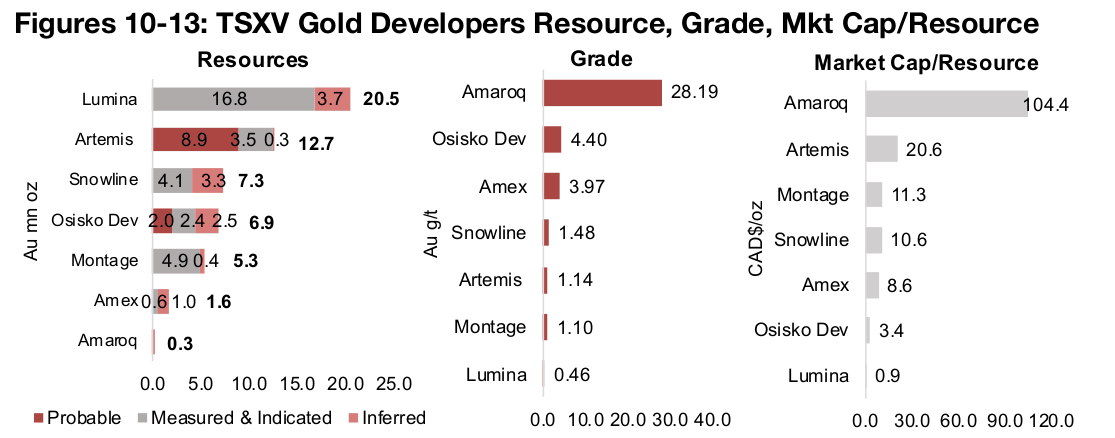
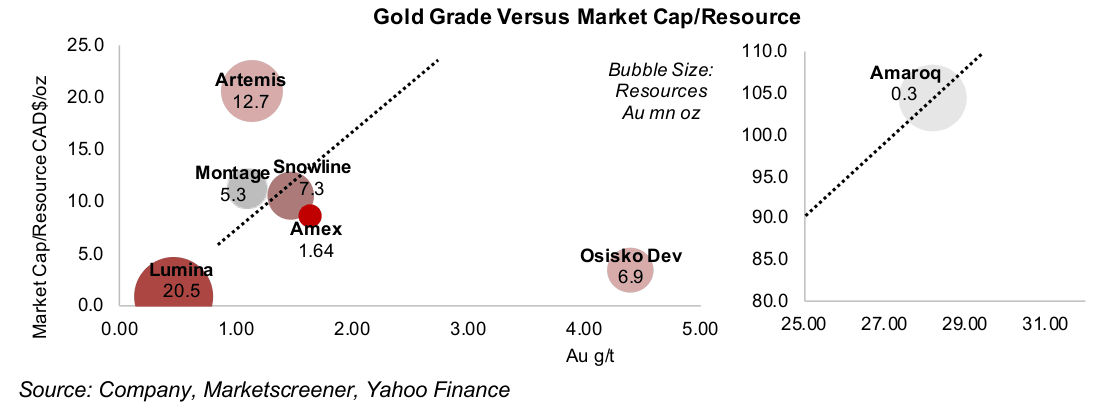
Amex’s Perron Project Resource Estimate of 1.6 mn oz Au puts it near the bottom of
the larger TSXV gold developers in terms of size, above only Amaroq’s tiny Nalunaq
project with just 0.3 mn oz Au (Figure 10). However, Perron’s grade is very high, with
3.97 g/t Au putting it third below Amaorq with 28.19 g/t Au and Osisko Development’s
4.40 g/t Au, with the rest having grades below 1.50 g/t Au (Figure 11). This has seen
Amex’s Market Cap/Resource maintained near the middle of the group, at
CAD$8.6/oz even after the major share price decline, above Osisko Development and
Lumina (Figure 12).
The trendline from plotting the project grades versus the companies’ Market
Cap/Resource provides a basic valuation indicator with stocks above or below the
line tending towards overvaluation or undervaluation, respectively (Figure 13). While
this spread can be partly explained cost differentials, this information is not available
for Perron, which has not reached the PEA stage. There are only two major
divergences from this line, for Artemis and Osisko Development, suggesting
reasonable relative valuations for the group based on grade.
Artemis is well above the line likely because of its very advanced stage and large
resource, while Osisko Development well below the line compared to what might be
expected given by its high grade, and because of this we have actually excluded it
from the trendline calculation. After adjusting the scale of the chart to include Amaroq
given its very high grade and therefore higher Market Cap/Resource, it still trades
quite closely to the trendline.
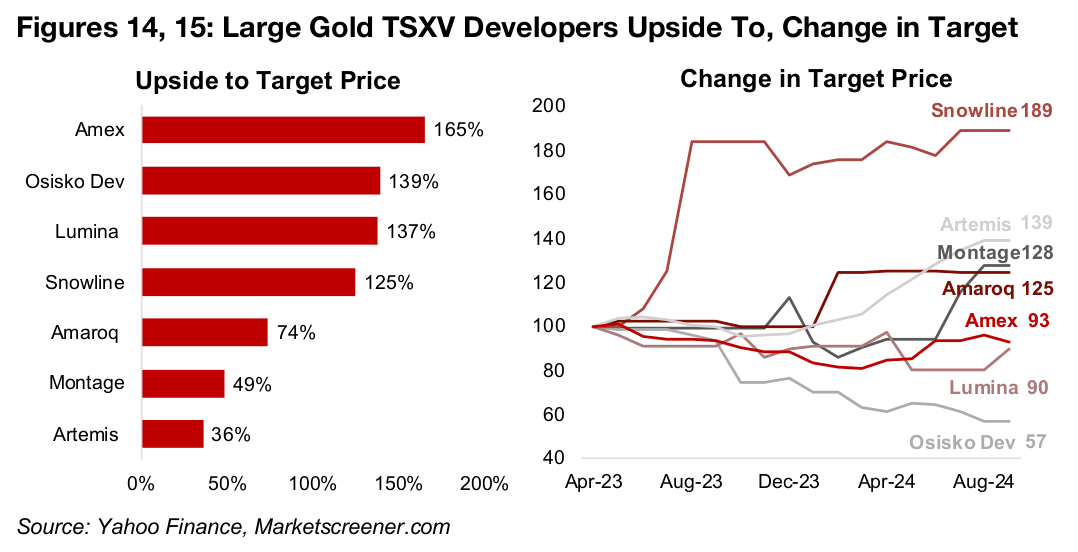
While there had been a moderate increase in target price for Amex in mid-2024, there
was still an overall downgrade of about 7% since April 2023 (Figures 14, 15). The
news of the Resource and the clear market disappointment regarding it could bring
about some downgrades to the target price of the company. However, Amex
currently has 165% upside to its target price, by far the highest of the large TSXV
gold developers, implying that even if there are major potential downgrades there
could still be substantial upside to the company’s target price.
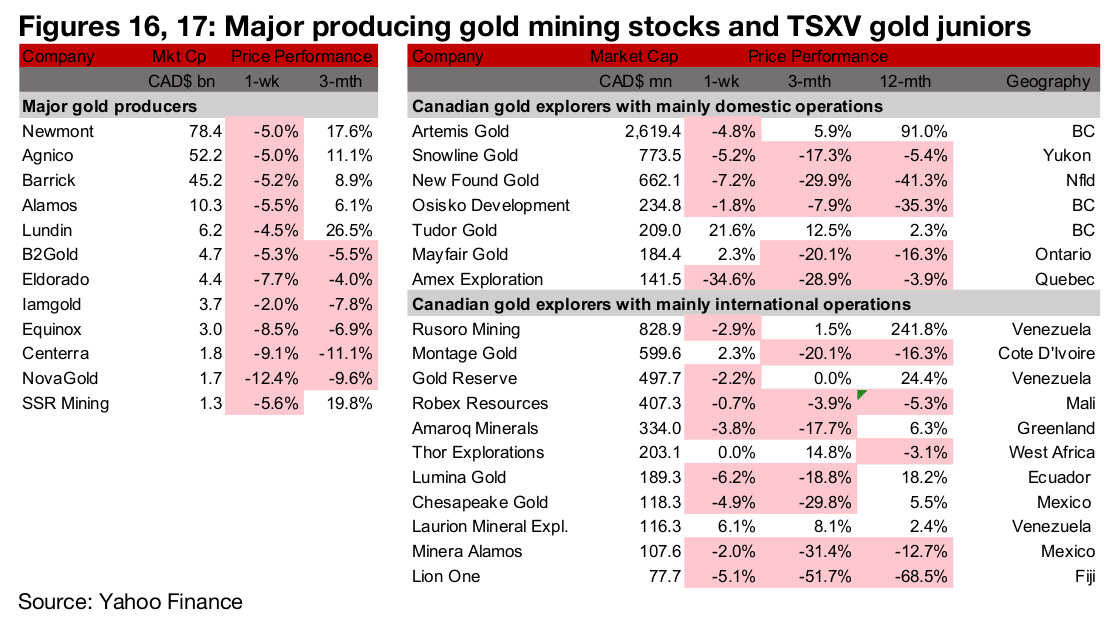
All the large producers and most TSXV gold decline
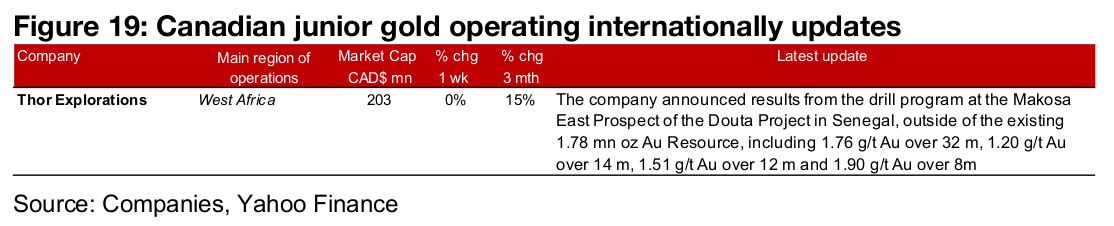
All of the large gold producers and most of the TSXV gold stocks declined (Figures 16, 17). For the TSXV gold companies operating domestically, Osisko Development announced a private placement of an undisclosed number of units at US$1.80/unit and Amex Exploration released its Initial Resource Estimate for Perron (Figure 18). For the TSXV gold companies operating internationally, the company reported drill results from the Mokosa East Prospect of the Douta Project (Figure 19).
Disclaimer: This report is for informational use only and should not be used an alternative to the financial and legal advice of a qualified professional in business planning and investment. We do not represent that forecasts in this report will lead to a specific outcome or result, and are not liable in the event of any business action taken in whole or in part as a result of the contents of this report.