April 08, 2024
Gold Stock Valuations Still Low
Author - Ben McGregor
Gold’s ramp up continues even after inflationary data
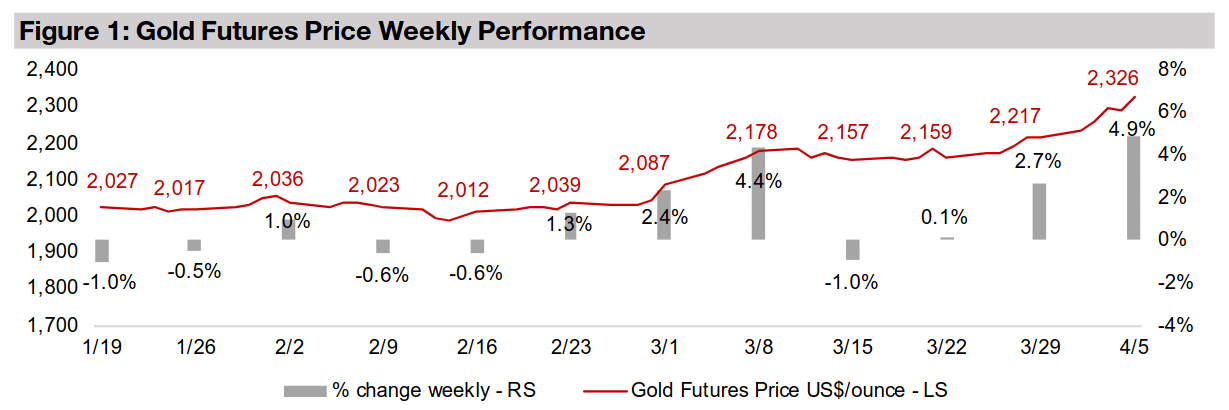
The explosion in the gold price continued, with it reaching another all-time high of US$2,326/oz, as rising geopolitical risks offset downside pressure from an inflationary looking US jobs report, rising oil price and hawkish comments from the Fed.
Gold stock valuations remain low even after price surge
With the surge in gold stocks continuing in early April after huge gains in March, this week we look at valuations of the large gold producers to see if they are starting to get lofty, but have found that they actually remain at relatively low levels.


Gold Stock Valuations Still Low
Gold jumped 4.9% this week to US$2,326/oz, yet again hitting new all-time highs and
adding nearly US$300/oz in six weeks. The rise came even with quite inflationary
economic data including a strong US jobs report that trounced expectations and a
jump in the oil price to over US$85/bbl, its highest since October 2023. The metal
also shrugged off hawkish comments from US Fed officials pushing back on the
chance of substantial rate cuts this year. The main driver of the jump in oil, rising
geopolitical tensions, was also likely the major factor bolstering gold.
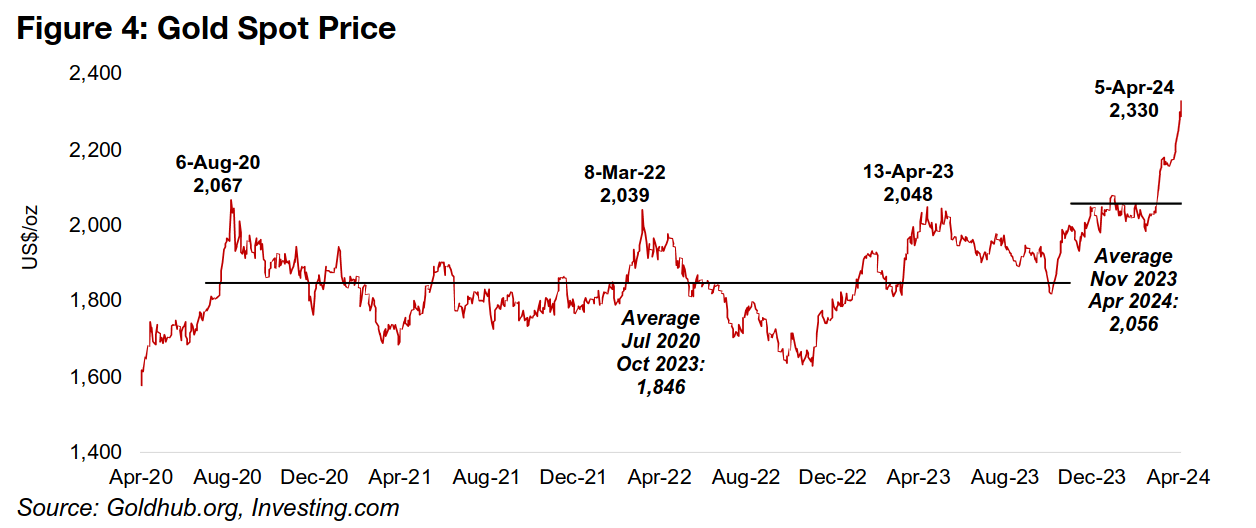
The abrupt gain in gold has seen a parabolic rise develop of a magnitude not seen
since mid-2020, and the metal seems to have finally definitively broken away from
the stubborn average of US$1,846/oz from July 2020 to October 2023 (Figure 4).
While the average from November 2023 to April 2024 has been US$2,056/oz, we
suspect that the gold price still has substantial room to rise, and that it could
eventually settle at an average considerably higher than that of the past six months.
Gold stock valuations remain low even after price surge
Last week we looked at several fundamental comparisons for the gold price which indicated it could have much further to run. The gold ratio versus silver, copper, the global money supply, oil and the broader commodities index overall were near the averages since 2021 and did not suggest severe over or under valuation of the metal. However, with most of these metrics still far off their highs, it implies continued positive sentiment on gold could see the metal rise substantially before entering historically frothy territory. Given the even more aggressive run up in gold equities over the past month, this week we turn to stock valuations for the sector to see if multiples are getting excessive. In contrast to the more balanced ratios for the metal itself, gold stock valuations still look low, implying significant room for gains if gold remains high and the recent improvement in sentiment for the sector is sustained.
GDX and GDXJ still lagging gold price after major recent gains
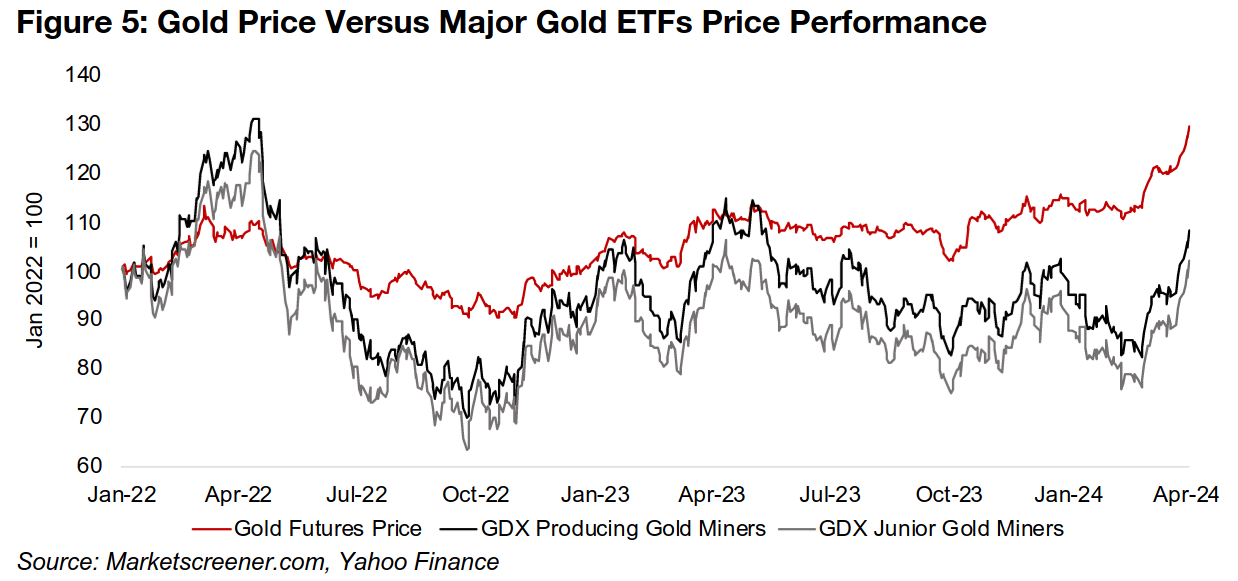
That the gold stocks continue to lag the gold price can be seen in the relative
performance of the GDX ETF of gold producers and GDXJ ETF of junior gold miners
versus the metal (Figure 5). The gap consistently widened for nearly a year from
around April 2023 to February 2024 as the gold price held up but the stocks slumped.
This was a period where a multiyear rise in megacap tech stocks entered a euphoric
stage and safe-havens were generally eschewed. However, this seems to have finally
shifted significantly in March 2024, with the gradual rise in gold that started as early
as October 2023 becoming a major breakout.
At the same time tech valuations had become so excessive that the boom in that
sector started to falter, and with it such a major driver of overall US market gains, it
raised concerns that it could drag down the entire market. This had already seen the
market starting to turn more seriously towards risk hedges, and the additional catalyst
for the sector of a spike in geopolitical risk suddenly made the gap between the gold
price and gold stocks too much to ignore.
While the severe jump in gold stocks over the past month has seen them close the
gap with the metal price to a degree, there is still considerable room for this trend to
continue. With gold stocks heavily leveraged to the gold price, we would expect them
to outperform given such strong gains in the metal, as occurred in early 2022.
However, gold stocks still have yet to get back even with the gold price, let alone rise
substantially above the metal. This suggests that there may still be plenty of room for
gold equities to continue rising, which is supported by relatively low current valuations
for the sector. These multiples could also come down even further as consensus
estimates still do not yet seem to be factoring in a much higher average gold price.
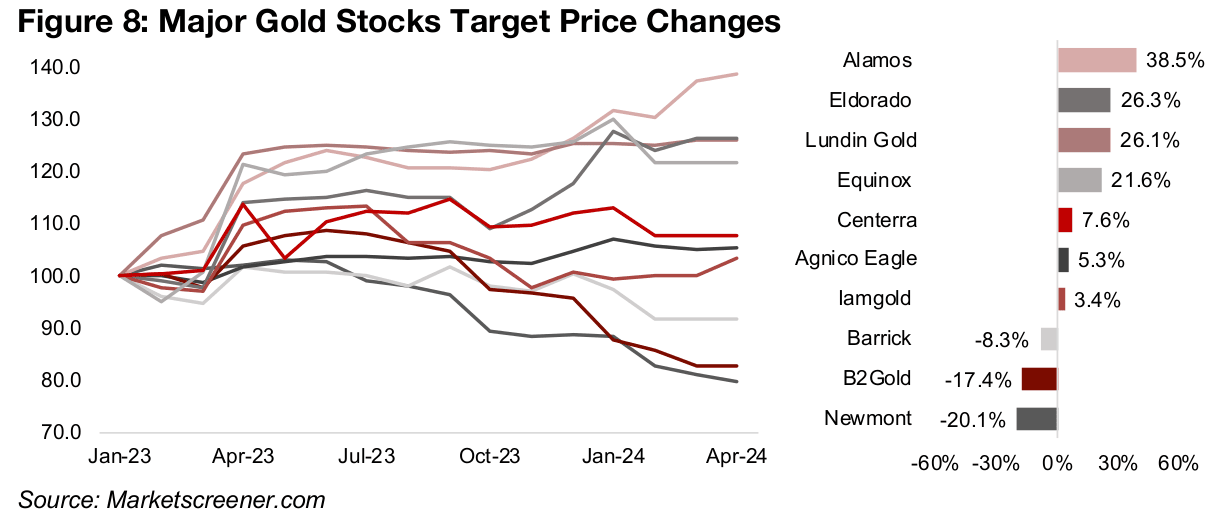
Gold stock targets have not seen recent major upgrades overall
The upside to target prices gives us some indication of how much further the market
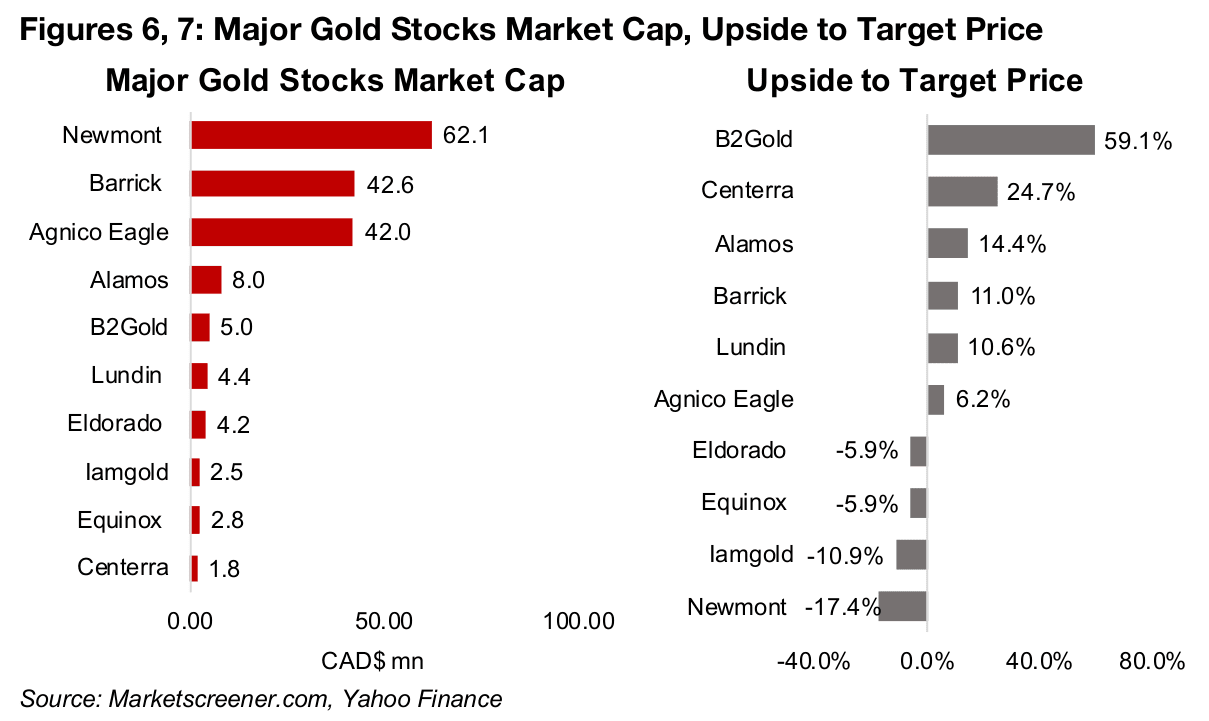
currently expects the gold stock rebound to run. The recent gains have actually seen
a number of the largest market cap gold stocks get above their targets, with a slight
downside for Eldorado, Equinox, Iamgold and Newmont (Figures 6, 7). However,
more than half the group have from moderate to substantial upside to their targets.
We suspect that recent gold and gold stock price moves will have ‘overwhelmed’
current price targets, with it usually taking a few weeks for analysts to incorporate
new information like the higher gold price and make upgrades. It is also important to
consider that sentiment on the sector has been negative for some time, and while this
has obviously started to reverse in March 2024, it may take time before consensus
targets reflect this.
There does seem to be substantial room still for target price upgrades, as most of the major changes to the current estimates were made as far back as early 2023. The targets have been mainly flat, or declining, since, with the only major exceptions having been upgrades to Alamos’ target price so far this year and Eldorado’s in late 2023 (Figure 8). Overall there is a strong balance between upgrades and downgrades, suggesting that they are based on company specific fundamentals, and certainly do not imply an across the board increase in the gold prices being factored into these targets.
Shift towards bullish sentiment on gold sector just starting
Being just on the cusp of a big shift away from a sustained period of negative
sentiment on a given sector can be an extremely good place to be from an investment
stand point. A lot of potential bad news and risk has already been incorporated into
share prices and estimates actually become too low as analysts capitulate and
effectively price in that a sector will never exit its current doldrums. This negative
sentiment also pulls down valuations, which are measures of the market’s
expectations for future growth.
This contrasts with a sector in a long bull run, where consistently rising earnings drive
expectations this will continue indefinitely and pushes up multiples. This can spiral
up into a euphoria, like that recently seen in tech, where estimates get far too high
and increasingly difficult to meet, let alone surpass, and multiples price in a very long
period of high growth. In contrast, a sector like the gold producers currently, where
valuations and multiples appear too low, allows much more room for upside surprises,
such as that seen over the past month.
The prolonged negative sentiment on gold producers and tech mono-focus had likely
clouded the market’s outlook on the gold sector, driving it to hold off on pricing in the
higher metal price. However, the market seems to have finally come to accept this
shift to a higher sustainable gold price and incorporate it into gold stocks.
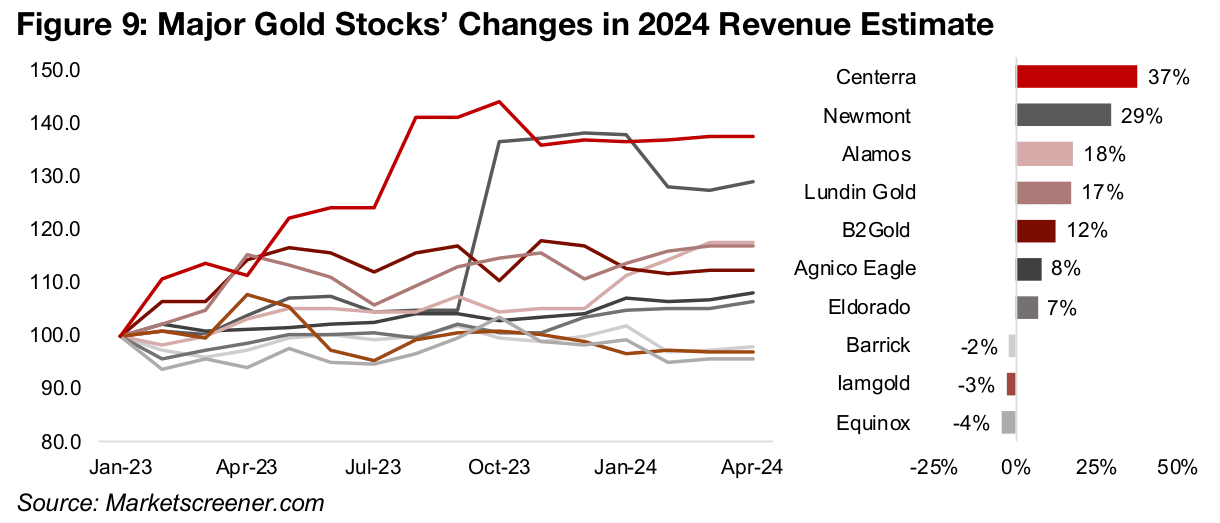
Revenue estimates for gold stocks have remained relatively flat
Revenue estimate revisions over the past year suggest that analysts have not fully
priced in a much higher new average for the gold price yet. The more stable factor in
these estimates is production, which tends to change only slowly, and for which clear
guidance is provided by the companies. This leaves the gold price assumption as the
wild card for revenue estimates, because it is much more volatile.
Most of the 2024 revenue revisions for the gold producers occurred in early 2023
(Figure 9), and there have only been a few standout upgrades, for Centerra through
mid-2023, for Newmont in late 2023 and Alamos Gold in early 2024. The rest of the
forecasts have not moved much and do not imply a big upgrade to gold prices. Given
our expectation that gold can maintain at least the US$2,056/oz average so far this
year, and likely much higher, it seems that revenue estimates for all these companies
could still rise, implying that current revenue multiples may be understated.
Gold sector revenue and income high for 2024, but multiples still low
The broader trend for revenue and net income for the sector for 2024E remain bullish, even given limited recent upgrades to estimates. Figures 10 and 11 use an aggregate of top three largest gold stocks, Newmont, Barrick and Agnico Eagle, which comprise the majority of the market cap and production of gold globally, as a proxy for sector.
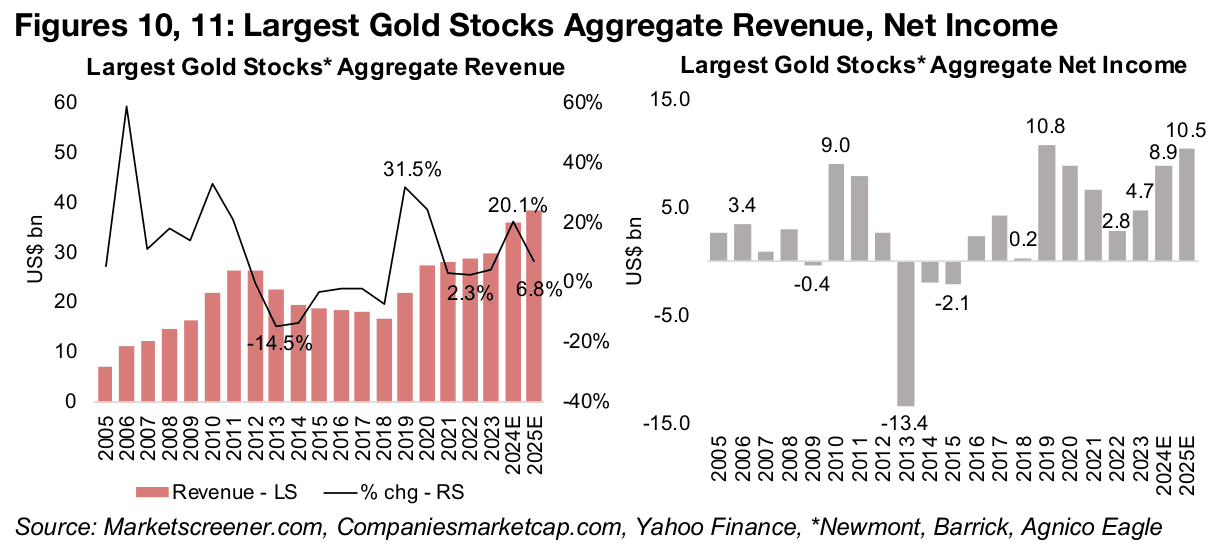
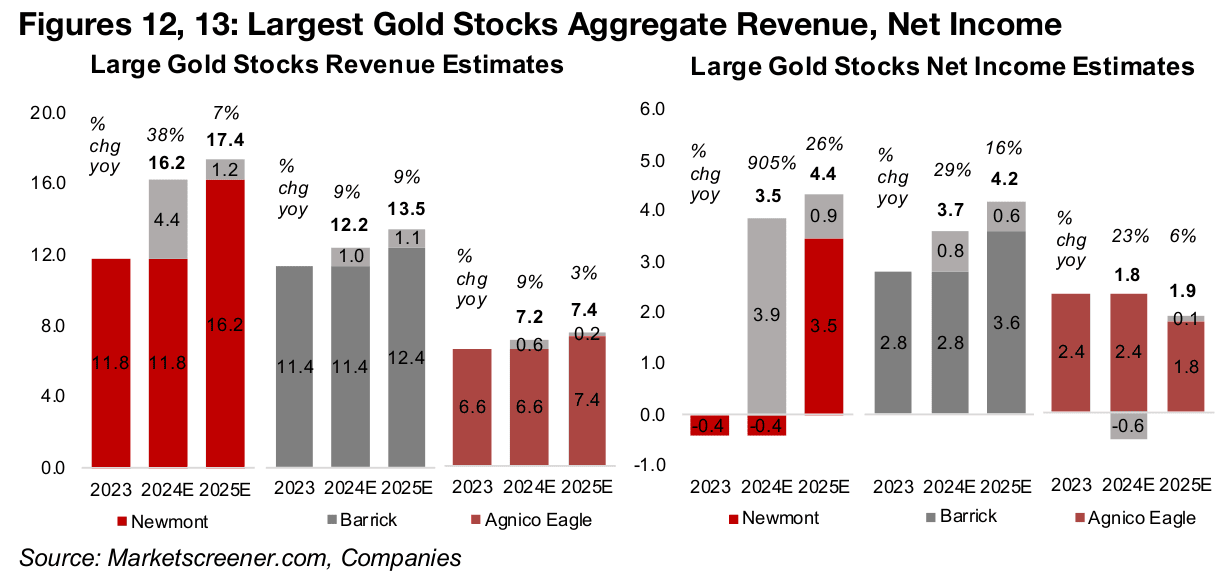
The aggregate revenue for these three is expected increase 20.1% to US$36bn and net income to nearly double to US$8.9bn in 2024E. However, most of the revenue growth is expected to come from Newmont, with Barrick and Agnico Eagle rising only single digits (Figure 12). This further suggests that a strong rise in gold has yet to be priced into the sector. Newmont is also expected to drive net income as the company is forecast to return to profitability after a marginal loss in 2023 (Figure 13).
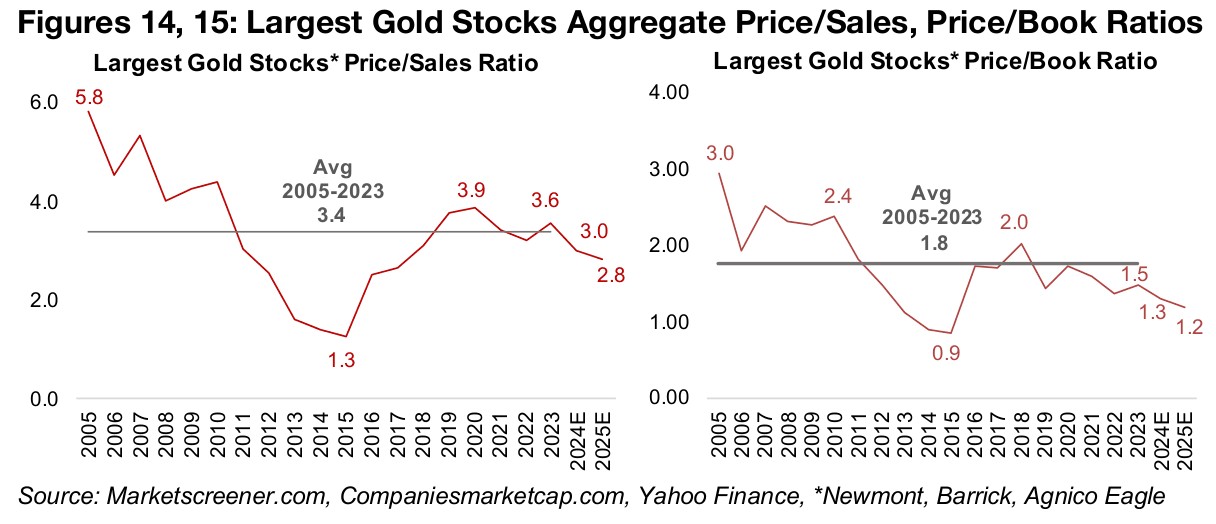
This substantial growth in 2024E has not translated to rising multiples for the group, with price to sales dropping to 3.0x in 2024E from 3.6x in 2023, a recent 3.9x peak in 2020, and a twenty-year high of 5.8x high in 2004 (Figure 14). The price to book (P/B) multiple is also forecast to decline to 1.3x in 2024E from 1.5x in 2023, and to 1.2x for 2025E, with 1.0x generally considered inexpensive for non-distressed companies (Figure 15). Overall the multiples do not indicate the market anywhere near euphoria regarding the sector.
Most of the major producers and TSXV gold stocks rise
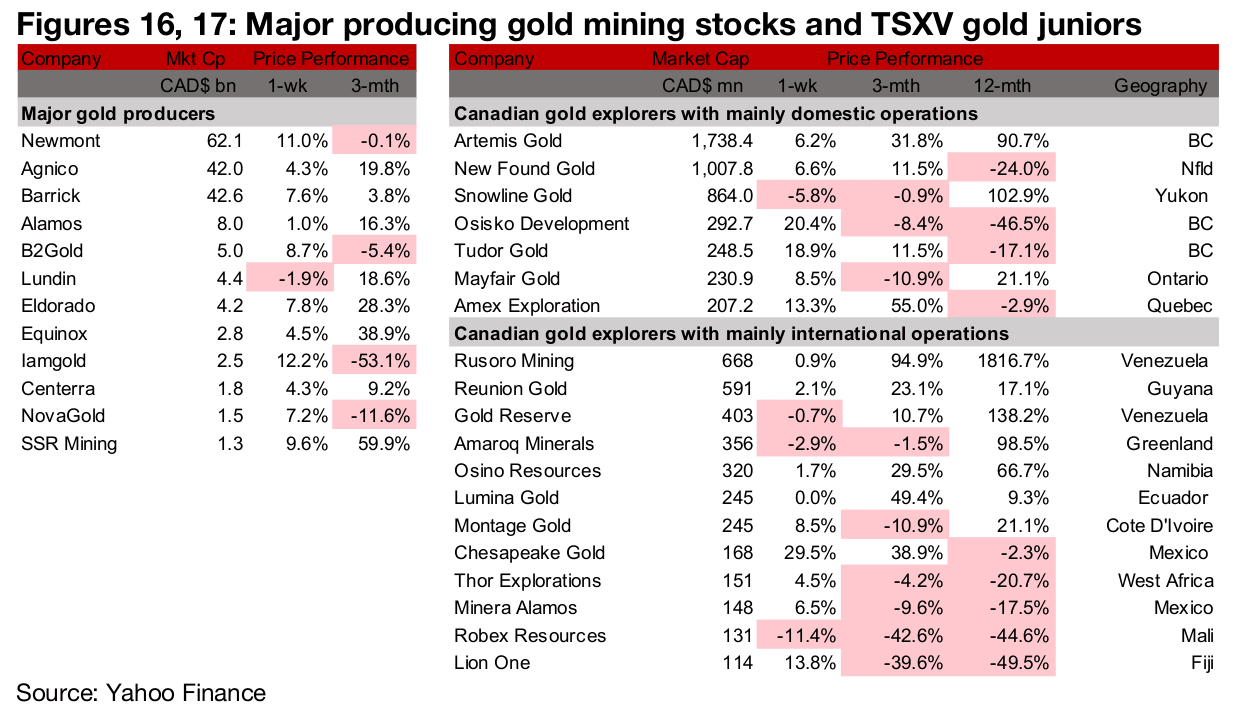
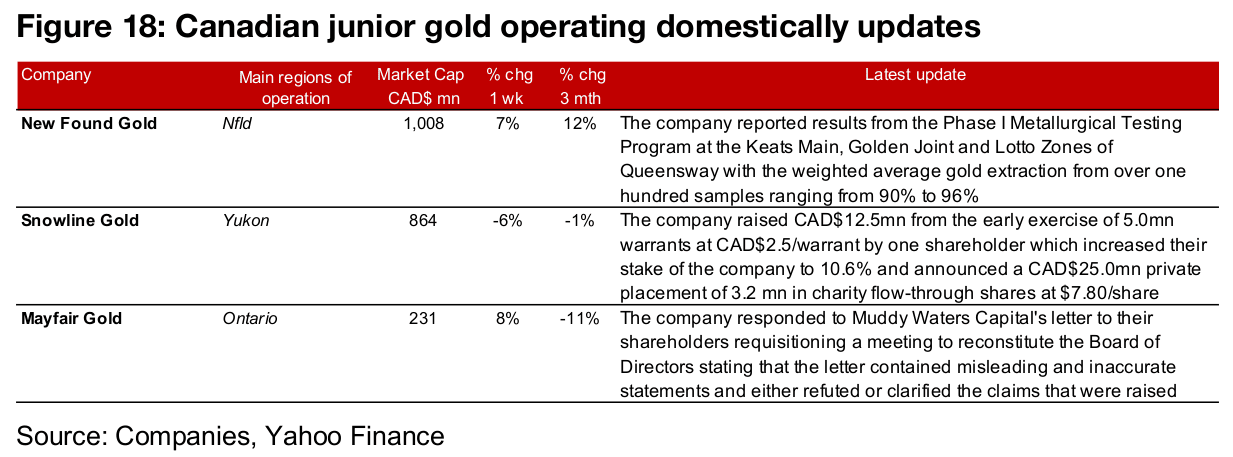
The large producers all rose except for Lundin Gold and most of the TSXV larger gold stocks gained (Figures 16, 17). For the TSXV gold companies operating domestically, New Found Gold reported results from Phase I Metallurgical Testing at Queensway, Snowline Gold raised CAD$12.5mn from early warrant exercise and announced a CAD$25.0 private placement and Mayfair Gold responded to a letter to shareholders from Muddy Waters Capital (Figure 18). For the TSXV gold companies operating internationally, Amaroq announced its first underground mining blast at Nalunaq and Thor acquired two properties near its Douta project (Figure 19).

Disclaimer: This report is for informational use only and should not be used an alternative to the financial and legal advice of a qualified professional in business planning and investment. We do not represent that forecasts in this report will lead to a specific outcome or result, and are not liable in the event of any business action taken in whole or in part as a result of the contents of this report.


