October 15, 2021
Gold's demand and supply factors
Author - Ben McGregor
Gold rises abruptly on Fed's very gradual taper plan
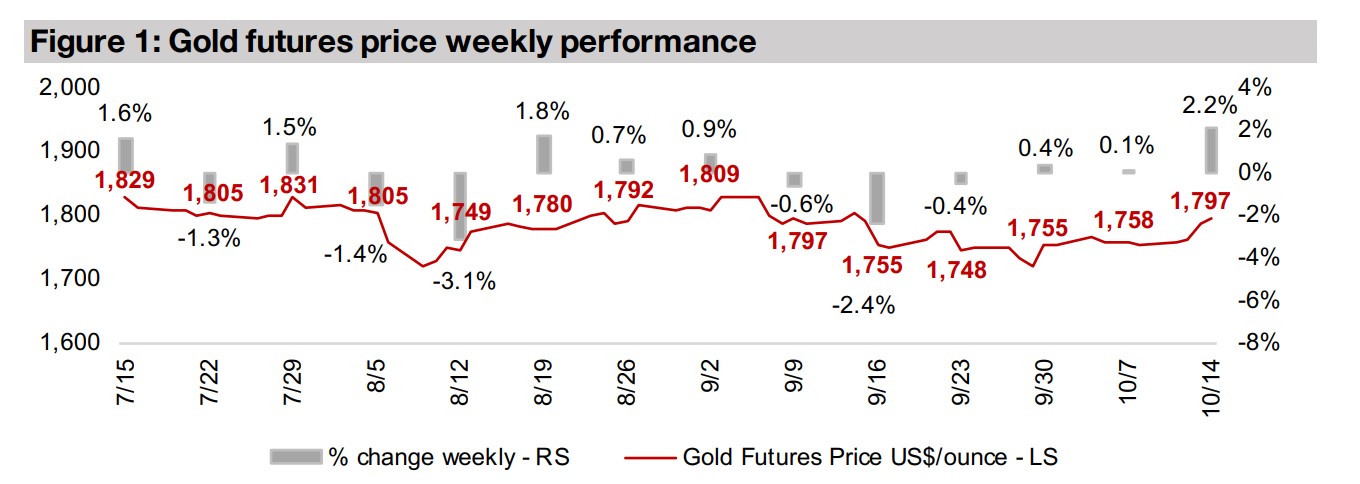
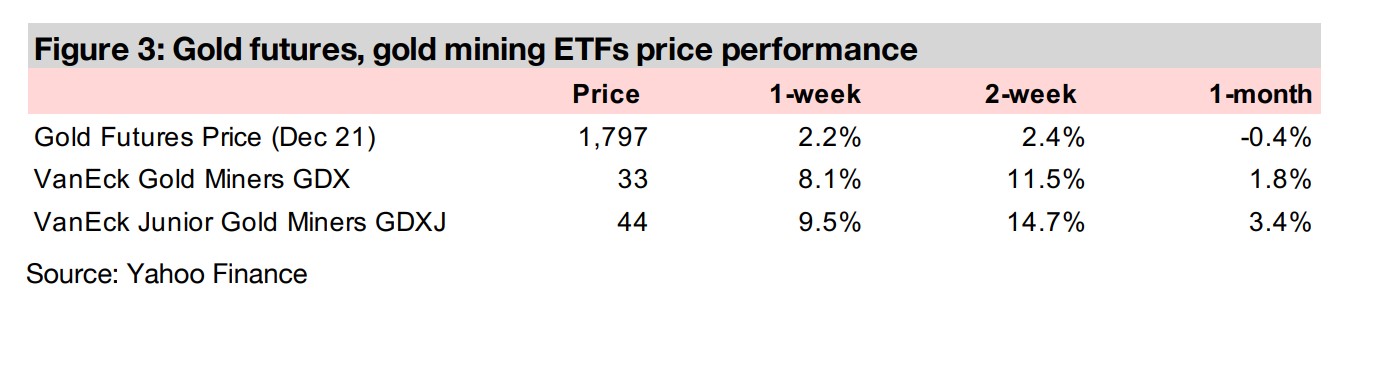
The gold priced jumped suddenly at the end of the week, rising 2.2% to US$1,797/oz, as the market seemed to be pricing in rising risk, with bond yields falling, inflation continuing at high levels, and the Fed indicating only a very gradual taper.
Considering gold's demand and supply factors
This week we look at the underlying demand and supply factors for gold, most of which we view as having a reasonably marginal effect on the gold price compared to the crucial driver really underlying many of these factors, monetary expansion.
Producers and juniors jump on gold price rise
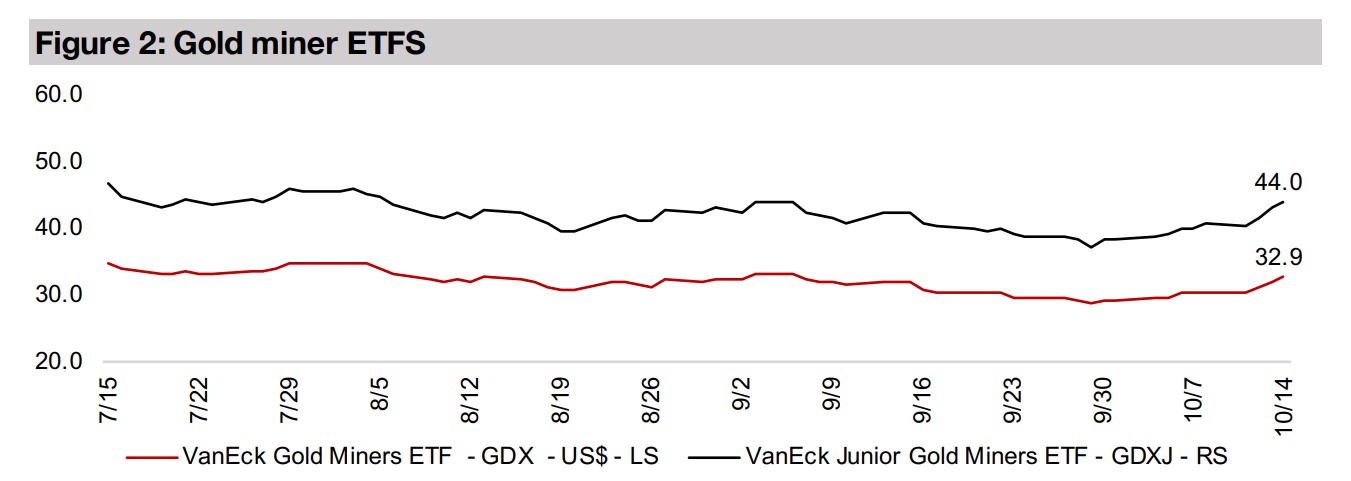
The producers and juniors jumped the most in months, with the GDX up 8.1%, GDXJ up 9.5% and the Canadian juniors surged, with many up over 10.0%, as investors moved into gold on the Fed indicating its upcoming taper would be only gradual.


Major gold demand and supply factors
Gold jumped suddenly at the end of week, up 2.2% to US$1,797/oz, after remaining
flat around the US$1,750/oz level for most of the week, as the market seemed to be
pricing in rising risks and giving less weight to bullish outcomes, as inflation continues
to run hot and there are signs that global economic growth may be easing, which
could mean a shift to stagflation in the coming quarters. The most recent major news
before the move in gold was the Fed's announcement that it could start to taper its
stimulus by mid-November 2021, but only very gradually, and perhaps the market
had been expecting something more aggressive.
This led to a decline in bond yields, and shift into gold by investors, who may have
become concerned that a limited reduction in stimulus could mean high inflation
persisting longer than expected. The Fed's announcement, however, was really just
the catalyst after recent data indicated that inflation did appear to be getting out of
control. This included continued high US inflation for September, rising wages and
falling unemployment in the recent US jobs report, and surging oil, gas, and other
commodities prices.
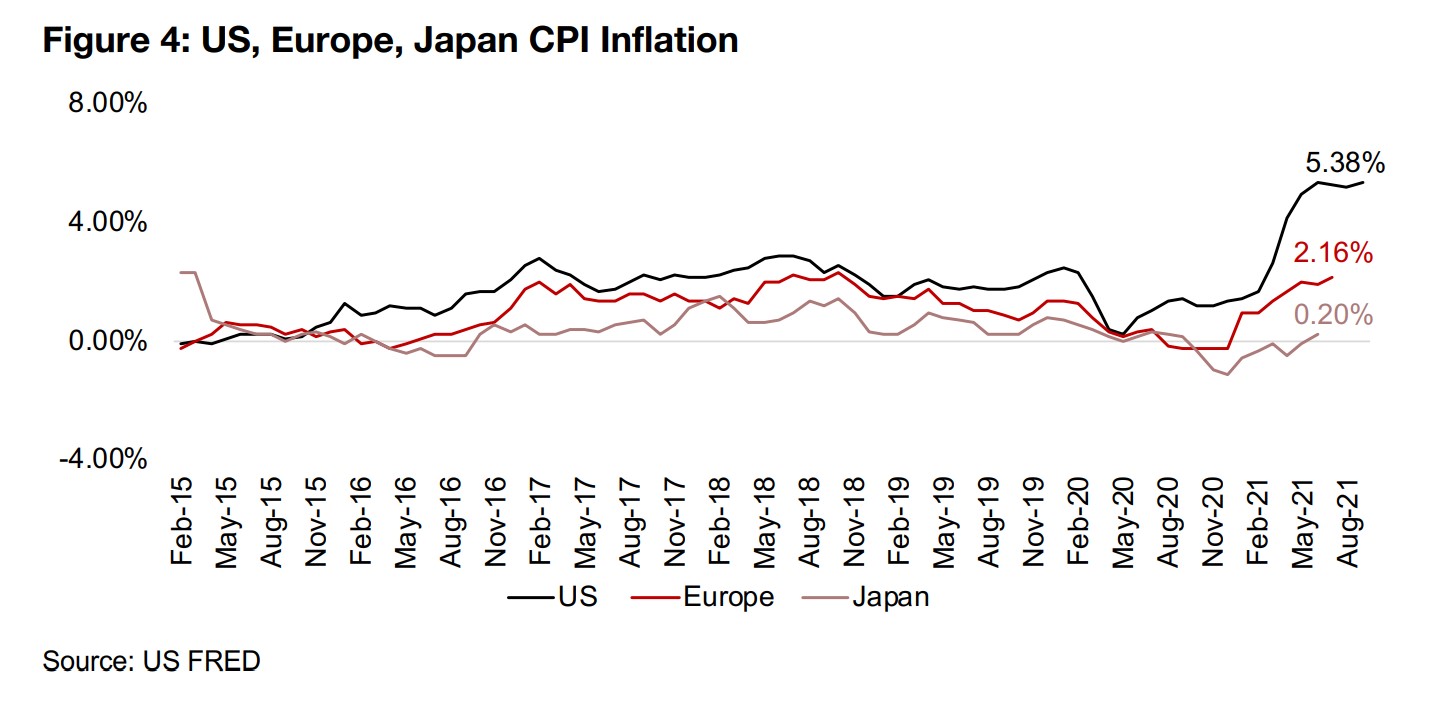
While inflation is still running hot, the rise has flattened for now, after jumping from a
low at 0.2% in May 2020 to above 5.0% by June 2021, and averaging 5.30% through
to September, when it reached 5.38%, well above the Fed's target for 2.0% (Figure
4). This slowing ascent could be viewed by the Fed as backing up their idea that
recent inflation is only transitory, and a result of a pent-up demand from the global
health crisis, and should ease in the coming months. This would in turn warrant the
less than aggressive taper they have outlined to start in mid-November. Nonetheless,
with the September inflation the highest in years, and above expectations, we believe
that inflation may remain persistently high, and this should support gold.
The recent US jobs reports included some data that also pointed to rising inflation,
and perhaps of a more concerning variety than the jump in many commodities prices
we have seen over the past year, which could conceivably subside as supply chains
return to normal. The issue shown in the US jobs report is a potentially insidious one,
a wage-price spiral. This occurs when consumer prices start to pickup, workers then
demand higher wages to maintain their standard of living, forcing firms to further
boost prices to maintain profitability, further driving up the cost of living, and workers
then demand even higher wages. The spiral does not end until workers are convinced
that inflation will truly be brought under control, which only tends to happen with a
severe monetary tightening and a likely recession.
Adding to this theoretical spiral are supply side distortions unique to this cycle from
reactions to the global health crisis, including; 1) stimulus payments that are
disincentivizing many workers from seeking employment, 2) various shutdowns that
are preventing many who would otherwise be working from doing so, and 3) massive
monetary stimulus flooding the market which tends to drive up consumer prices, and
we have a potential tinderbox for quite extreme inflation, especially if we see a less
than aggressive reduction of the stimulus by the Fed.
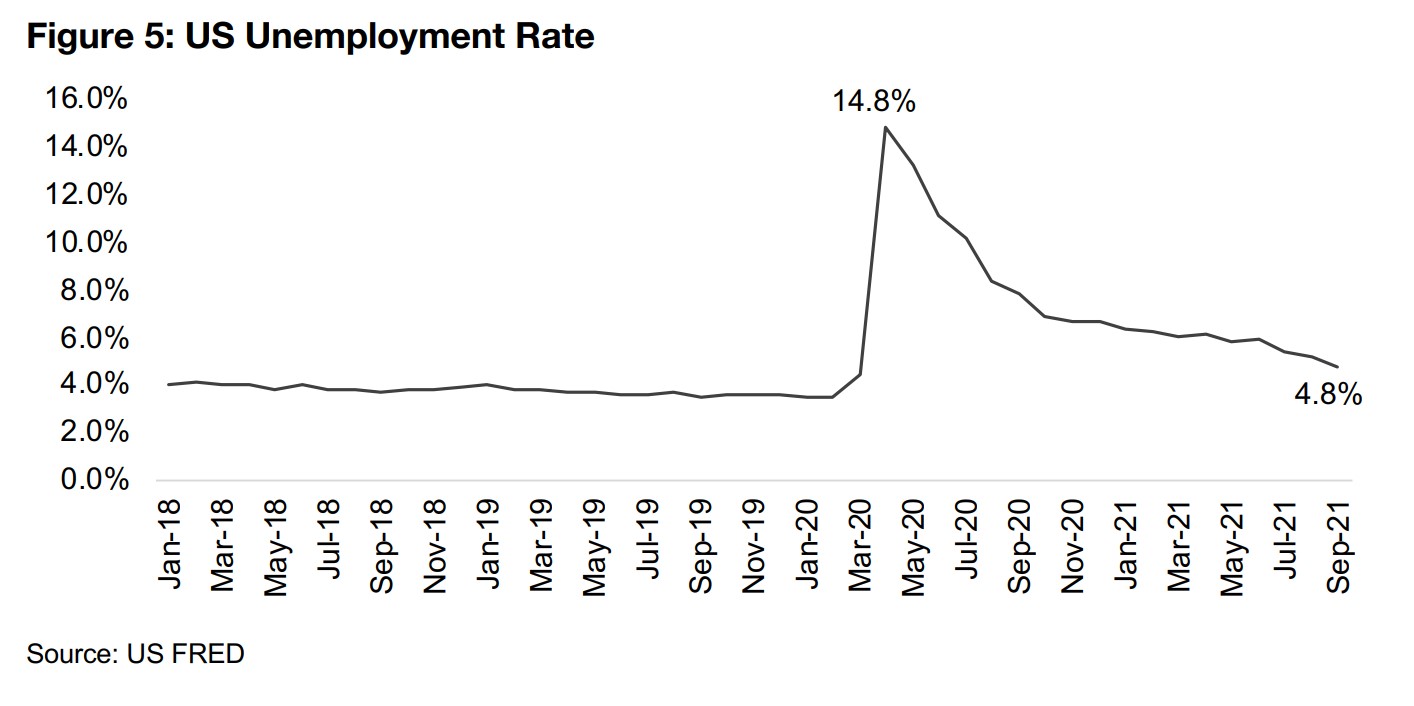
There are signs of the US labour market heating up in the most recent jobs reports,
with the unemployment rate hitting a post-crisis low of 4.8% as of September, down
from a peak of 14.8% in April 2020, and heading towards pre-crisis levels (Figure 5).
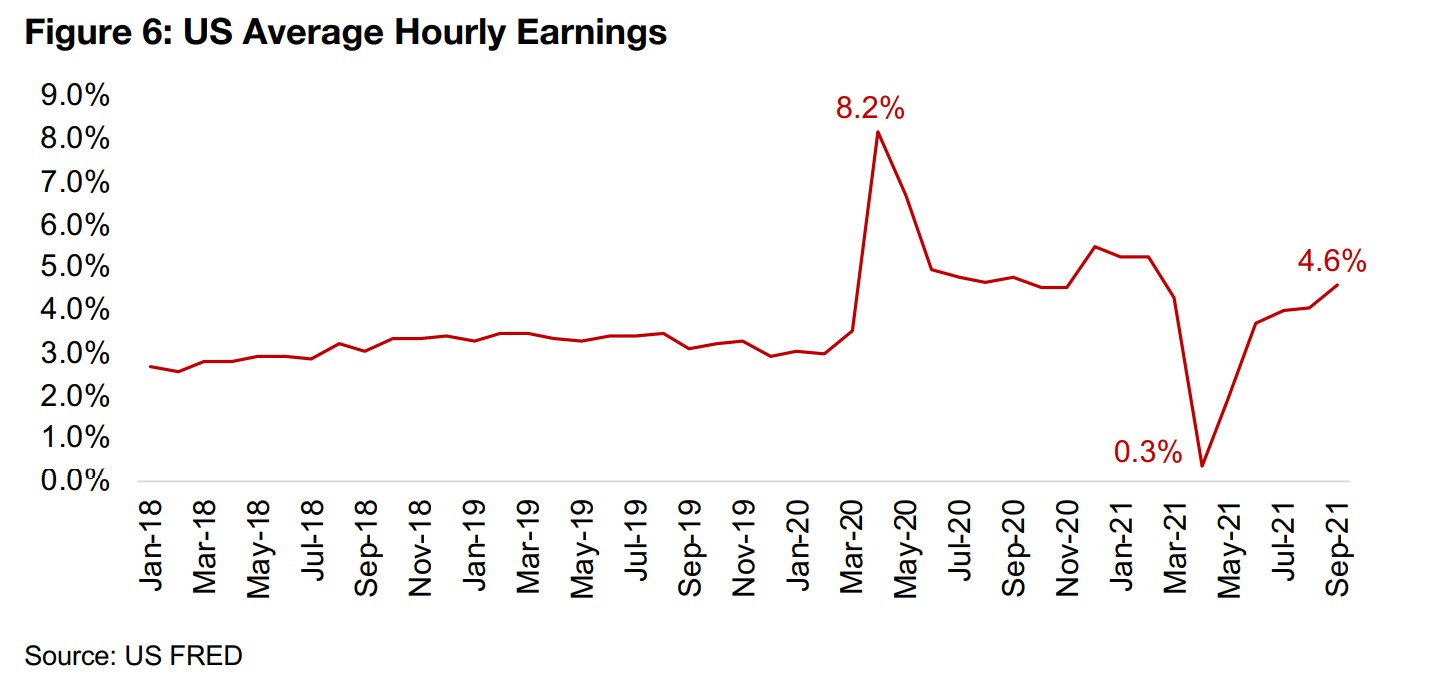
There has also been a jump in wage growth yoy to 4.6% in September, up from a low
of 0.3% in April 2020 (Figure 6). This is considerably higher than pre-crisis wage
growth, and while we need to take into account that the current period is one of
severe distortions that may not persist, we may not want to entirely discount early
hints of a wage-price spiral. For gold, of course, such a development could be a very
strong upward driver.
Gold demand and supply beyond monetary expansion
This week we review the demand and supply factors that affect the gold price beyond
monetary expansion, which tends to be our main focus in covering gold. This is
because this factor, gold's role as a monetary substitute, and a hedge against the
devaluation of fiat currencies over time, above all seems to be the key driver of the
metal. However, there are other factors that also affect the gold demand and supply
balance and can have some marginal effects on the gold price, even if they tend to
be generally far outshone by the root driver of monetary expansion.
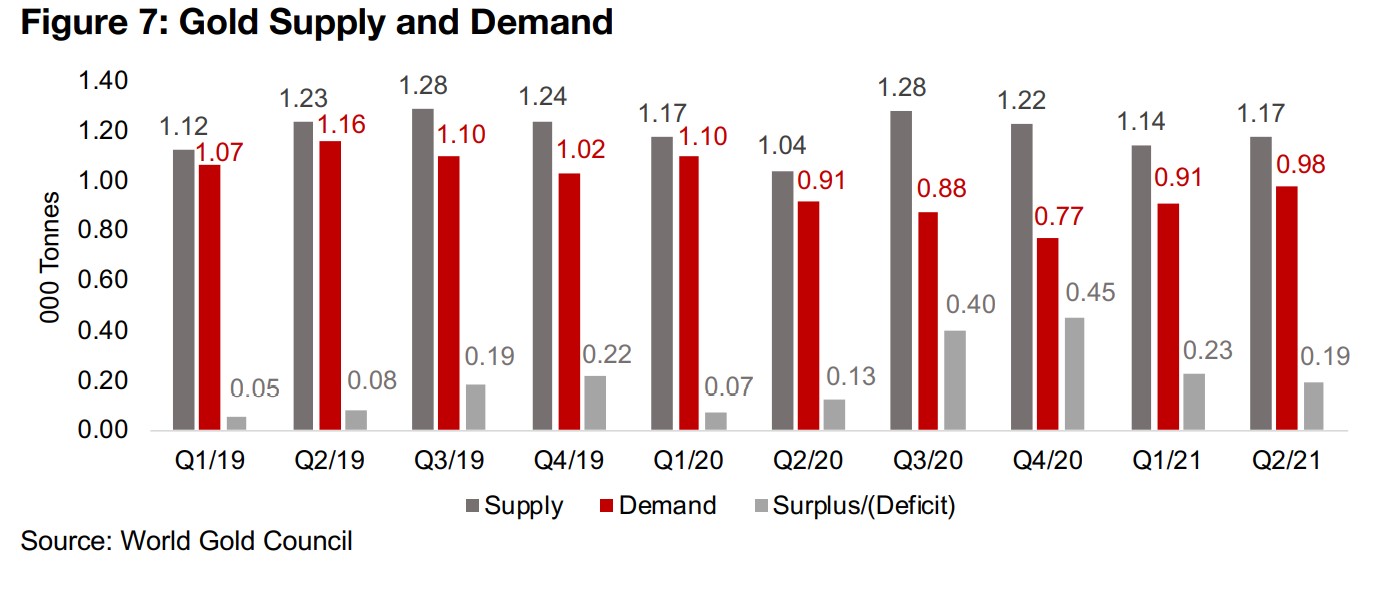
Comparing gold demand and supply in Figure 7, we can see that the gold market has
been in 'surplus' in recent years, reaching a peak of 0.40k and 0.45k tonnes in Q3/20
and Q4/20. Supply, comprising mainly mine output and recycled gold, has grown an
average 0.6%/quarter since 2019, while demand fell -7.8%/quarter, with the
remainder held in inventories. We put 'surplus' in quotes here, because in contrast to
many metals, for which the bulk of demand is for actual use in industrial processes,
most of the demand for gold is about holding it as a store of value. Therefore rising
'inventories' do not necessarily affect gold's price like it might for other metals.
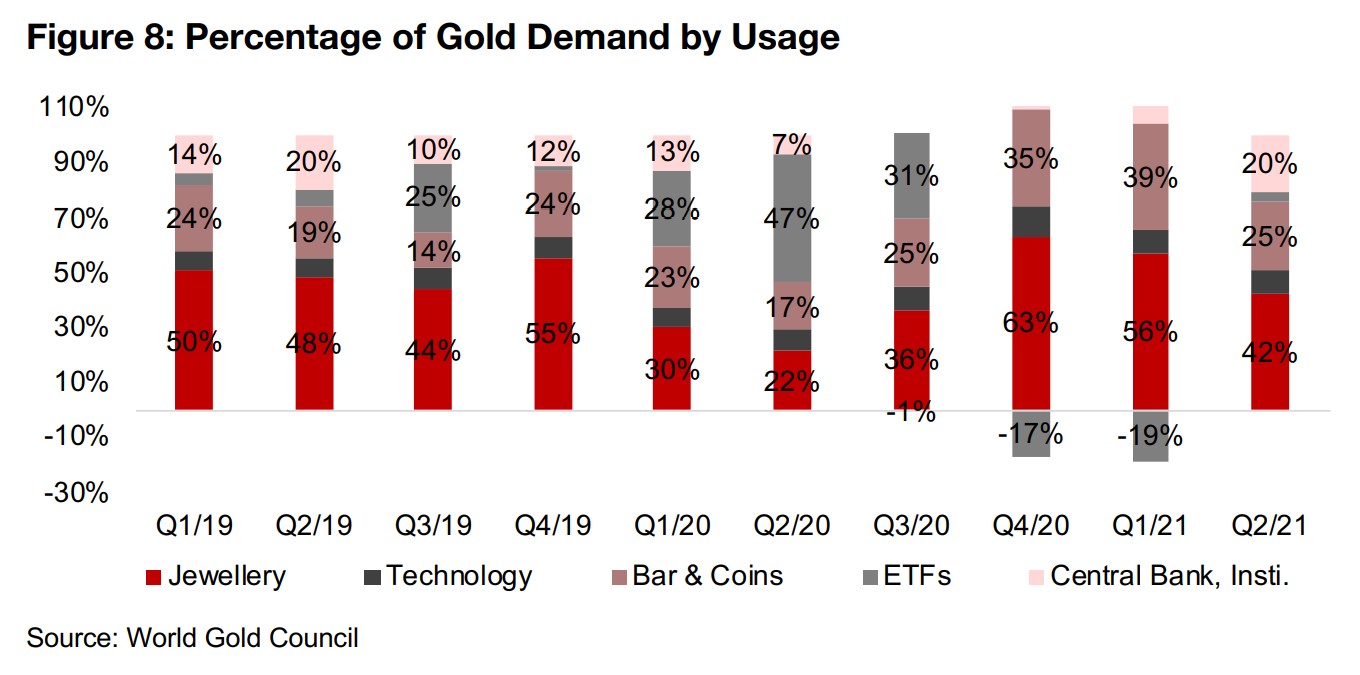
We can see this in the demand categories for gold, with gold jewelry at 44.7% of the
total since 2019, gold bars and coins at 24.4%, central banks at 11.7% and ETFs at
11.1%, which are really demand for gold as a store of value (Figure 8). The actual
'use' of gold, in technology, comprises only 8.2% of demand. This makes it quite a
unique, with even its closest cousin, silver, having a much larger component of
industrial related demand, which could see it affected more by rising inventories.
Demand for gold is really about storing the metal in various forms as a hedge against
the devaluation of other forms of money, especially fiat currency, which brings us
back to monetary expansion as the real driver behind gold.
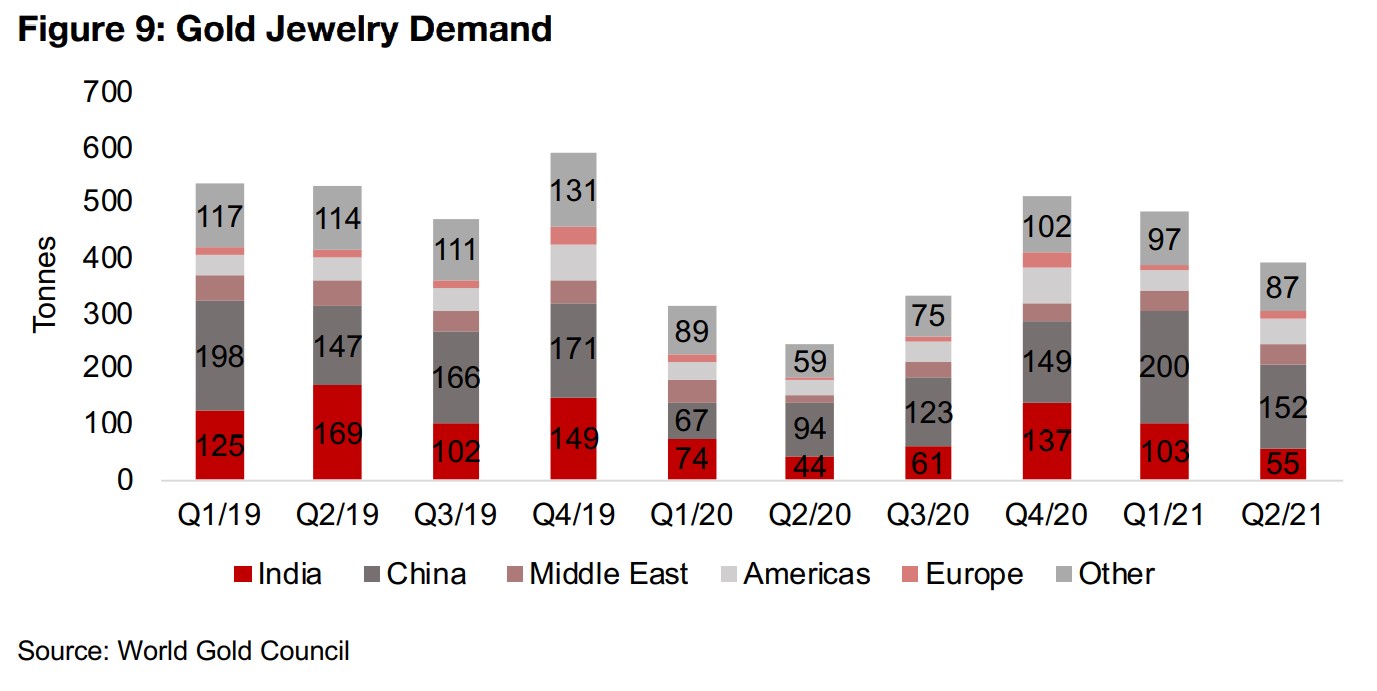
Jewelry demand for gold is driven especially by India and China, which accounted for 56.0% of total gold jewelry demand on average since 2019 (Figure 9). This segment was hit dramatically over the first half of 2020 by the global health crisis, as consumers pulled back on purchasing jewelry, and partly because of supply side constraints with production capacity shut down. However, jewelry demand rebounded considerably in H2/20 and peaked at Q4/20, especially driven by China demand, which reached 200 tonnes in Q1/21, higher than prior to the crisis. However, with total jewelry demand easing in Q1/21 and Q2/21, if the post-global crisis rebound continues to ease, we could see jewelry demand for gold remain off the Q4/20 peak.
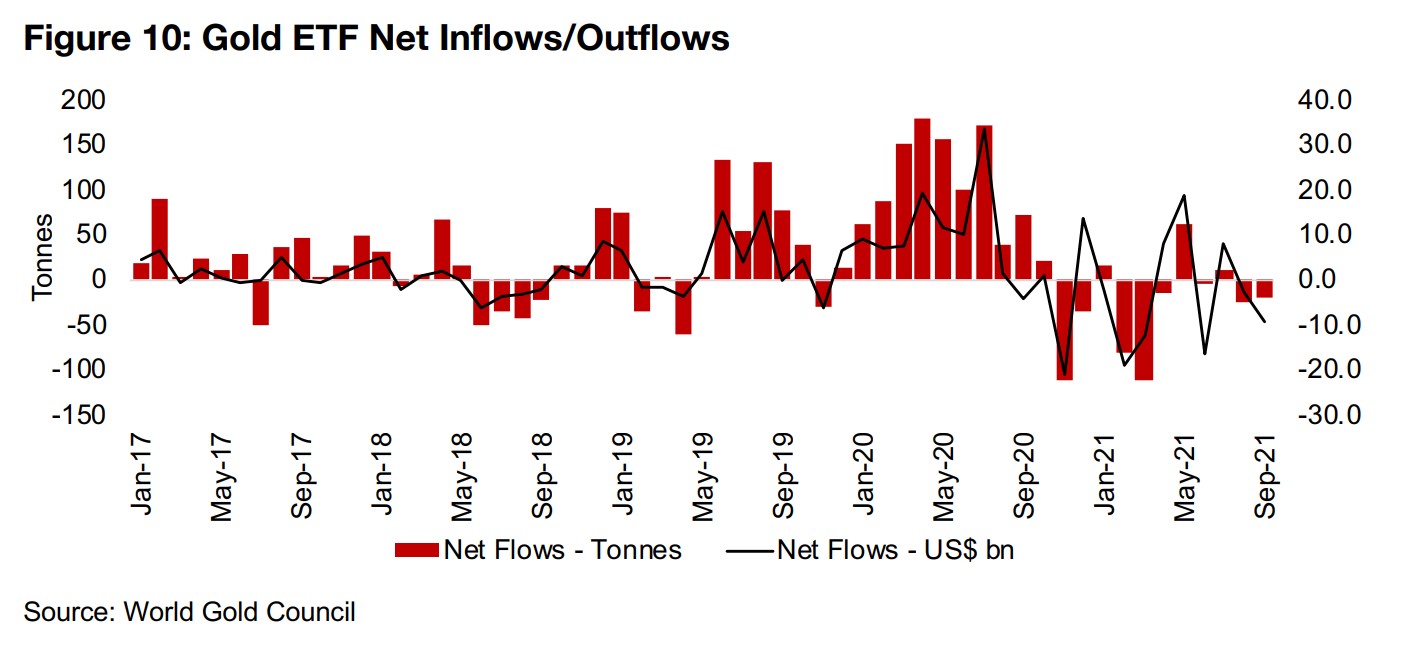
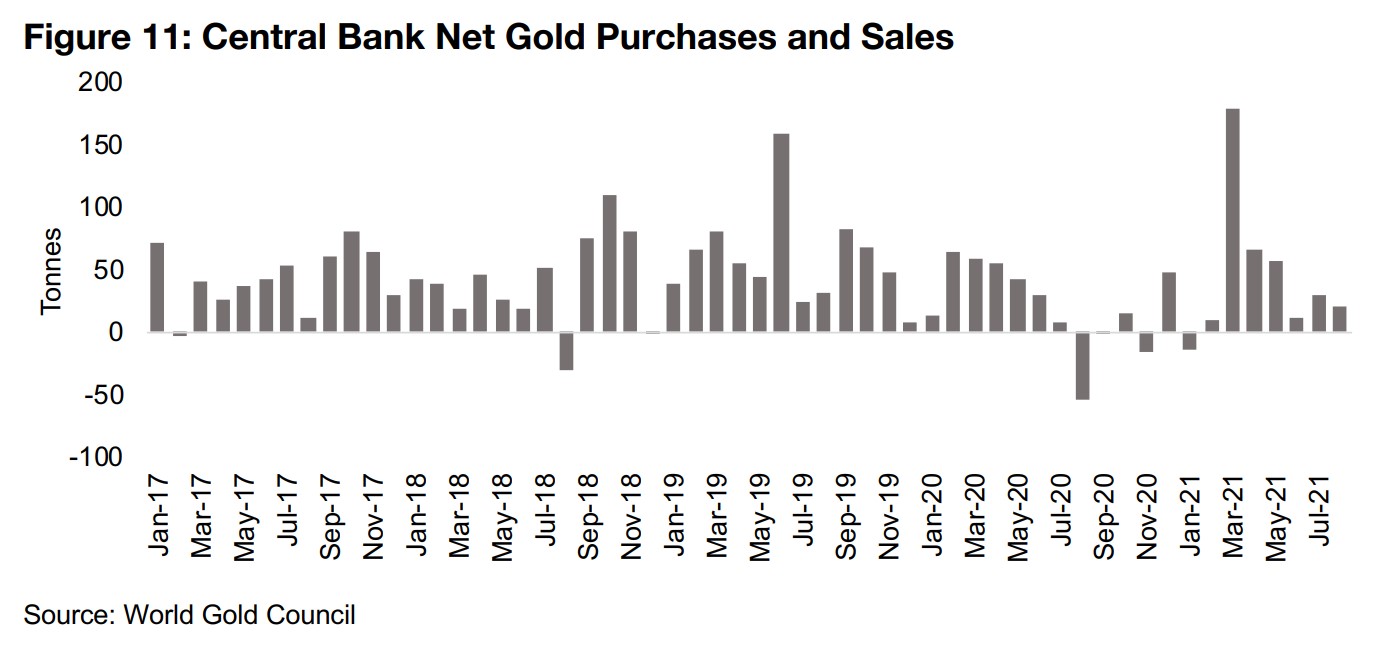
Gold ETF flows are driven by funds having requirements to hold a certain level of gold to back their assets. ETF inflows surged in the first half of 2020 as the gold price spiked on a flight to safety, reaching a peak of 178.0 tonnes in April 2020, and remaining high through to July 2020 (Figure 10). However, as peak global-health-crisis fears passed, and gold price fell from August 2020, there were outflows as ETFs reduced gold holdings. Net flows have come roughly in balance in recent months, as the gold price has remained relatively flat. Central banks have overall been making significant purchases of gold over the past five years, averaging 41.5 tonnes per month since 2017 (Figure 11). While net gold purchases were reasonably high during the early months of the crisis, they dipped to a net outflow over H2/20 as fears of a long meltdown eased. Central Bank purchases overall have resumed in 2021, including the strongest month in many years, at 178 tonnes in April 2021.
Producers jump as gold gains most in months
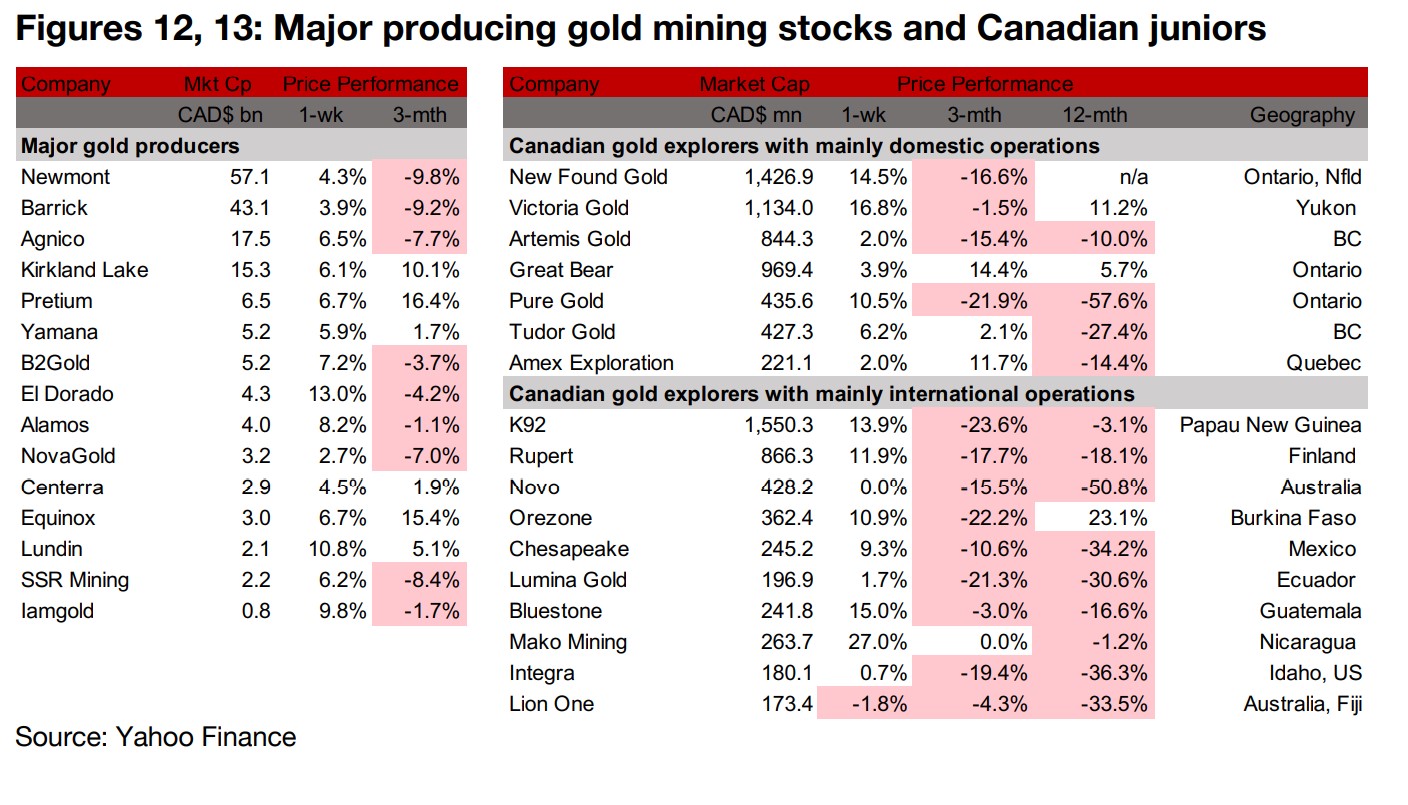
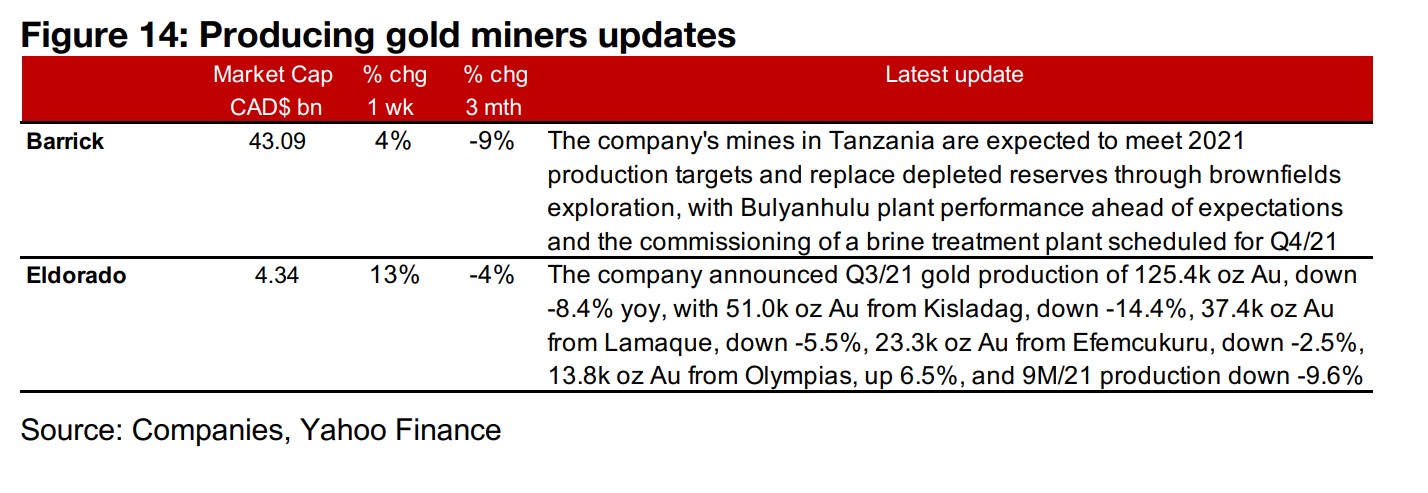
The producing gold miners all jumped as gold saw its largest weekly gains in months after the Fed indicated that it would be making only a very gradual, and not aggressive, reduction in its stimulus (Figure 12). Barrick provided an update on its Tanzania mines, which are expected to meet 2021 production targets and replace depleted reserves through brownfields exploration. Eldorado Gold announced Q3/21 gold production of 125.4k oz Au, down -8.4% yoy (Figure 14).
Canadian juniors see major gains on gold rise
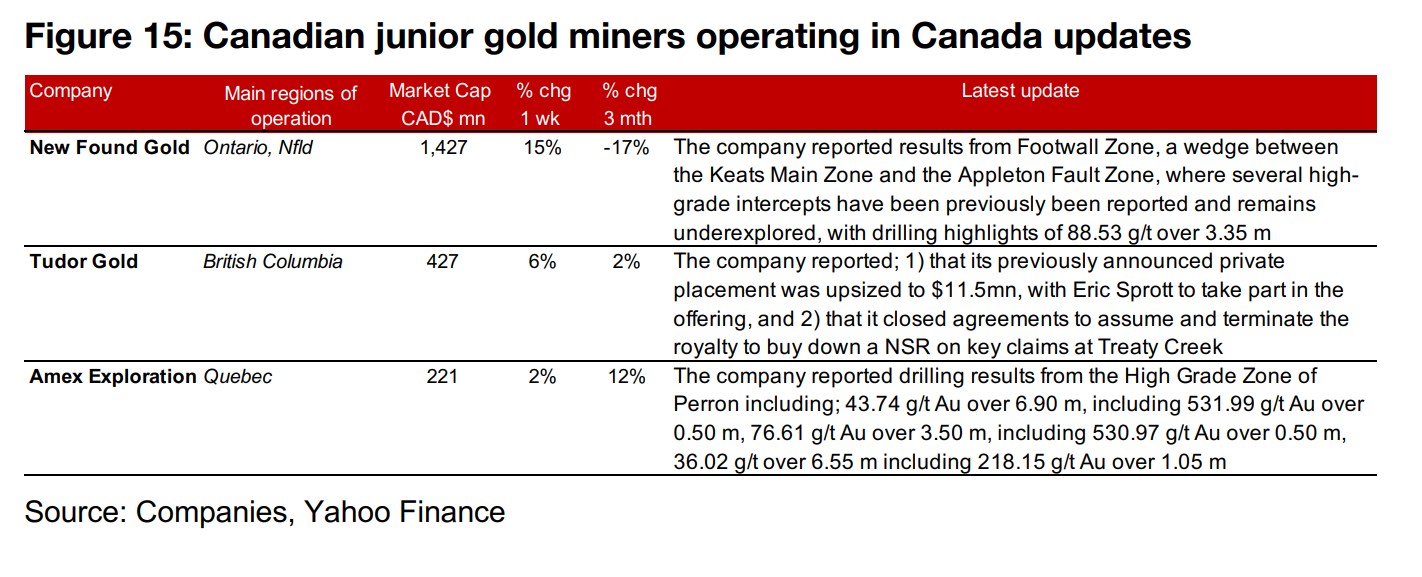
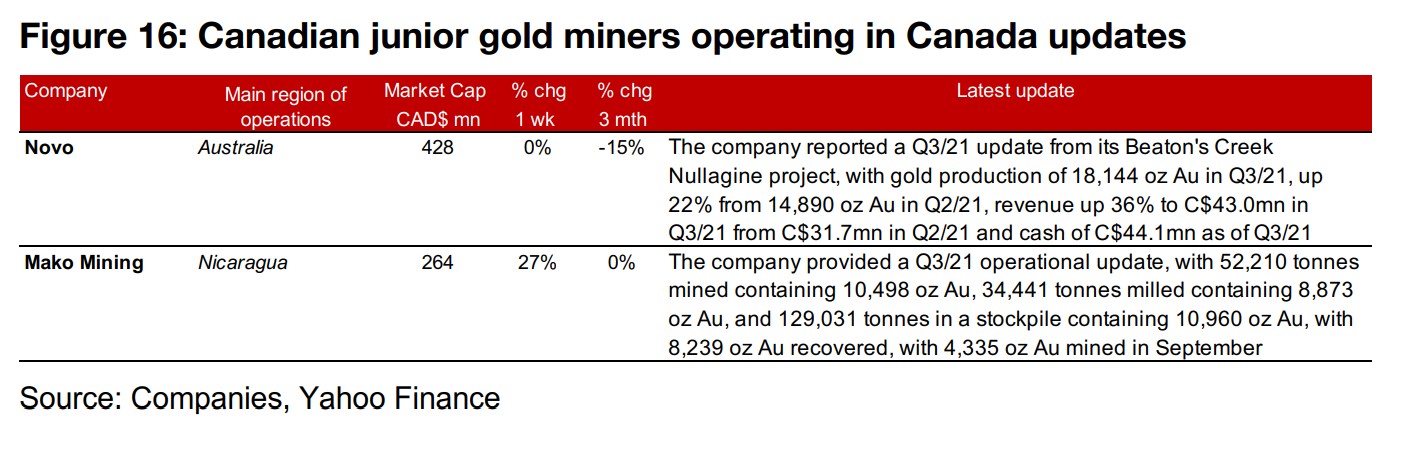
The Canadian juniors saw major gains on the rise in the gold price with many up over 10% for the week and only Lion One seeing a marginal decline (Figure 13). For the Canadian juniors operating mainly domestically, New Found Gold reported results from the Footwall Zone between the Keats Main Zone and the Appleton Fault at Queensway. Tudor reported an upsizing of its previously announced private placement to $11.5mn, with Eric Sprott to subscribe, and that it closed its agreements to assume and terminate the royalty to buy down a NSR on key claims at Treaty Creek. Amex reported drilling results from the High Grade Zone at Perron (Figure 15). For the Canadian juniors operating mainly internationally, Novo reported a Q3/21 update from its Beaton Creek Nullagine project and Mako Mining provided a Q3/21 operational update (Figure 16).
Disclaimer: This report is for informational use only and should not be used an alternative to the financial and legal advice of a qualified professional in business planning and investment. We do not represent that forecasts in this report will lead to a specific outcome or result, and are not liable in the event of any business action taken in whole or in part as a result of the contents of this report.